- Kibana Guide: other versions:
- What is Kibana?
- What’s new in 8.3
- Kibana concepts
- Quick start
- Set up
- Install Kibana
- Configure Kibana
- Alerting and action settings
- APM settings
- Banners settings
- Enterprise Search settings
- Fleet settings
- i18n settings
- Logging settings
- Logs settings
- Metrics settings
- Monitoring settings
- Reporting settings
- Search sessions settings
- Secure settings
- Security settings
- Spaces settings
- Task Manager settings
- Telemetry settings
- URL drilldown settings
- Start and stop Kibana
- Access Kibana
- Securing access to Kibana
- Add data
- Upgrade Kibana
- Configure security
- Configure reporting
- Configure logging
- Configure monitoring
- Command line tools
- Production considerations
- Discover
- Dashboard and visualizations
- Canvas
- Maps
- Build a map to compare metrics by country or region
- Track, visualize, and alert on assets in real time
- Map custom regions with reverse geocoding
- Heat map layer
- Tile layer
- Vector layer
- Plot big data
- Search geographic data
- Configure map settings
- Connect to Elastic Maps Service
- Import geospatial data
- Troubleshoot
- Reporting and sharing
- Machine learning
- Graph
- Alerting
- Observability
- APM
- Security
- Dev Tools
- Fleet
- Osquery
- Stack Monitoring
- Stack Management
- REST API
- Get features API
- Kibana spaces APIs
- Kibana role management APIs
- User session management APIs
- Saved objects APIs
- Data views API
- Index patterns APIs
- Alerting APIs
- Action and connector APIs
- Cases APIs
- Import and export dashboard APIs
- Logstash configuration management APIs
- Machine learning APIs
- Short URLs APIs
- Get Task Manager health
- Upgrade assistant APIs
- Kibana plugins
- Troubleshooting
- Accessibility
- Release notes
- Developer guide
Filters
editFilters
editGlobal filters are ways you can filter data across the APM app based on a specific time range or environment. They are available in the Services, Transactions, Errors, Metrics, and Traces views, and any filter applied will persist as you move between pages.
If you prefer to use advanced queries on your data to filter on specific pieces of information, see Query your data.
Global time range
editThe global time range filter in Kibana restricts APM data to a specific time period.
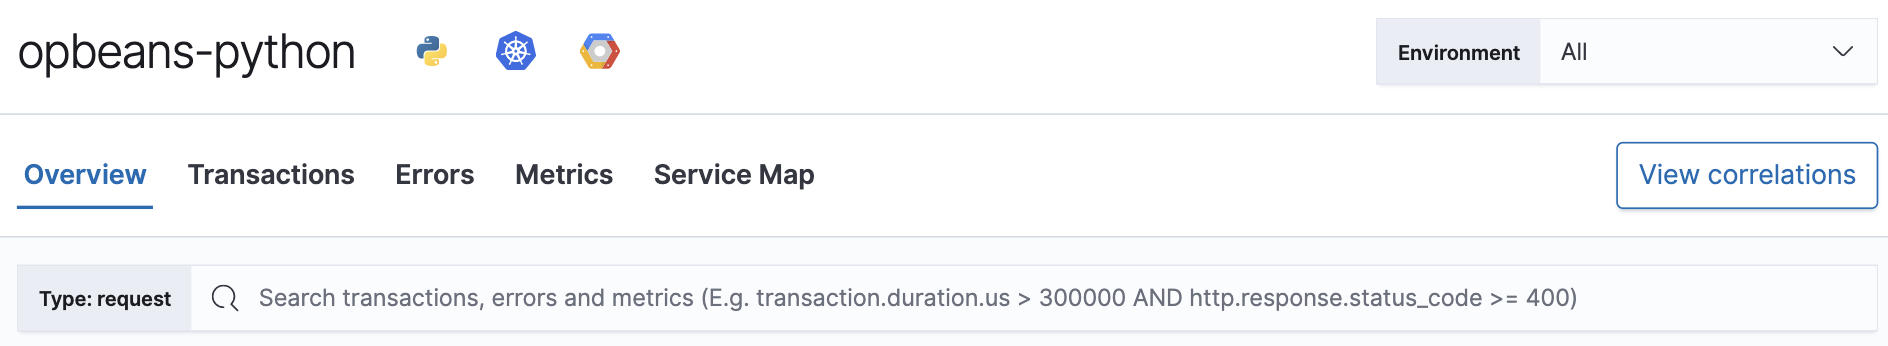
Service environment filter
editThe environment selector is a global filter for service.environment
.
It allows you to view only relevant data and is especially useful for separating development from production environments.
By default, all environments are displayed. If there are no environment options, you’ll see "not defined".
Service environments are defined when configuring your APM agents. It’s vital to be consistent when naming environments in your agents. To learn how to configure service environments, see the specific agent documentation:
-
Go:
ELASTIC_APM_ENVIRONMENT
- iOS agent: Not yet supported
-
Java:
environment
-
.NET:
Environment
-
Node.js:
environment
-
PHP:
environment
-
Python:
environment
-
Ruby:
environment
-
Real User Monitoring:
environment
On this page