Services
editServices
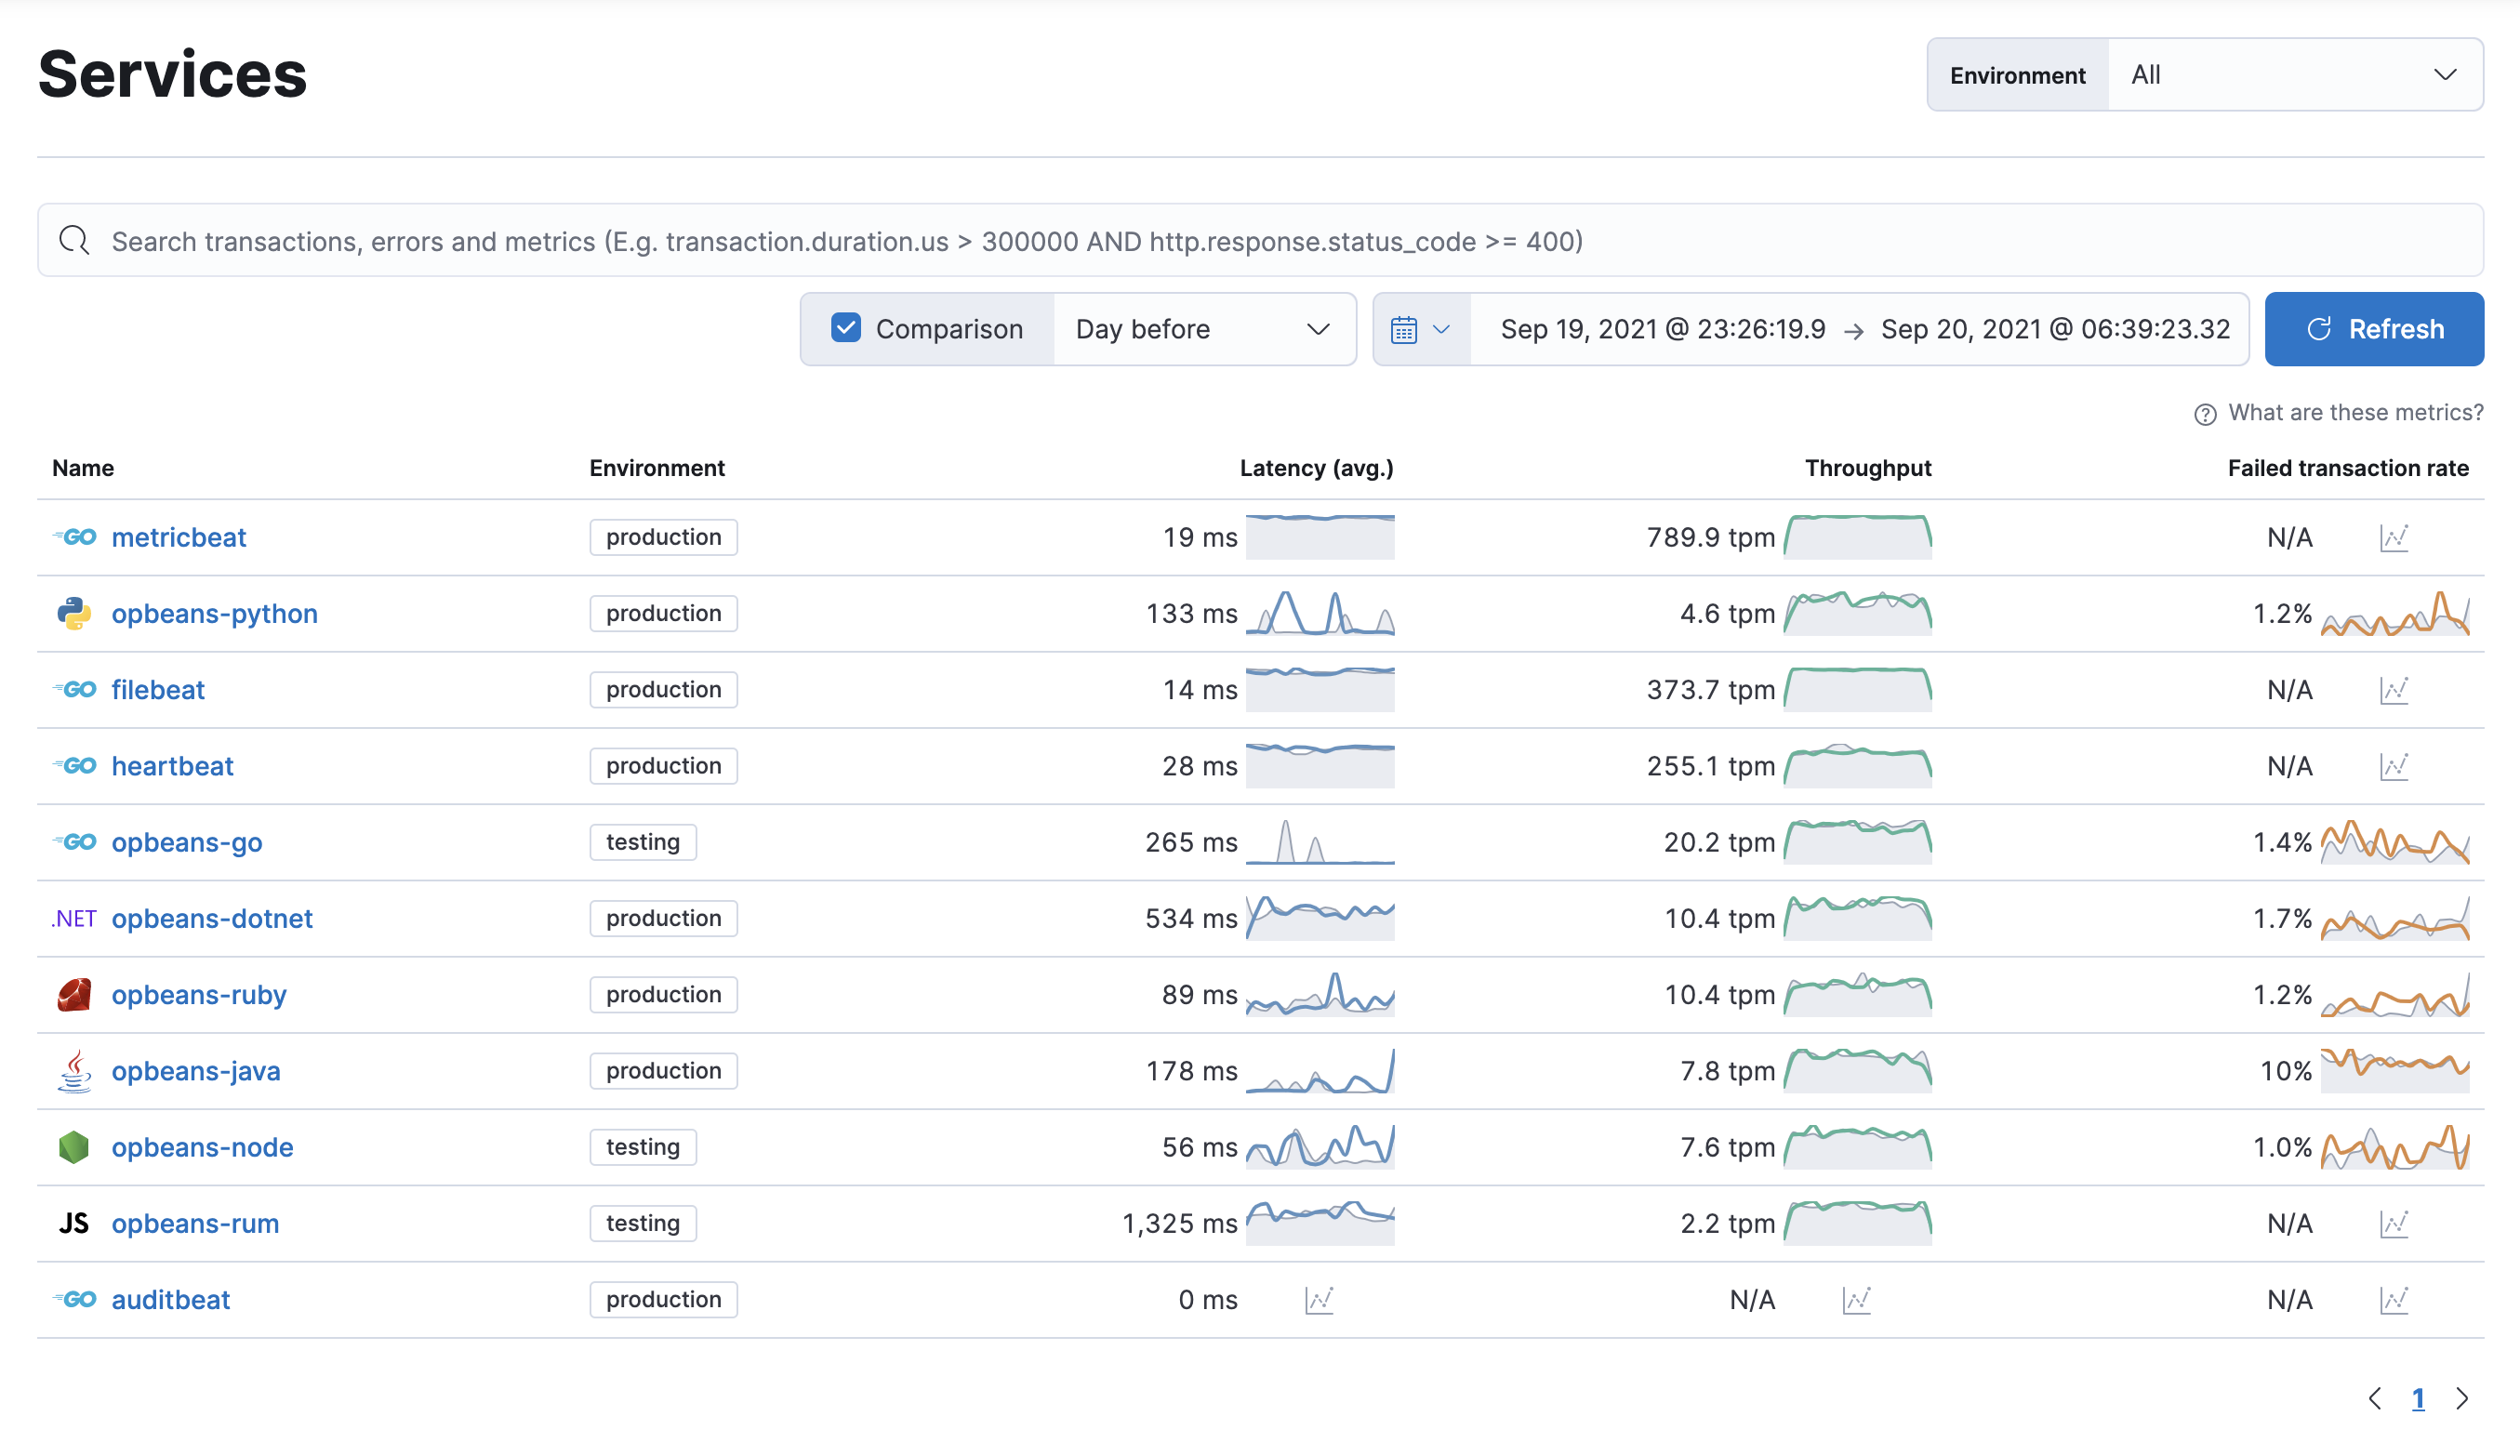
editService inventory provides a quick, high-level overview of the health and general performance of all instrumented services.
To help surface potential issues, services are sorted by their health status: critical > warning > healthy > unknown. Health status is powered by machine learning and requires anomaly detection to be enabled.
Service groups
editThis functionality is in technical preview and may be changed or removed in a future release. Elastic will work to fix any issues, but features in technical preview are not subject to the support SLA of official GA features.
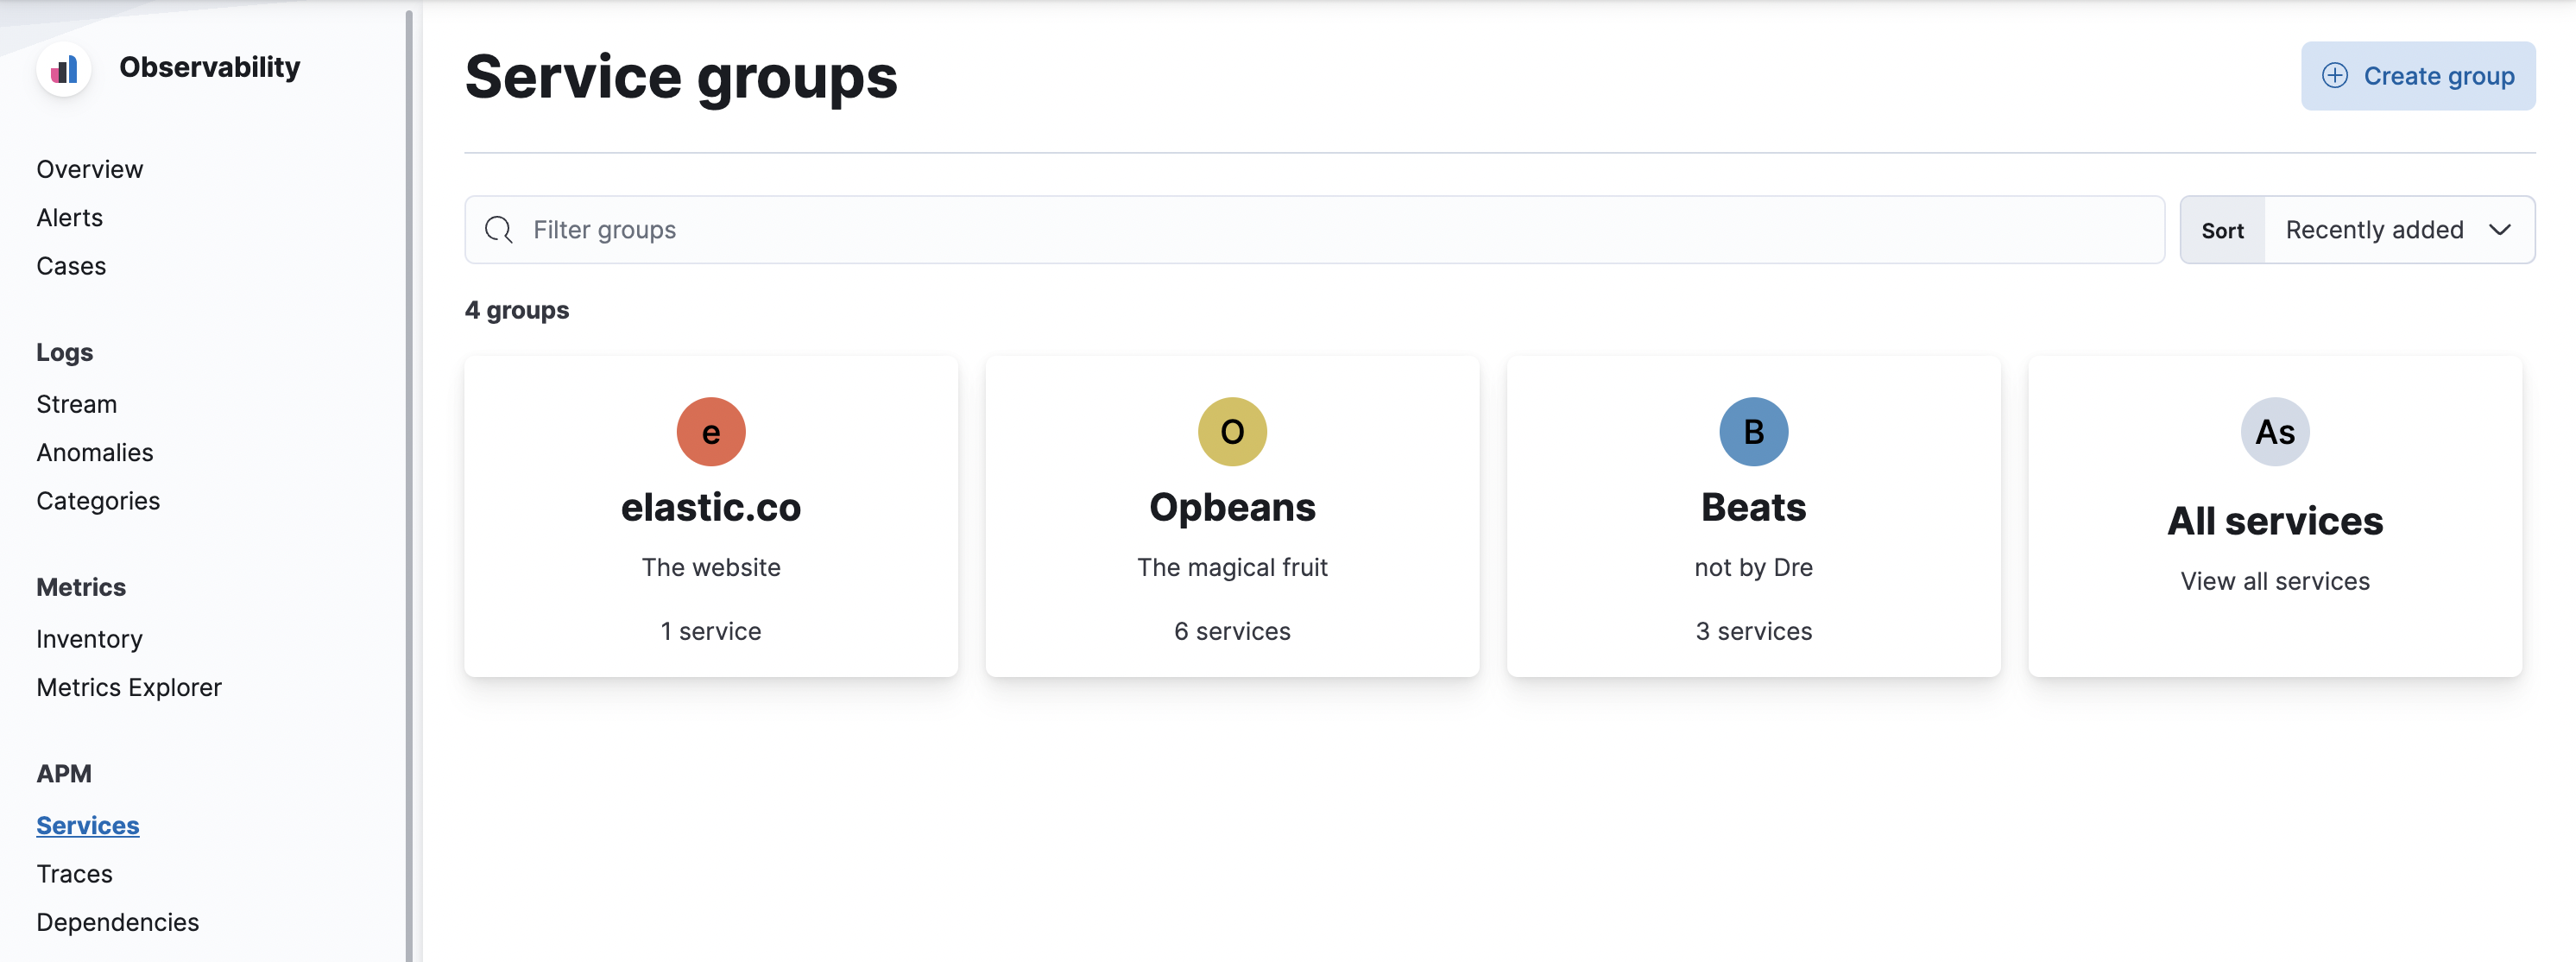
Group services together to build meaningful views that remove noise and simplify investigations across services. Service groups are Kibana space-specific and available for any users with appropriate access.
To enable Service groups, open Kibana and navigate to Stack Management > Advanced Settings > Observability, and enable the Service groups feature.
To create a service group, navigate to Observability > APM > Services and select Create group. Specify a name, color, and description. Then, using the Kibana Query Language (KQL), specify a query to select services for the group. Services that match the query within the last 24 hours will be assigned to the group.
Once a service group has been saved, this list of services within it is static. If a newly added service matches the KQL query, it will not be automatically added to the service group. Similarly, if a service stops matching the KQL query, it will not be removed from the group.
To update the list of services within a group, edit the service group, click Refresh next to the KQL query, and click Save group.
Examples
Not sure where to get started? Here are some sample queries you can build from:
-
Group services by environment—in this example, "production":
service.environment : "production" -
Group services by name—this example groups those that end in "beat":
service.name : *beat(matches services named "Auditbeat", "Heartbeat", "Filebeat", etc.) -
Group services with a high transaction duration in the last 24 hours:
transaction.duration.us >= 50000000