- Kibana Guide: other versions:
- What is Kibana?
- What’s new in 8.3
- Kibana concepts
- Quick start
- Set up
- Install Kibana
- Configure Kibana
- Alerting and action settings
- APM settings
- Banners settings
- Enterprise Search settings
- Fleet settings
- i18n settings
- Logging settings
- Logs settings
- Metrics settings
- Monitoring settings
- Reporting settings
- Search sessions settings
- Secure settings
- Security settings
- Spaces settings
- Task Manager settings
- Telemetry settings
- URL drilldown settings
- Start and stop Kibana
- Access Kibana
- Securing access to Kibana
- Add data
- Upgrade Kibana
- Configure security
- Configure reporting
- Configure logging
- Configure monitoring
- Command line tools
- Production considerations
- Discover
- Dashboard and visualizations
- Canvas
- Maps
- Build a map to compare metrics by country or region
- Track, visualize, and alert on assets in real time
- Map custom regions with reverse geocoding
- Heat map layer
- Tile layer
- Vector layer
- Plot big data
- Search geographic data
- Configure map settings
- Connect to Elastic Maps Service
- Import geospatial data
- Troubleshoot
- Reporting and sharing
- Machine learning
- Graph
- Alerting
- Observability
- APM
- Security
- Dev Tools
- Fleet
- Osquery
- Stack Monitoring
- Stack Management
- REST API
- Get features API
- Kibana spaces APIs
- Kibana role management APIs
- User session management APIs
- Saved objects APIs
- Data views API
- Index patterns APIs
- Alerting APIs
- Action and connector APIs
- Cases APIs
- Import and export dashboard APIs
- Logstash configuration management APIs
- Machine learning APIs
- Short URLs APIs
- Get Task Manager health
- Upgrade assistant APIs
- Kibana plugins
- Troubleshooting
- Accessibility
- Release notes
- Developer guide
Access Kibana
editAccess Kibana
editThe fastest way to access Kibana is to use our hosted Elasticsearch Service. If you installed Kibana on your own, access Kibana through the web application.
Set up on cloud
editThere’s no faster way to get started than with Elastic Cloud:
- Sign up for a free trial.
- Follow the on-screen steps to create your first project.
That’s it! You’re ready to get some data into your project.
Log on to the web application
editIf you are using a self-managed deployment, access Kibana through the web application on port 5601.
-
Point your web browser to the machine where you are running Kibana and specify the port number. For example,
localhost:5601
orhttp://YOURDOMAIN.com:5601
.To remotely connect to Kibana, set server.host to a non-loopback address.
- Log on to your account.
- Go to the home page, then click Kibana.
- To make the Kibana page your landing page, click Make this my landing page.
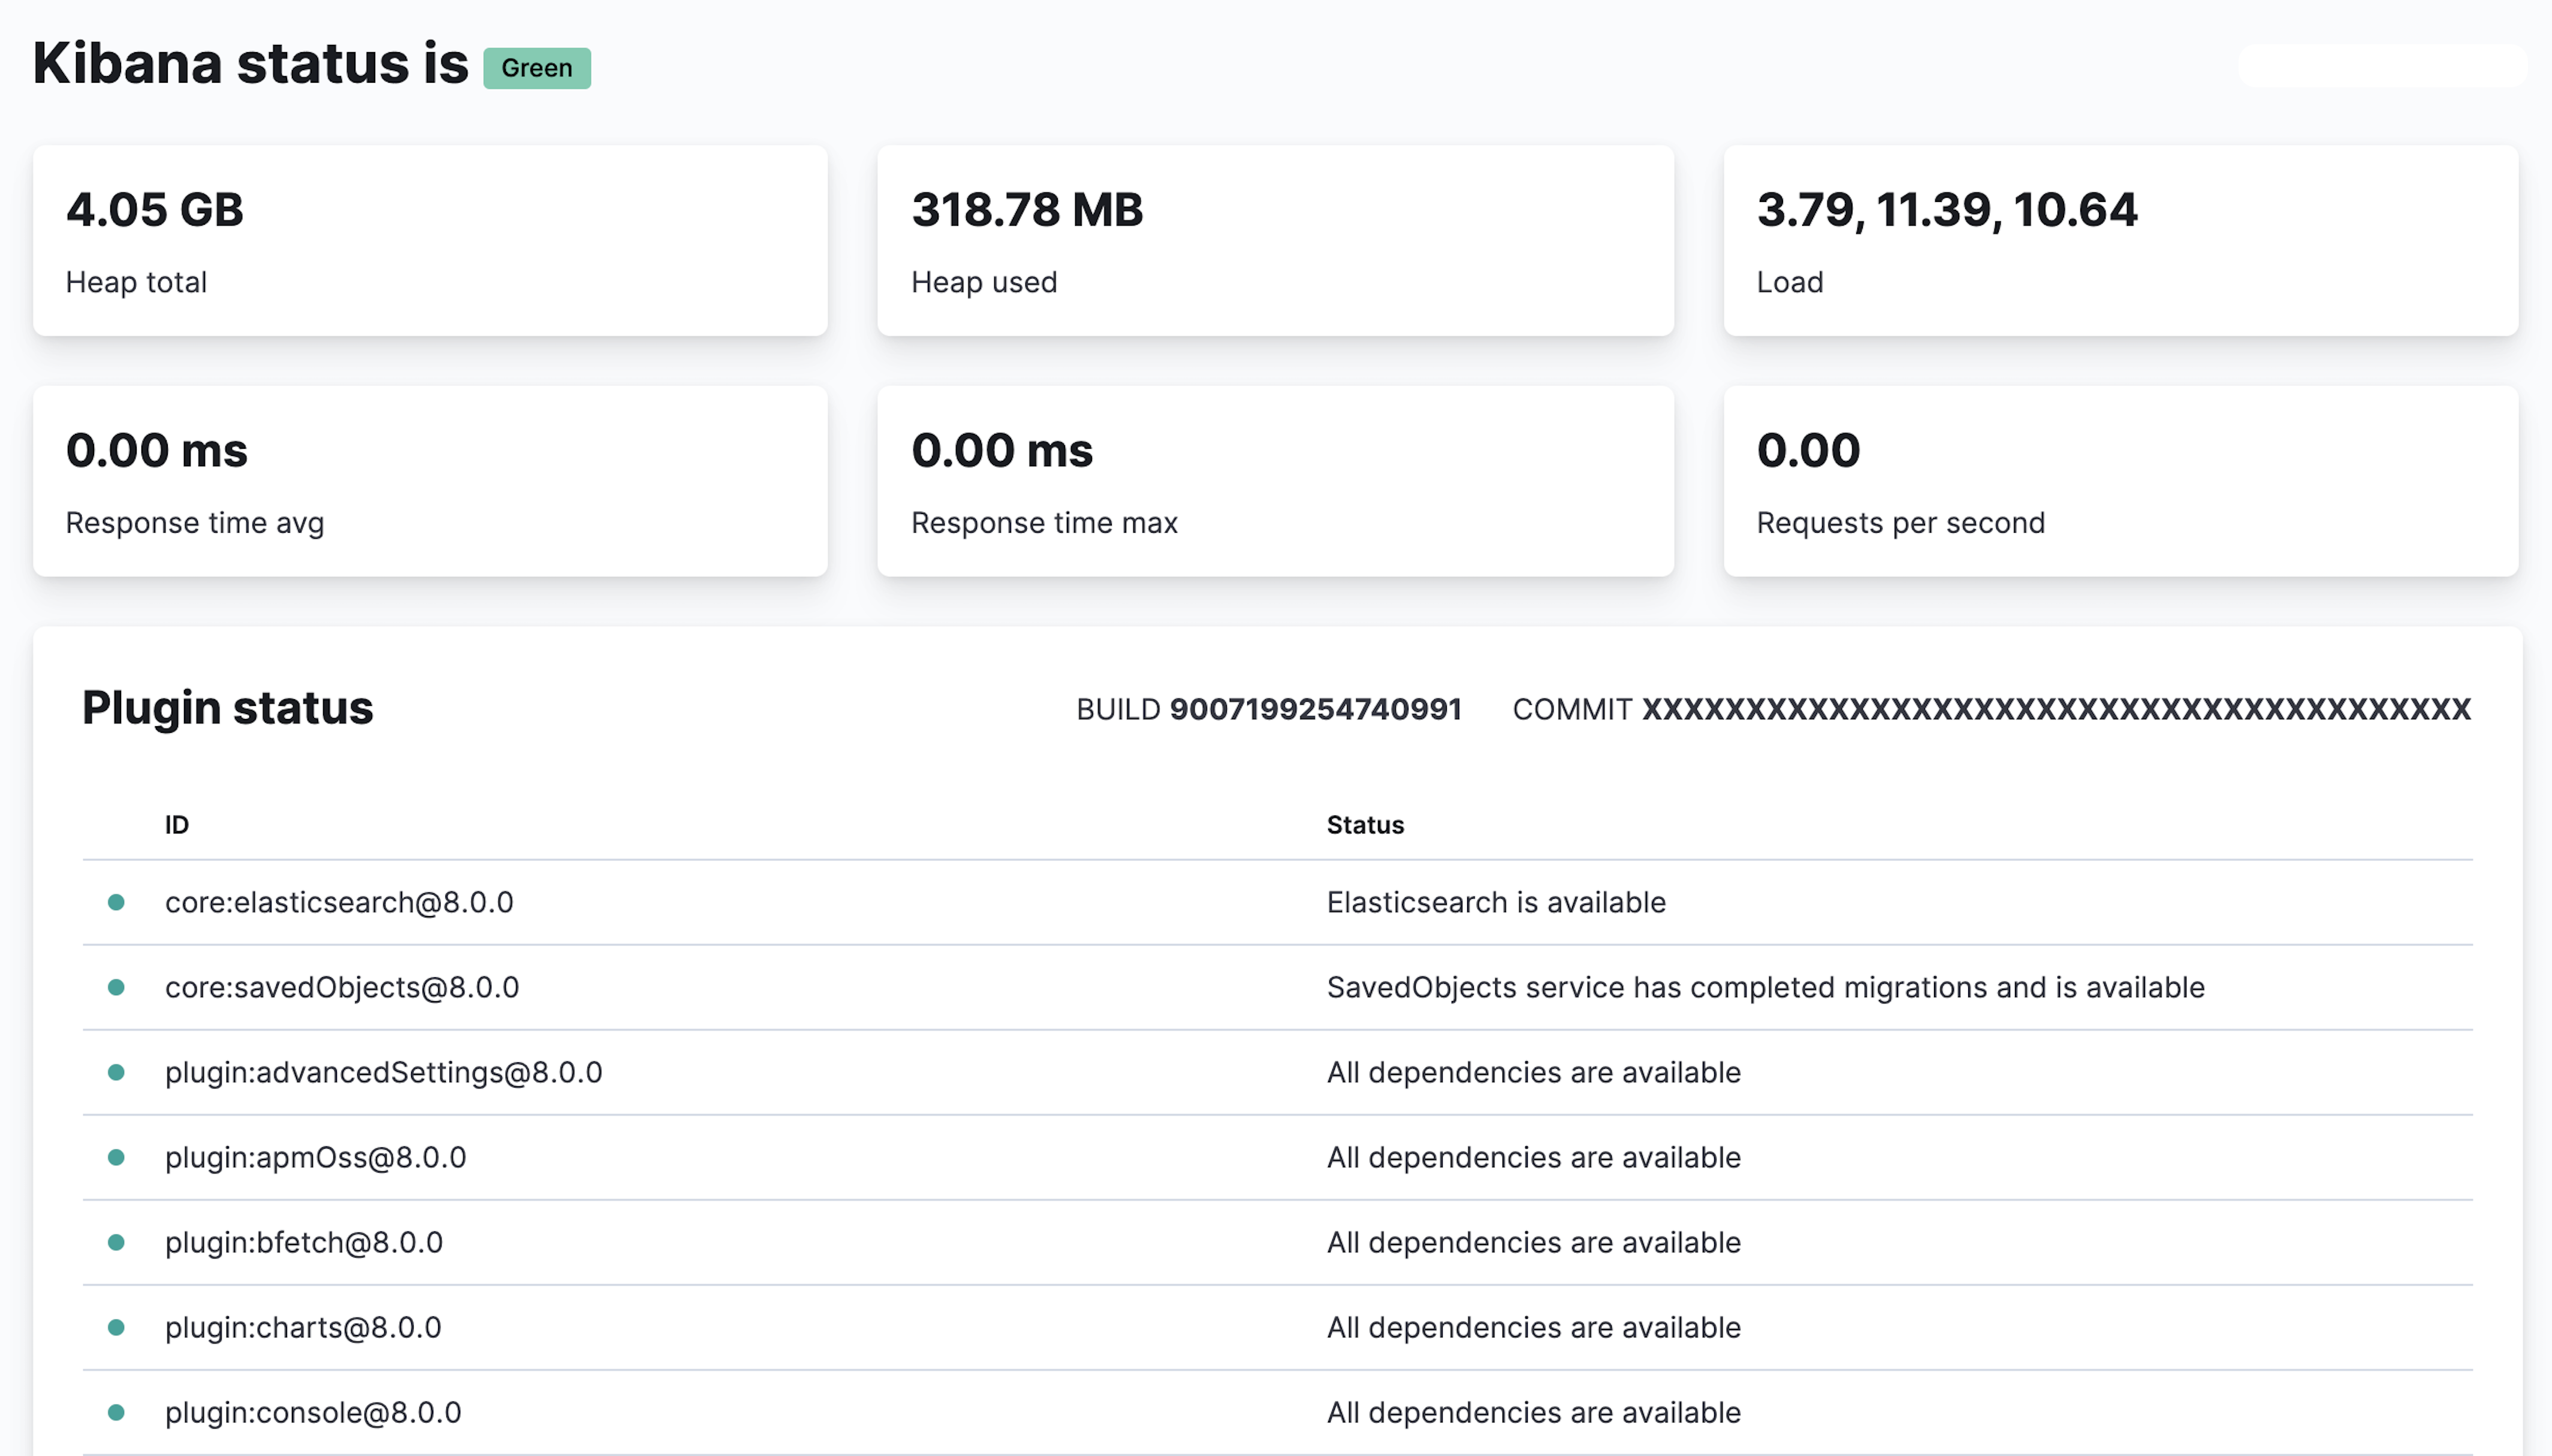
Check the Kibana status
editThe status page displays information about the server resource usage and installed plugins.
To view the Kibana status page, use the status endpoint. For example, localhost:5601/status
.
For JSON-formatted server status details, use the localhost:5601/api/status
API endpoint.
Kibana not ready
editIf you receive an error that the Kibana server is not ready
, check the following:
-
The Elasticsearch connectivity:
`curl -XGET elasticsearch_ip_or_hostname:9200/`
-
The Kibana logs:
-
Linux, DEB or RPM package:
/var/log/kibana/kibana.log
-
Linux, tar.gz package:
$KIBANA_HOME/log/kibana.log
-
Windows:
$KIBANA_HOME\log\kibana.log
-
Linux, DEB or RPM package:
-
The health status of
.kibana*
indices