Explore your documents
editExplore your documents
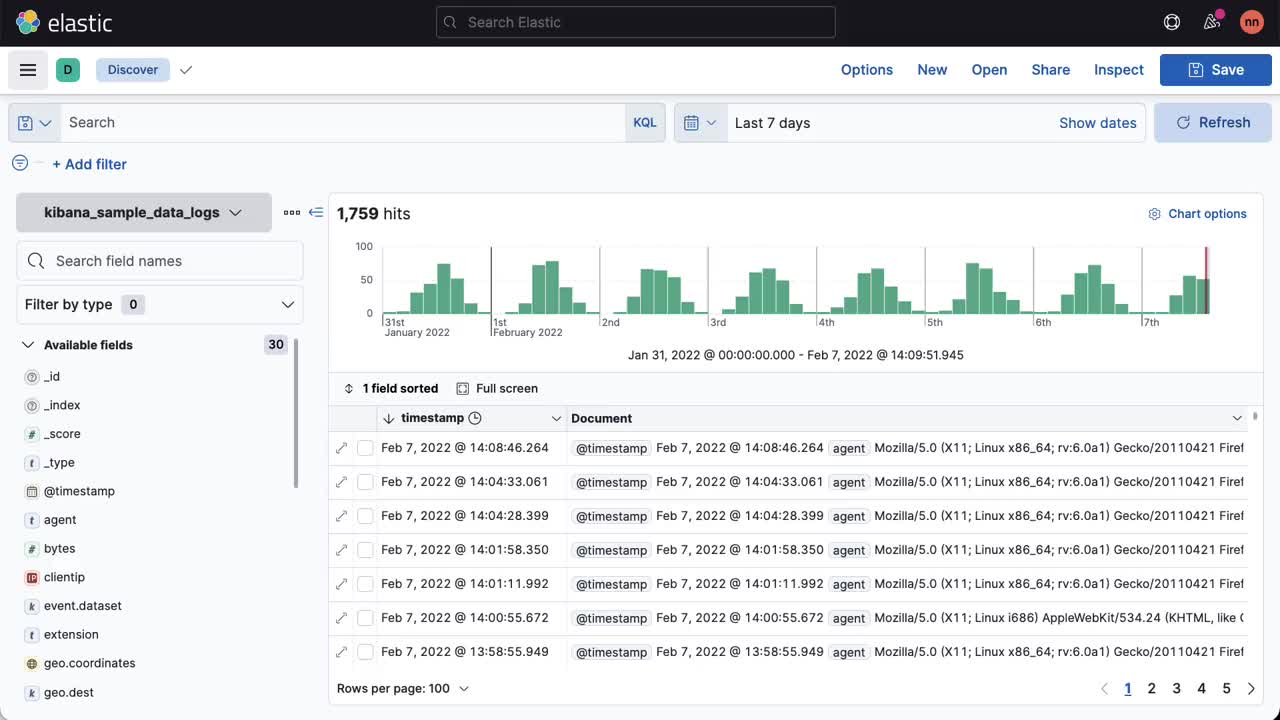
editDiscover displays your documents in table format, so you can best explore your data. Use the document table to resize columns, set row height, perform multi-column sorting, compare data, and more.
Reorder and resize columns
editUse drag and drop to organize the columns and improve the view of the data.
To reorder columns, do one of the following:
- Click Columns. In the pop-up, select the column you want to move and drag it to the new location.
- Click the header of the column you want to move. In the dropdown menu, click Move left or Move right.
To resize a column, drag the right edge of the column header until the column is the width that you want.
Column widths are stored with a saved search. When you visualize saved searches on dashboards, the saved search appears the same as in Discover.
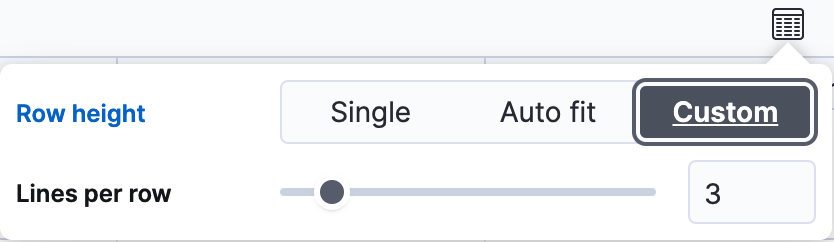
Adjust row height
editTo set the row height to 1 or more lines, or automatically
adjust the height to fit the contents, click the row height icon
![]() .
.
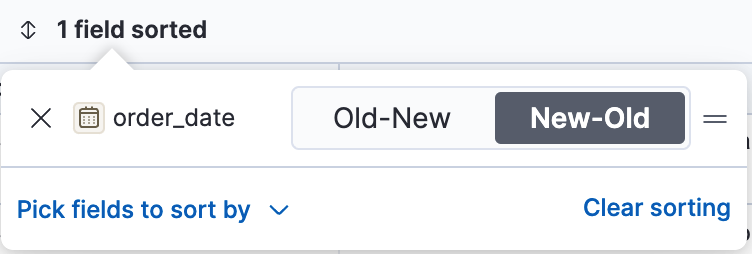
Sort data
editSort your data by one or more fields, in ascending or descending order. The default sort is based on the time field, from new to old.
To add or remove a sort on a single field, click the column header, and then select the sort order.
To sort by multiple fields:
-
In the document table, click the field sorted option.
-
To add more fields to the sort, select from the dropdown menu.
By default, columns are sorted in the order they are added.
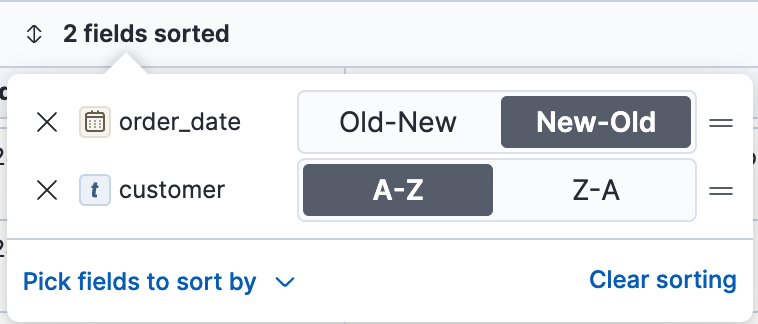
- To change the sort order, select a field in the pop-up, and then drag it to the new location.
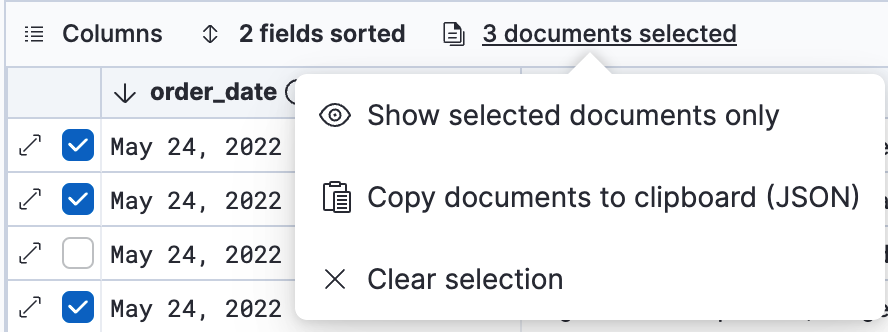
Compare data
editNarrow your results to a subset of documents to easily compare the data of interest.
- Select the documents you want to compare.
-
Click the documents selected option, and then select Show selected documents only.
Expand documents
editDive into an individual document to inspect its fields, set filters, and view the documents that occurred before and after it.
-
Click the expand icon
 .
.You can view the document in two ways. The Table view displays the document fields row-by-row. The JSON (JavaScript Object Notation) view allows you to look at how Elasticsearch returns the document.
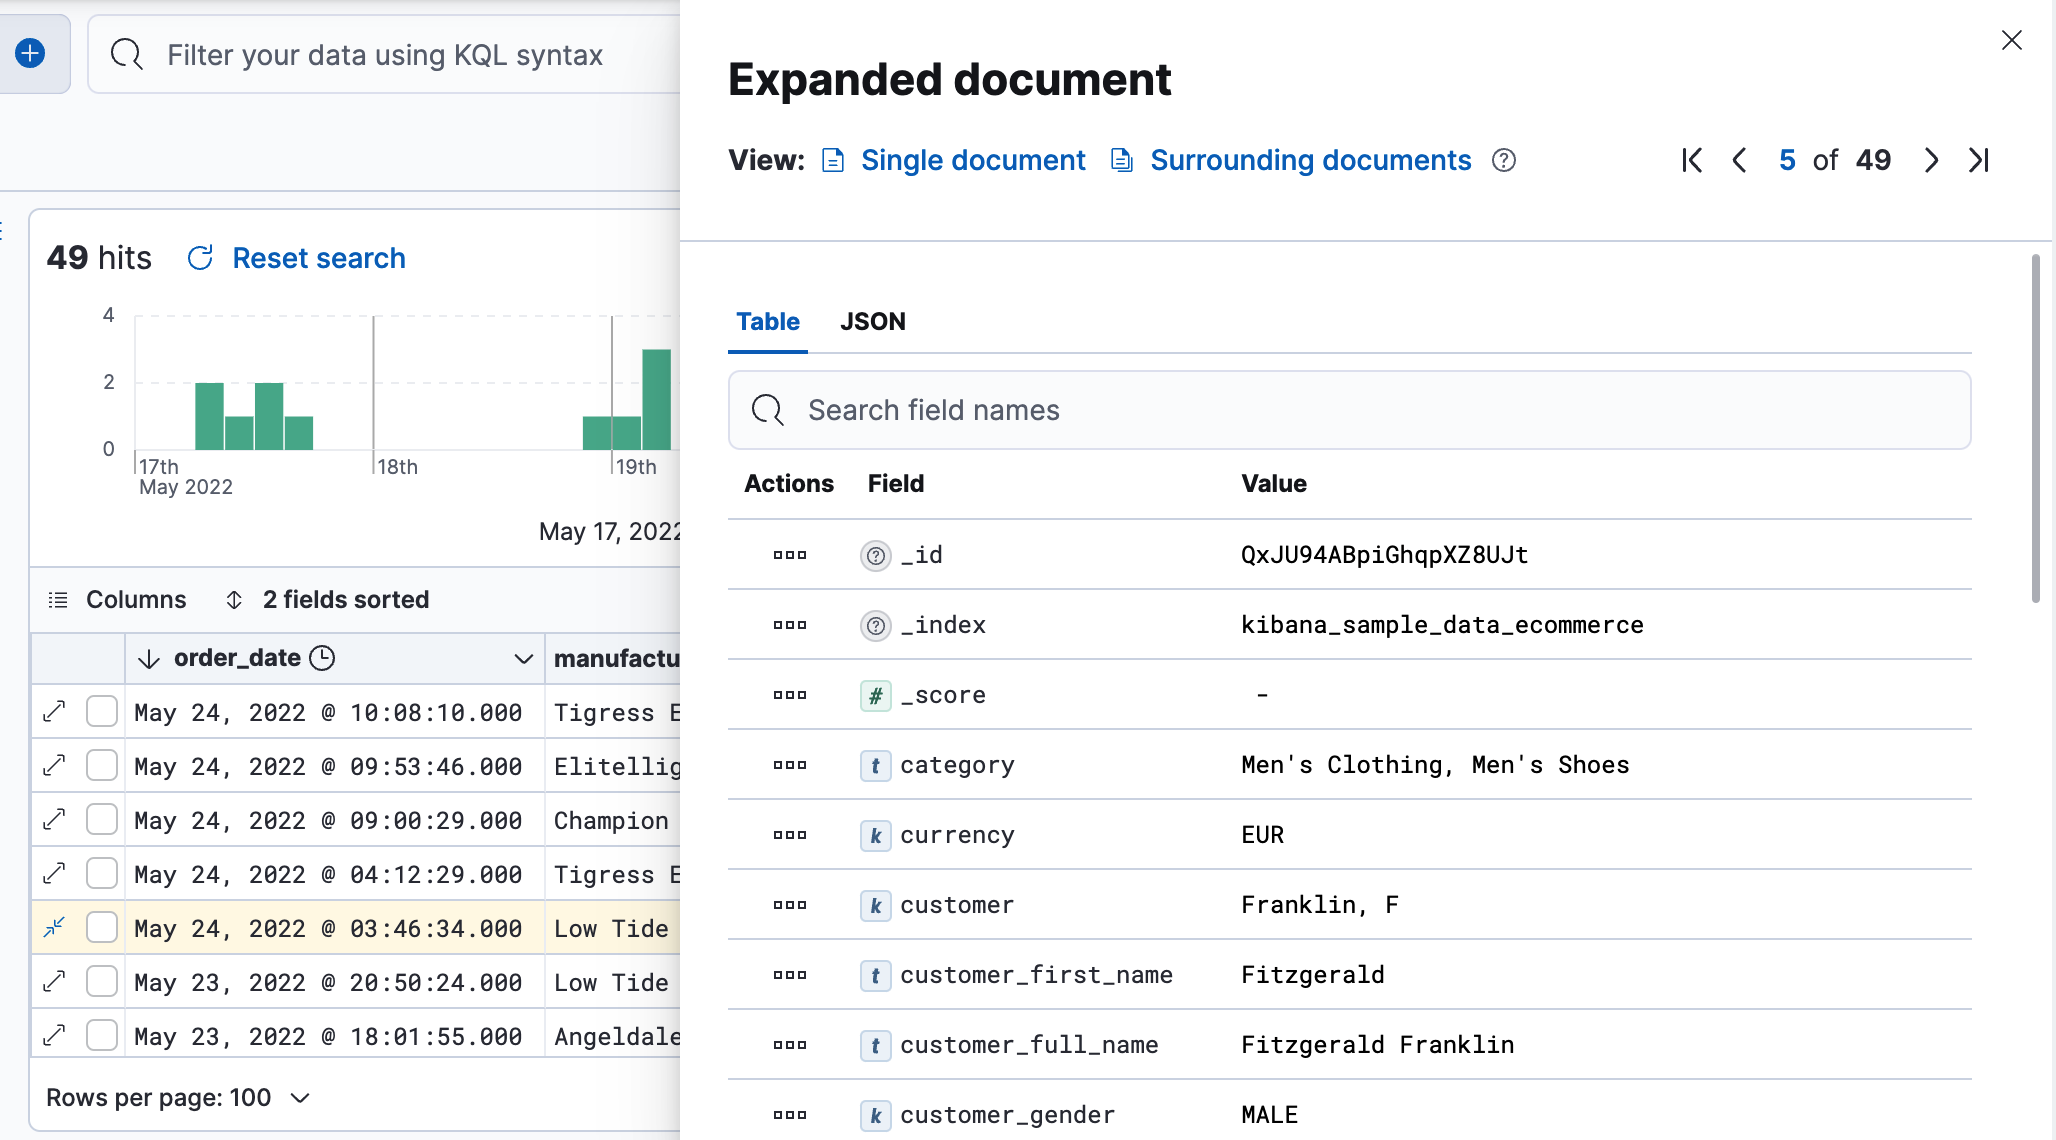
- In the Table view, scan through the fields and their values, or search for a field by name.
-
When you find a field of interest, click
 in the Actions column
to:
in the Actions column
to:- Filter the results to include or exclude specific fields or values.
- Toggle the field in or out the document table.
- Pin the field so it stays at the top.
- To navigate to the next and previous documents, click the < and > arrows at the top of the view.
-
To create a view of the document that you can bookmark and share, click Single document.
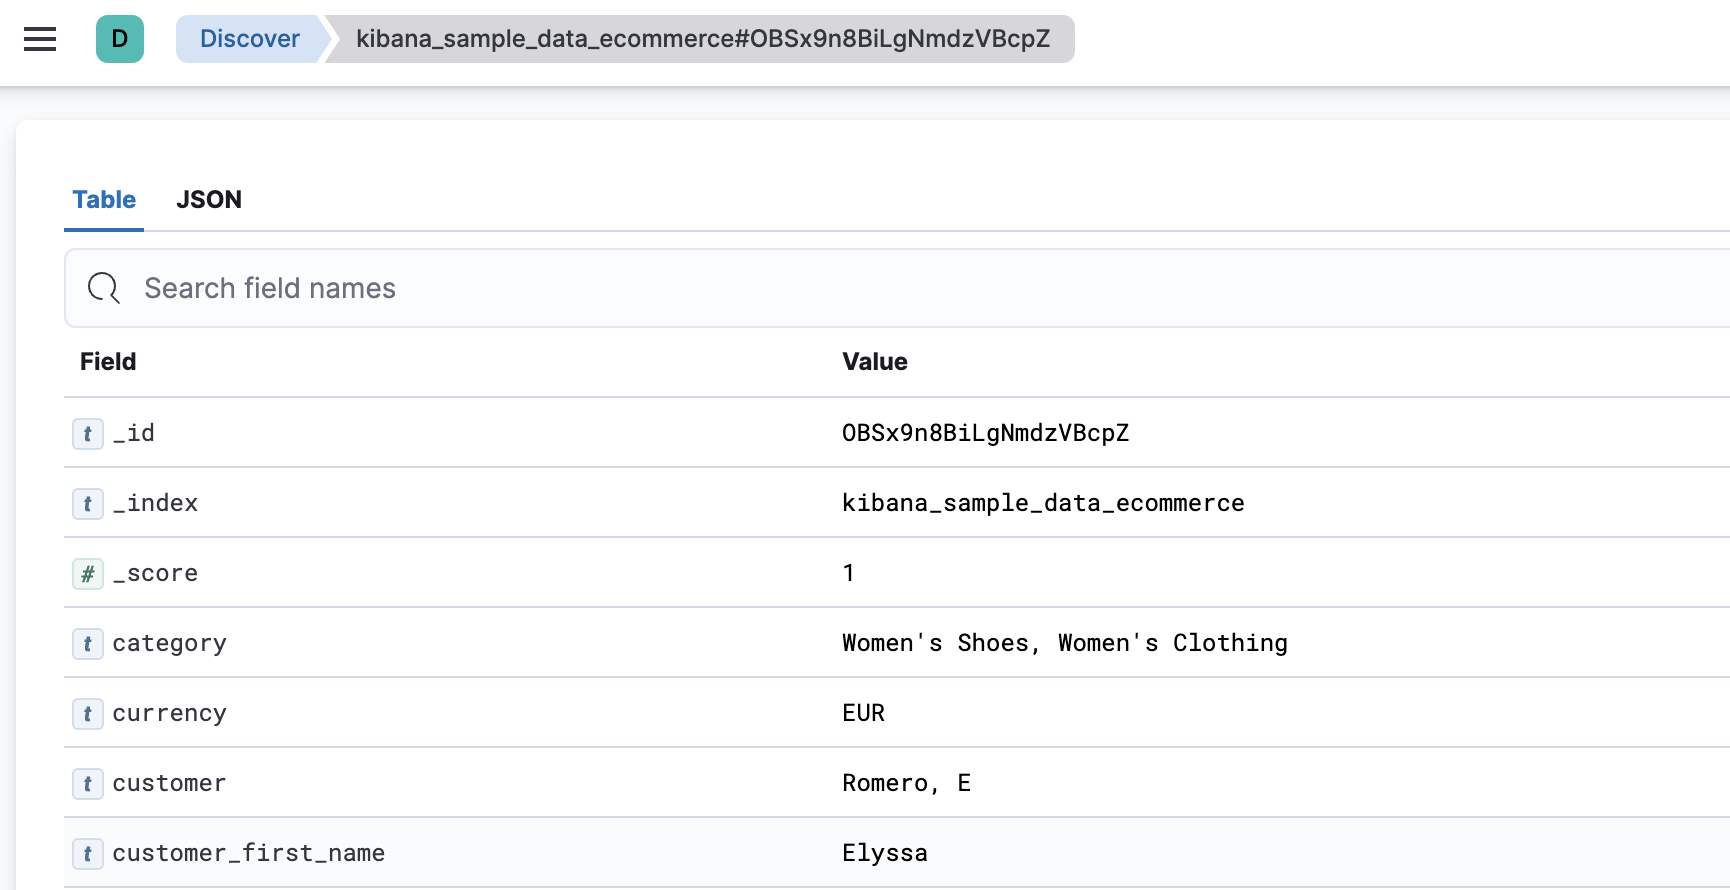
The link is valid for the time the document is available in Elasticsearch. To create a customized view of the document, you can create your own plugin.
-
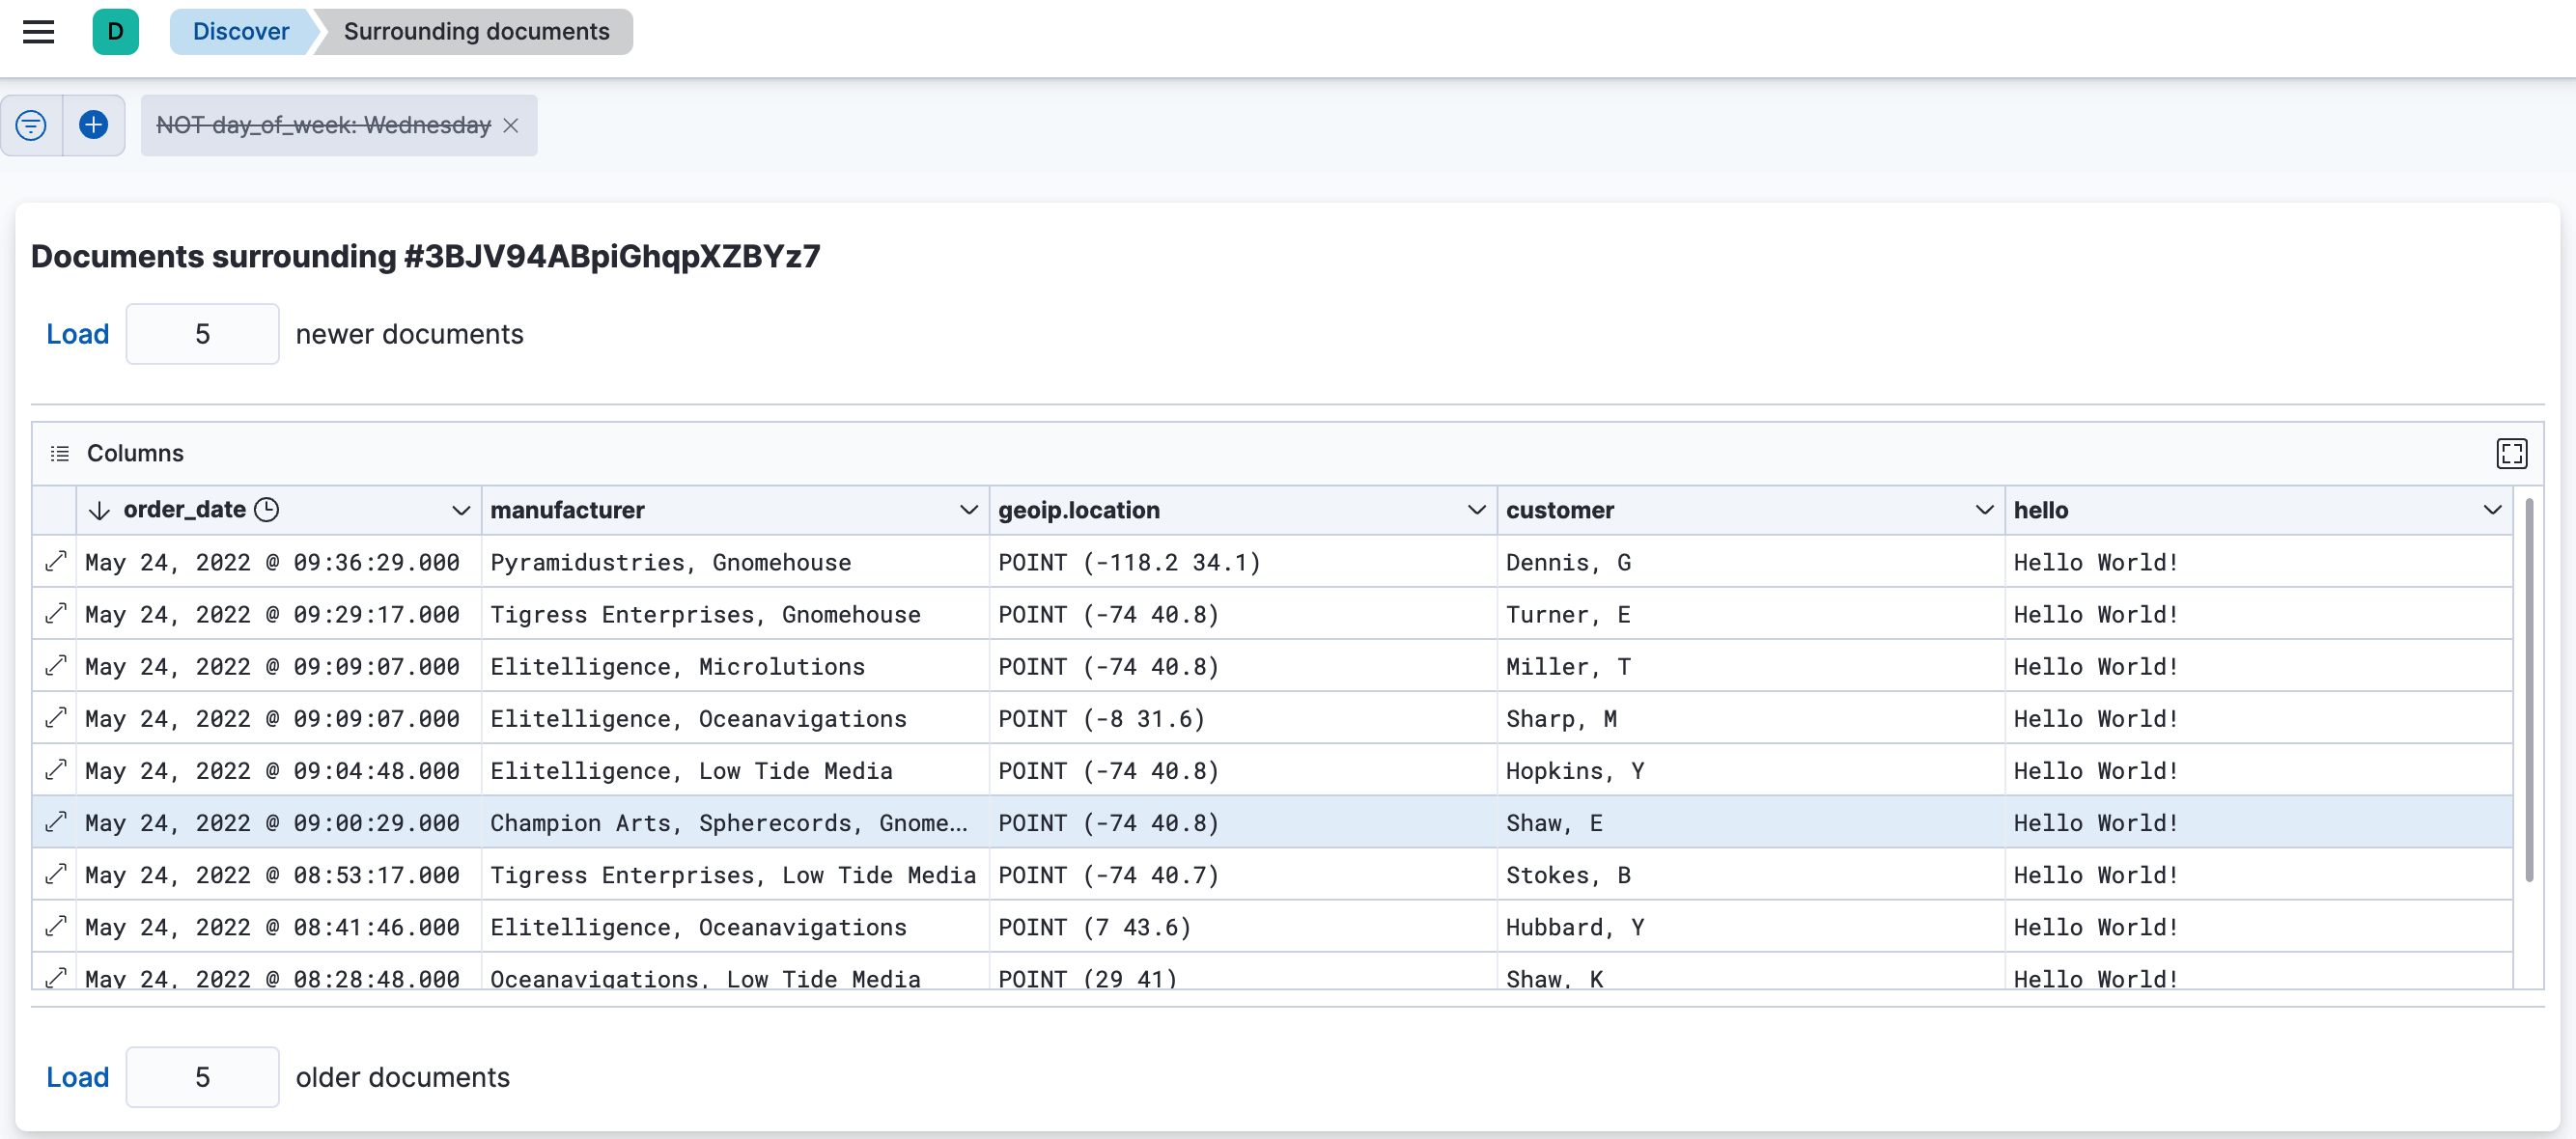
To view documents that occurred before or after the event you are looking at, click Surrounding documents.
Documents are displayed using the same set of columns as the Discover view from which the context was opened. The filters you applied are also carried over. Pinned filters remain active, while other filters are copied in a disabled state.
View documents in fullscreen
editTo view as much data as possible and eliminate distractions, click the fullscreen icon
![]() in the document table.
in the document table.
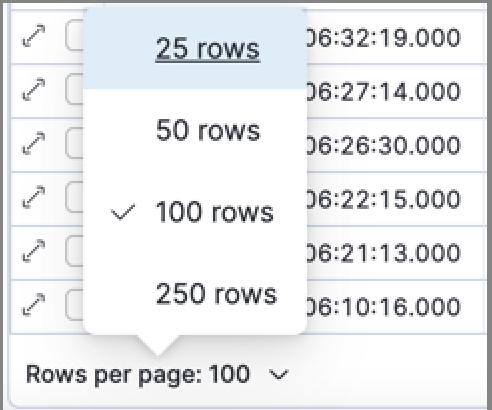
Configure the number of documents displayed
editBy default, the document table displays 100 rows per page. To change this number, click Rows per page.