- Kibana Guide: other versions:
- What is Kibana?
- What’s new in 8.3
- Kibana concepts
- Quick start
- Set up
- Install Kibana
- Configure Kibana
- Alerting and action settings
- APM settings
- Banners settings
- Enterprise Search settings
- Fleet settings
- i18n settings
- Logging settings
- Logs settings
- Metrics settings
- Monitoring settings
- Reporting settings
- Search sessions settings
- Secure settings
- Security settings
- Spaces settings
- Task Manager settings
- Telemetry settings
- URL drilldown settings
- Start and stop Kibana
- Access Kibana
- Securing access to Kibana
- Add data
- Upgrade Kibana
- Configure security
- Configure reporting
- Configure logging
- Configure monitoring
- Command line tools
- Production considerations
- Discover
- Dashboard and visualizations
- Canvas
- Maps
- Build a map to compare metrics by country or region
- Track, visualize, and alert on assets in real time
- Map custom regions with reverse geocoding
- Heat map layer
- Tile layer
- Vector layer
- Plot big data
- Search geographic data
- Configure map settings
- Connect to Elastic Maps Service
- Import geospatial data
- Troubleshoot
- Reporting and sharing
- Machine learning
- Graph
- Alerting
- Observability
- APM
- Security
- Dev Tools
- Fleet
- Osquery
- Stack Monitoring
- Stack Management
- REST API
- Get features API
- Kibana spaces APIs
- Kibana role management APIs
- User session management APIs
- Saved objects APIs
- Data views API
- Index patterns APIs
- Alerting APIs
- Action and connector APIs
- Cases APIs
- Import and export dashboard APIs
- Logstash configuration management APIs
- Machine learning APIs
- Short URLs APIs
- Get Task Manager health
- Upgrade assistant APIs
- Kibana plugins
- Troubleshooting
- Accessibility
- Release notes
- Developer guide
Plot big data without plotting too much data
editPlot big data without plotting too much data
editUse aggregations to plot large data sets without overwhelming your network or your browser. When using aggregations, the documents stay in Elasticsearch and only the calculated values for each group are returned to your computer.
Aggregations group your documents into buckets and calculate metrics for each bucket. Use metric aggregations for data driven styling. For example, use the count aggregation to shade world countries by web log traffic.
You can add the following metric aggregations:
- Average. The mean of the values.
- Count. The number of documents.
- Max. The highest value.
- Min. The lowest value.
- Percentile. The value at which a certain percentage of observed values occur. For example, the 95th percentile is the value which is greater than 95% of the observed values.
- Sum. The total value.
- Top term. The most common value.
- Unique count. The number of distinct values.
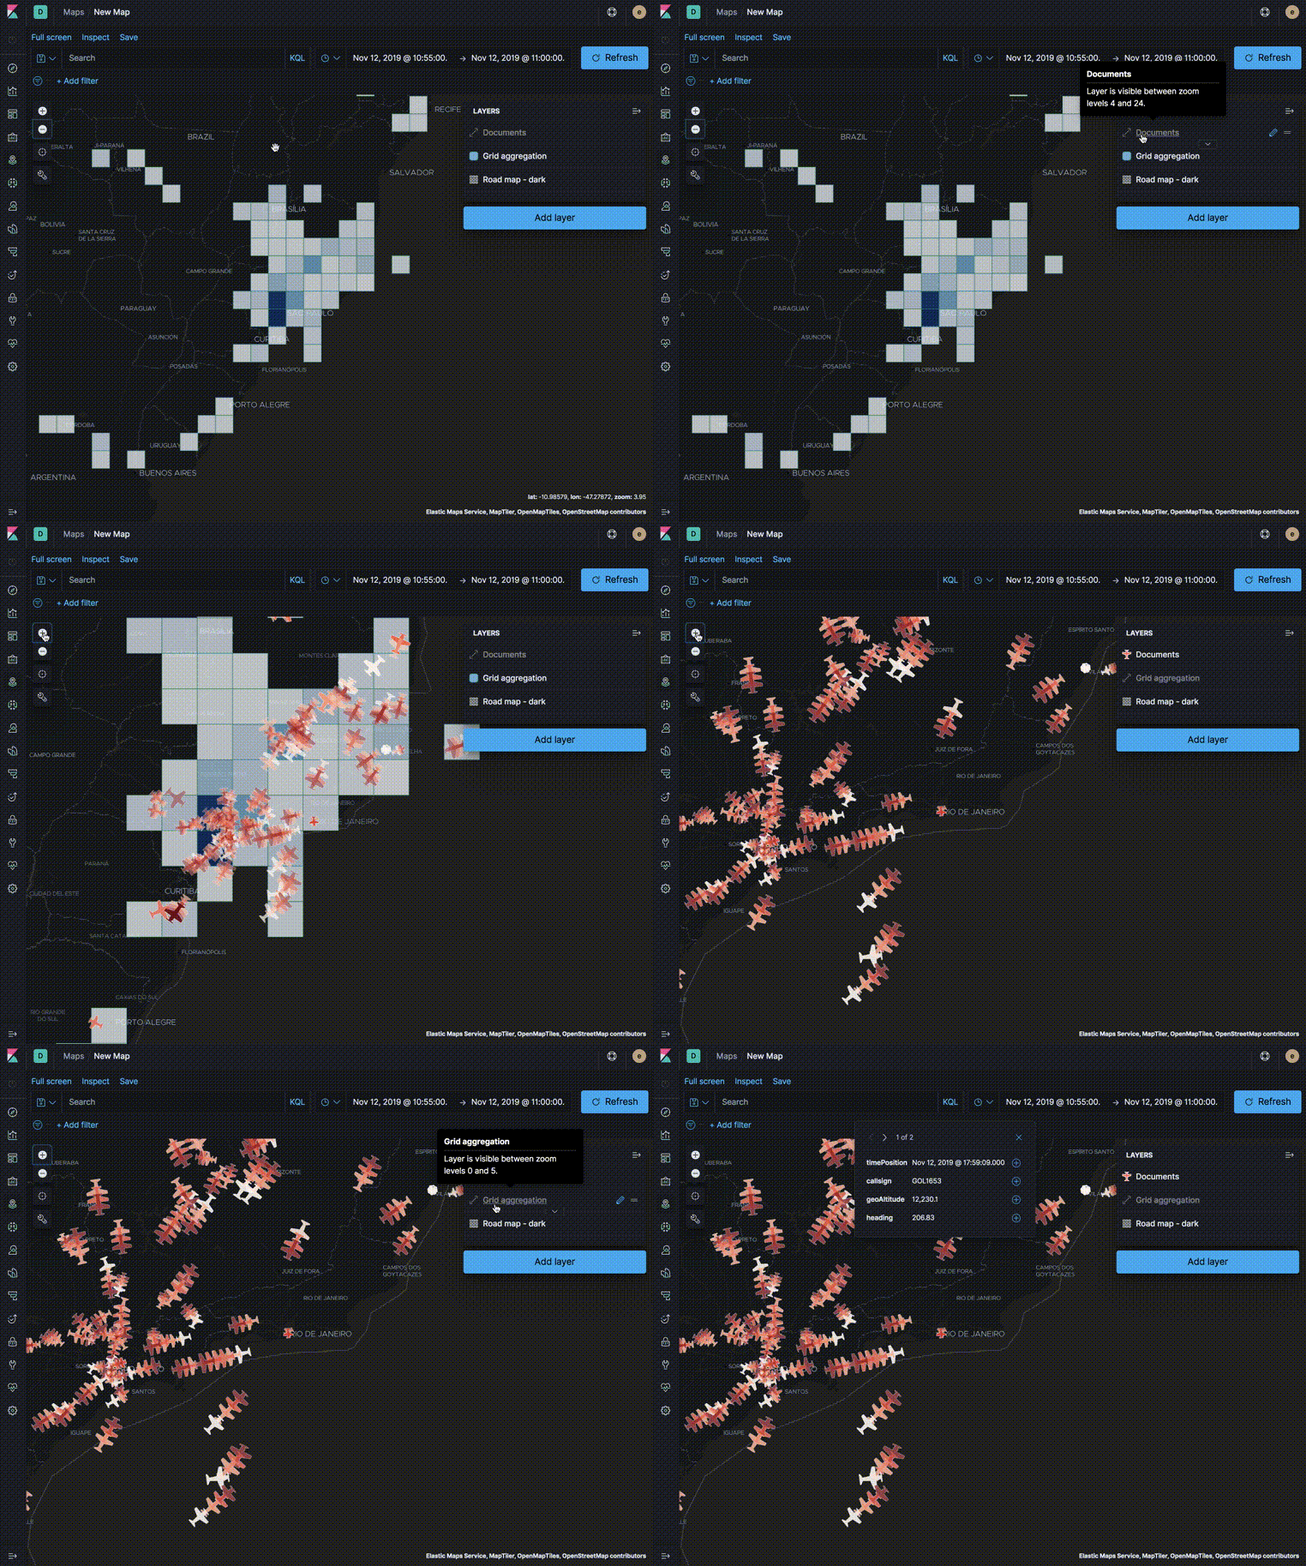
Use aggregated layers with document layers to show aggregated views when the map shows larger amounts of the globe and individual documents when the map shows smaller regions.
In the following example, the Grid aggregation layer is only visible when the map is at zoom levels 0 through 5. The Documents layer is only visible when the map is at zoom levels 4 through 24. See the Getting started tutorial for more details on configuring the layers.