- Kibana Guide: other versions:
- What is Kibana?
- What’s new in 8.3
- Kibana concepts
- Quick start
- Set up
- Install Kibana
- Configure Kibana
- Alerting and action settings
- APM settings
- Banners settings
- Enterprise Search settings
- Fleet settings
- i18n settings
- Logging settings
- Logs settings
- Metrics settings
- Monitoring settings
- Reporting settings
- Search sessions settings
- Secure settings
- Security settings
- Spaces settings
- Task Manager settings
- Telemetry settings
- URL drilldown settings
- Start and stop Kibana
- Access Kibana
- Securing access to Kibana
- Add data
- Upgrade Kibana
- Configure security
- Configure reporting
- Configure logging
- Configure monitoring
- Command line tools
- Production considerations
- Discover
- Dashboard and visualizations
- Canvas
- Maps
- Build a map to compare metrics by country or region
- Track, visualize, and alert on assets in real time
- Map custom regions with reverse geocoding
- Heat map layer
- Tile layer
- Vector layer
- Plot big data
- Search geographic data
- Configure map settings
- Connect to Elastic Maps Service
- Import geospatial data
- Troubleshoot
- Reporting and sharing
- Machine learning
- Graph
- Alerting
- Observability
- APM
- Security
- Dev Tools
- Fleet
- Osquery
- Stack Monitoring
- Stack Management
- REST API
- Get features API
- Kibana spaces APIs
- Kibana role management APIs
- User session management APIs
- Saved objects APIs
- Data views API
- Index patterns APIs
- Alerting APIs
- Action and connector APIs
- Cases APIs
- Import and export dashboard APIs
- Logstash configuration management APIs
- Machine learning APIs
- Short URLs APIs
- Get Task Manager health
- Upgrade assistant APIs
- Kibana plugins
- Troubleshooting
- Accessibility
- Release notes
- Developer guide
Vector tooltips
editVector tooltips
editVector tooltips display attributes for the features at your mouse location. These tooltips give users an in-depth insight into what’s going on in the map.
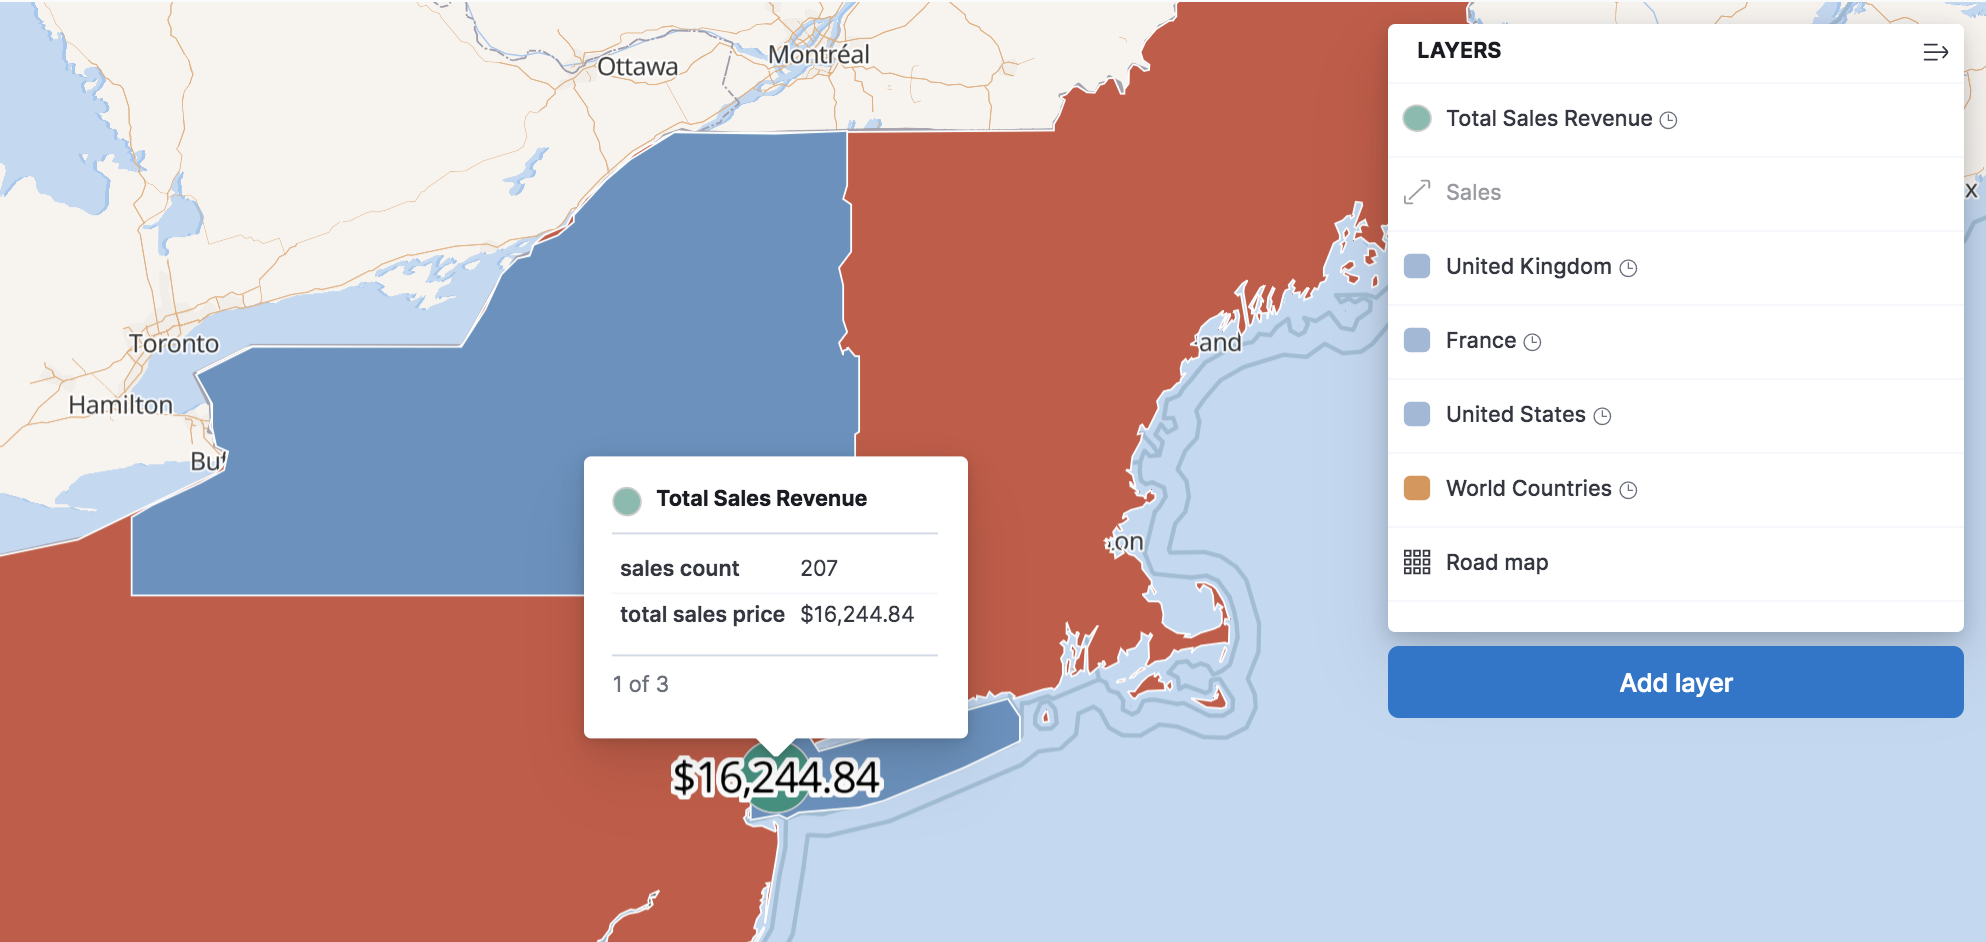
If more than one feature exists at a location, the tooltip displays the attributes for the top feature, and notes the number of features at that location. The following image has a tooltip with three features at the current location: a green circle from the Total Sales Revenue layer, a blue New York State polygon from United States layer, and a red United States Country polygon from the World Countries layer. The tooltip displays attributes for the top feature, the green circle, from the Total Sales Revenue layer.
Format tooltips
editYou can format the attributes in a tooltip by adding field formatters to your data view. You can use field formatters to round numbers, provide units, and even display images in your tooltip.
Lock a tooltip at the current location
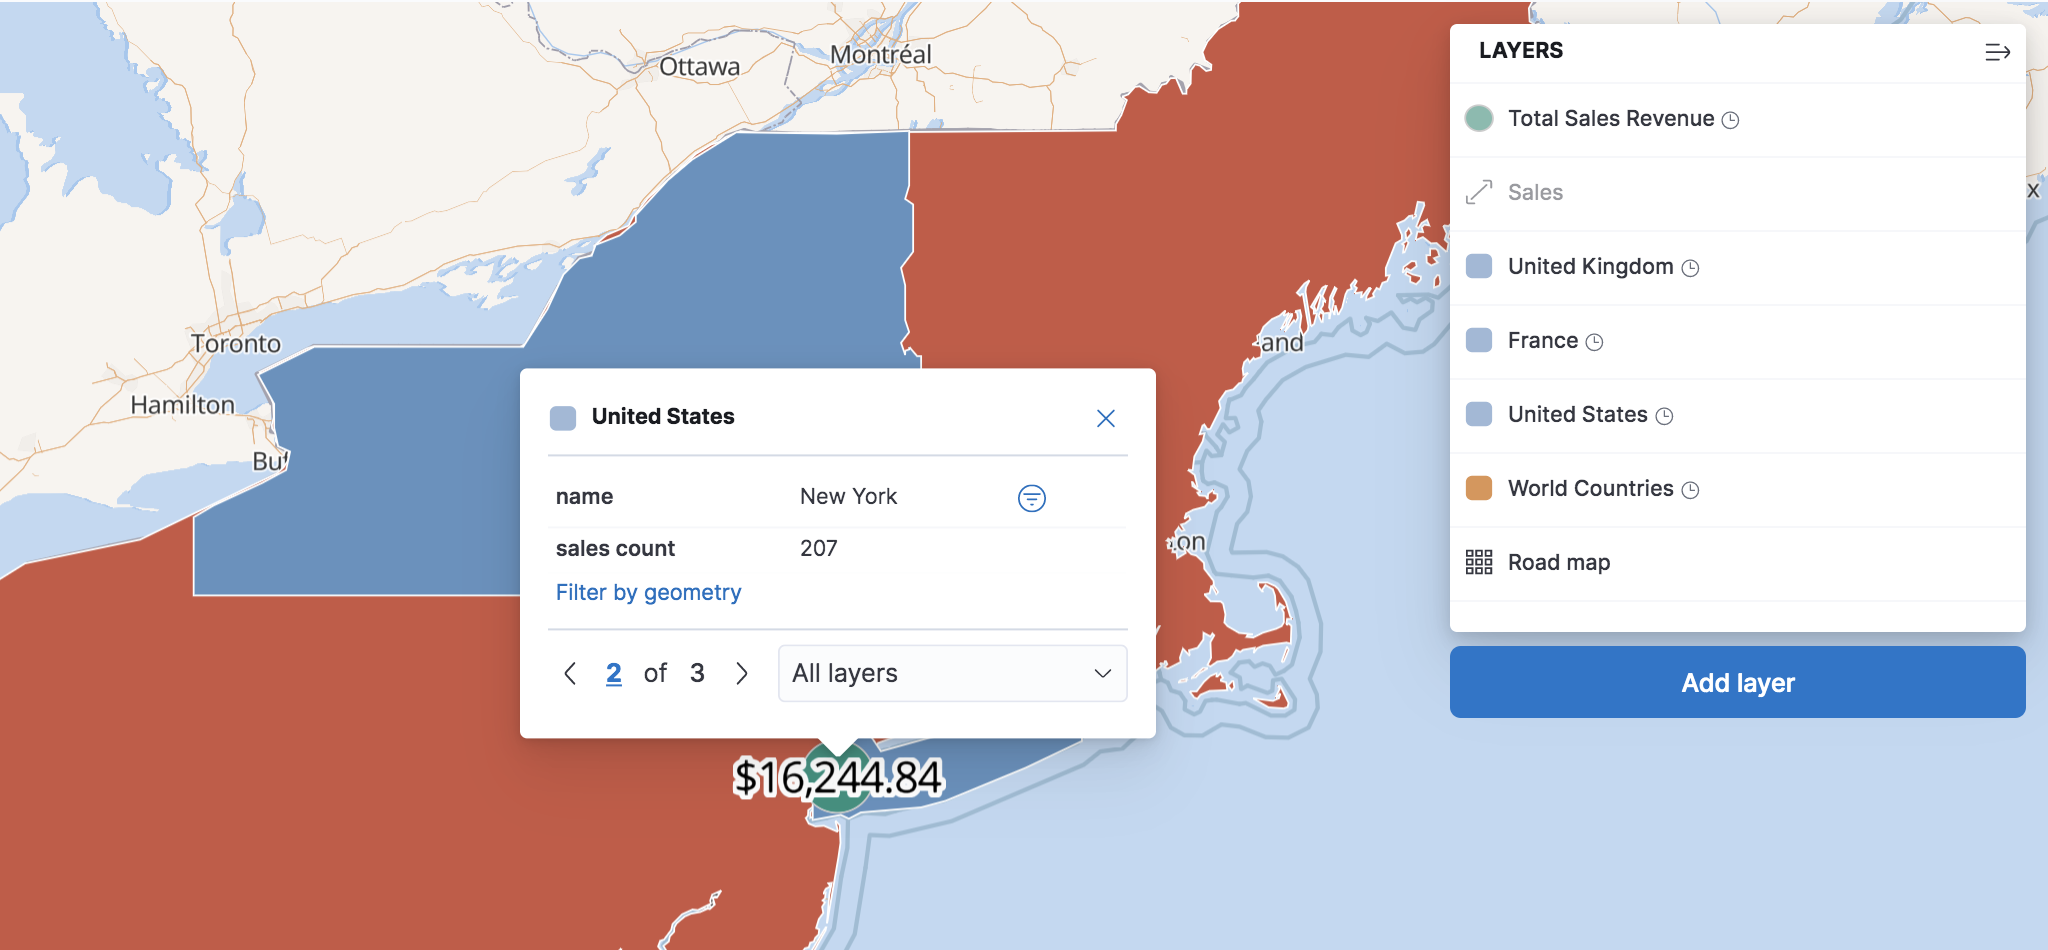
editYou can lock a tooltip in place by clicking a location on the map. With locked tooltips you can:
- Page through features.
- Create a phrase filter from a feature attribute value.
- Create a spatial filter from a feature’s geometry.
This image shows a locked tooltip with features from three layers. The tooltip displays attributes for the second feature, the blue New York State polygon. The tooltip includes controls for paging through the features and a dropdown menu for filtering the features by layer.
