- Kibana Guide: other versions:
- What is Kibana?
- What’s new in 8.3
- Kibana concepts
- Quick start
- Set up
- Install Kibana
- Configure Kibana
- Alerting and action settings
- APM settings
- Banners settings
- Enterprise Search settings
- Fleet settings
- i18n settings
- Logging settings
- Logs settings
- Metrics settings
- Monitoring settings
- Reporting settings
- Search sessions settings
- Secure settings
- Security settings
- Spaces settings
- Task Manager settings
- Telemetry settings
- URL drilldown settings
- Start and stop Kibana
- Access Kibana
- Securing access to Kibana
- Add data
- Upgrade Kibana
- Configure security
- Configure reporting
- Configure logging
- Configure monitoring
- Command line tools
- Production considerations
- Discover
- Dashboard and visualizations
- Canvas
- Maps
- Build a map to compare metrics by country or region
- Track, visualize, and alert on assets in real time
- Map custom regions with reverse geocoding
- Heat map layer
- Tile layer
- Vector layer
- Plot big data
- Search geographic data
- Configure map settings
- Connect to Elastic Maps Service
- Import geospatial data
- Troubleshoot
- Reporting and sharing
- Machine learning
- Graph
- Alerting
- Observability
- APM
- Security
- Dev Tools
- Fleet
- Osquery
- Stack Monitoring
- Stack Management
- REST API
- Get features API
- Kibana spaces APIs
- Kibana role management APIs
- User session management APIs
- Saved objects APIs
- Data views API
- Index patterns APIs
- Alerting APIs
- Action and connector APIs
- Cases APIs
- Import and export dashboard APIs
- Logstash configuration management APIs
- Machine learning APIs
- Short URLs APIs
- Get Task Manager health
- Upgrade assistant APIs
- Kibana plugins
- Troubleshooting
- Accessibility
- Release notes
- Developer guide
Track deployments with annotations
editTrack deployments with annotations
edit
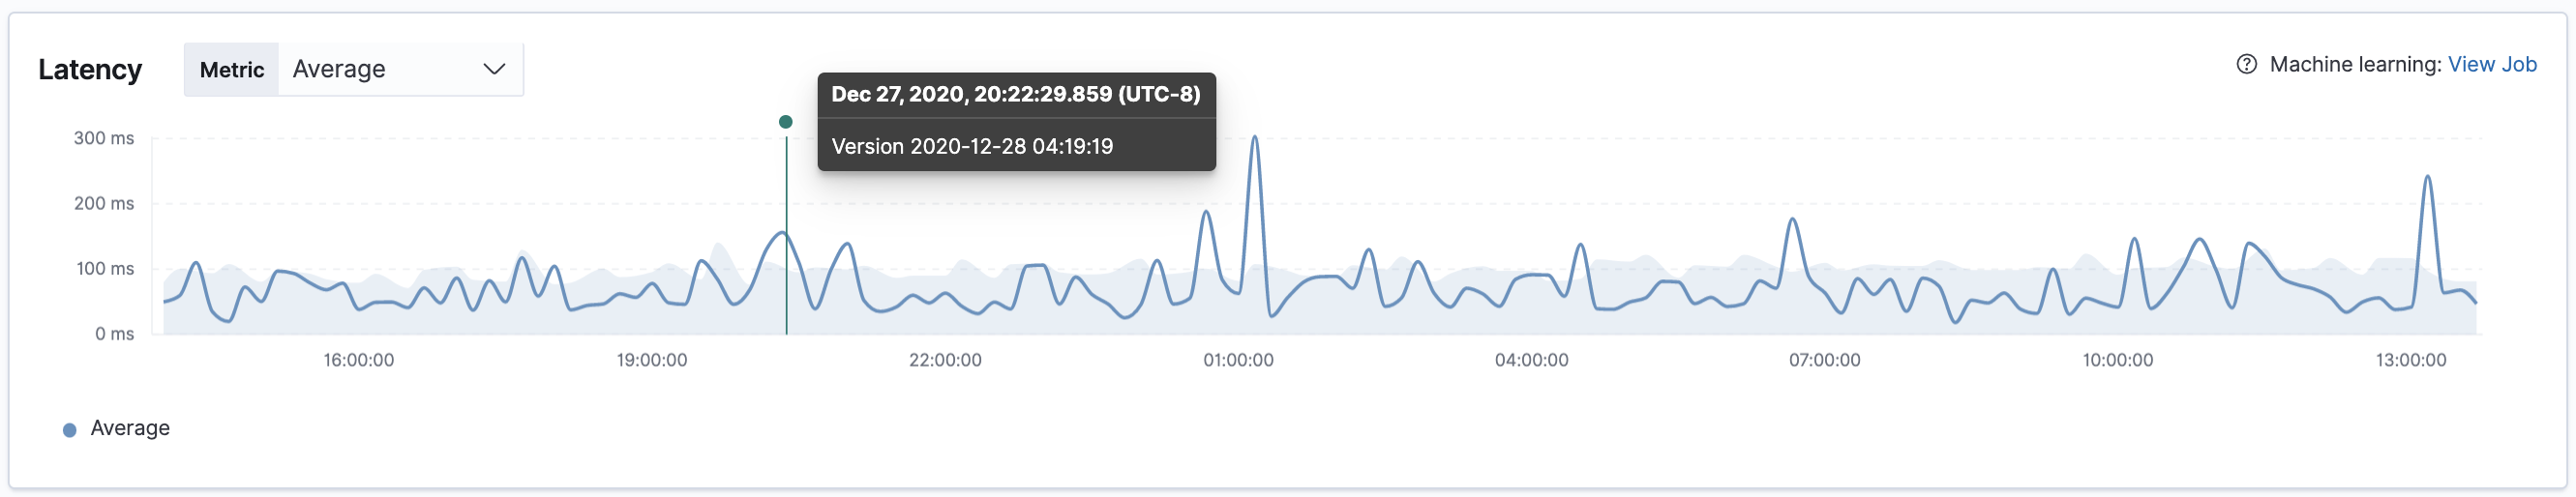
For enhanced visibility into your deployments, we offer deployment annotations on all transaction charts. This feature enables you to easily determine if your deployment has increased response times for an end-user, or if the memory/CPU footprint of your application has changed. Being able to quickly identify bad deployments enables you to rollback and fix issues without causing costly outages.
By default, automatic deployment annotations are enabled.
This means the APM app will create an annotation on your data when the service.version
of your application changes.
Alternatively, you can explicitly create deployment annotations with our annotation API. The API can integrate into your CI/CD pipeline, so that each time you deploy, a POST request is sent to the annotation API endpoint:
curl -X POST \ http://localhost:5601/api/apm/services/${SERVICE_NAME}/annotation \ -H 'Content-Type: application/json' \ -H 'kbn-xsrf: true' \ -H 'Authorization: Basic ${API_KEY}' \ -d '{ "@timestamp": "${DEPLOY_TIME}", "service": { "version": "${SERVICE_VERSION}" }, "message": "${MESSAGE}" }'
The |
|
An APM app API key with sufficient privileges |
|
The time of the deployment |
|
The |
|
A custom message to be displayed in the annotation |
See the annotation API reference for more information.
If custom annotations have been created for the selected time period, any derived annotations, i.e., those created automatically when service.version
changes, will not be shown.