- Kibana Guide: other versions:
- What is Kibana?
- What’s new in 8.3
- Kibana concepts
- Quick start
- Set up
- Install Kibana
- Configure Kibana
- Alerting and action settings
- APM settings
- Banners settings
- Enterprise Search settings
- Fleet settings
- i18n settings
- Logging settings
- Logs settings
- Metrics settings
- Monitoring settings
- Reporting settings
- Search sessions settings
- Secure settings
- Security settings
- Spaces settings
- Task Manager settings
- Telemetry settings
- URL drilldown settings
- Start and stop Kibana
- Access Kibana
- Securing access to Kibana
- Add data
- Upgrade Kibana
- Configure security
- Configure reporting
- Configure logging
- Configure monitoring
- Command line tools
- Production considerations
- Discover
- Dashboard and visualizations
- Canvas
- Maps
- Build a map to compare metrics by country or region
- Track, visualize, and alert on assets in real time
- Map custom regions with reverse geocoding
- Heat map layer
- Tile layer
- Vector layer
- Plot big data
- Search geographic data
- Configure map settings
- Connect to Elastic Maps Service
- Import geospatial data
- Troubleshoot
- Reporting and sharing
- Machine learning
- Graph
- Alerting
- Observability
- APM
- Security
- Dev Tools
- Fleet
- Osquery
- Stack Monitoring
- Stack Management
- REST API
- Get features API
- Kibana spaces APIs
- Kibana role management APIs
- User session management APIs
- Saved objects APIs
- Data views API
- Index patterns APIs
- Alerting APIs
- Action and connector APIs
- Cases APIs
- Import and export dashboard APIs
- Logstash configuration management APIs
- Machine learning APIs
- Short URLs APIs
- Get Task Manager health
- Upgrade assistant APIs
- Kibana plugins
- Troubleshooting
- Accessibility
- Release notes
- Developer guide
IMPORTANT: No additional bug fixes or documentation updates
will be released for this version. For the latest information, see the
current release documentation.
Display the most relevant documents per entity
editDisplay the most relevant documents per entity
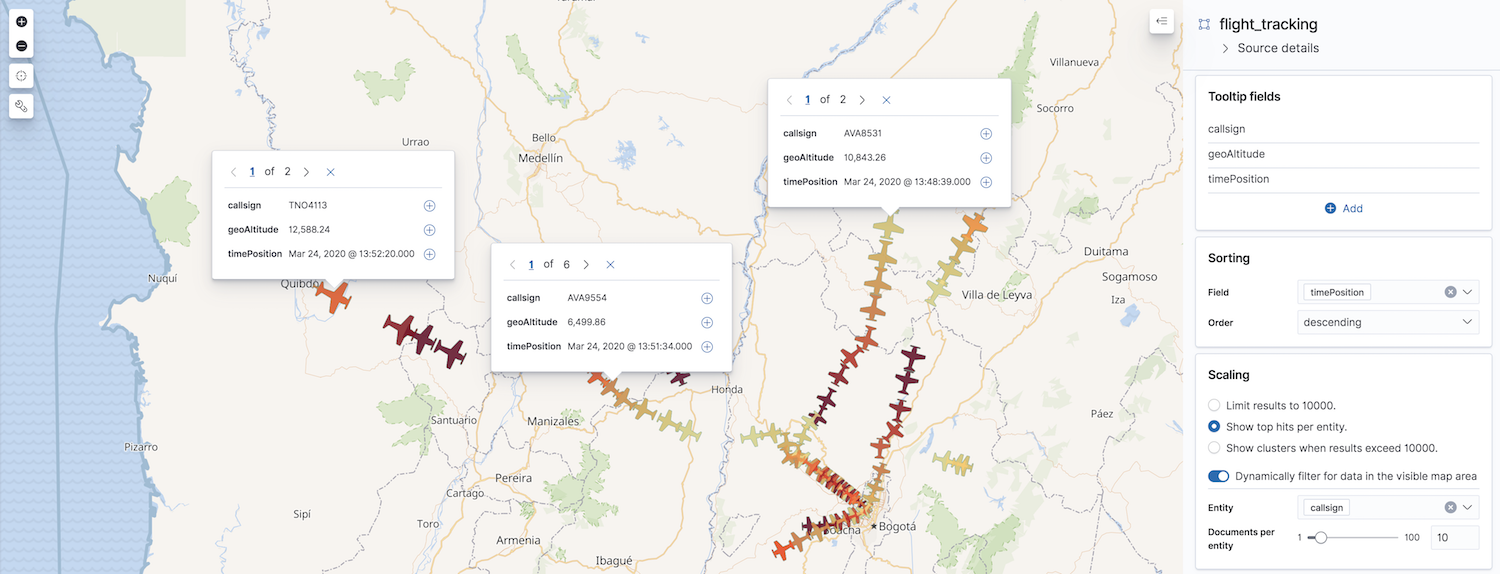
editUse Top hits per entity to display the most relevant documents per entity, for example, the most recent GPS tracks per flight route. To get this data, Elasticsearch first groups your data using a terms aggregation, then accumulates the most relevant documents based on sort order for each entry using a top hits metric aggregation.
To enable top hits:
- Click Add layer, then select the Top hits per entity layer.
- Configure Data view and Geospatial field.
- Set Entity to the field that identifies entities in your documents. This field will be used in the terms aggregation to group your documents into entity buckets.
-
Set Documents per entity to configure the maximum number of documents accumulated per entity.
This setting is limited to the
index.max_inner_result_window
index setting, which defaults to 100.
Was this helpful?
Thank you for your feedback.