IMPORTANT: No additional bug fixes or documentation updates
will be released for this version. For the latest information, see the
current release documentation.
Vector layer
edit
IMPORTANT: This documentation is no longer updated. Refer to Elastic's version policy and the latest documentation.
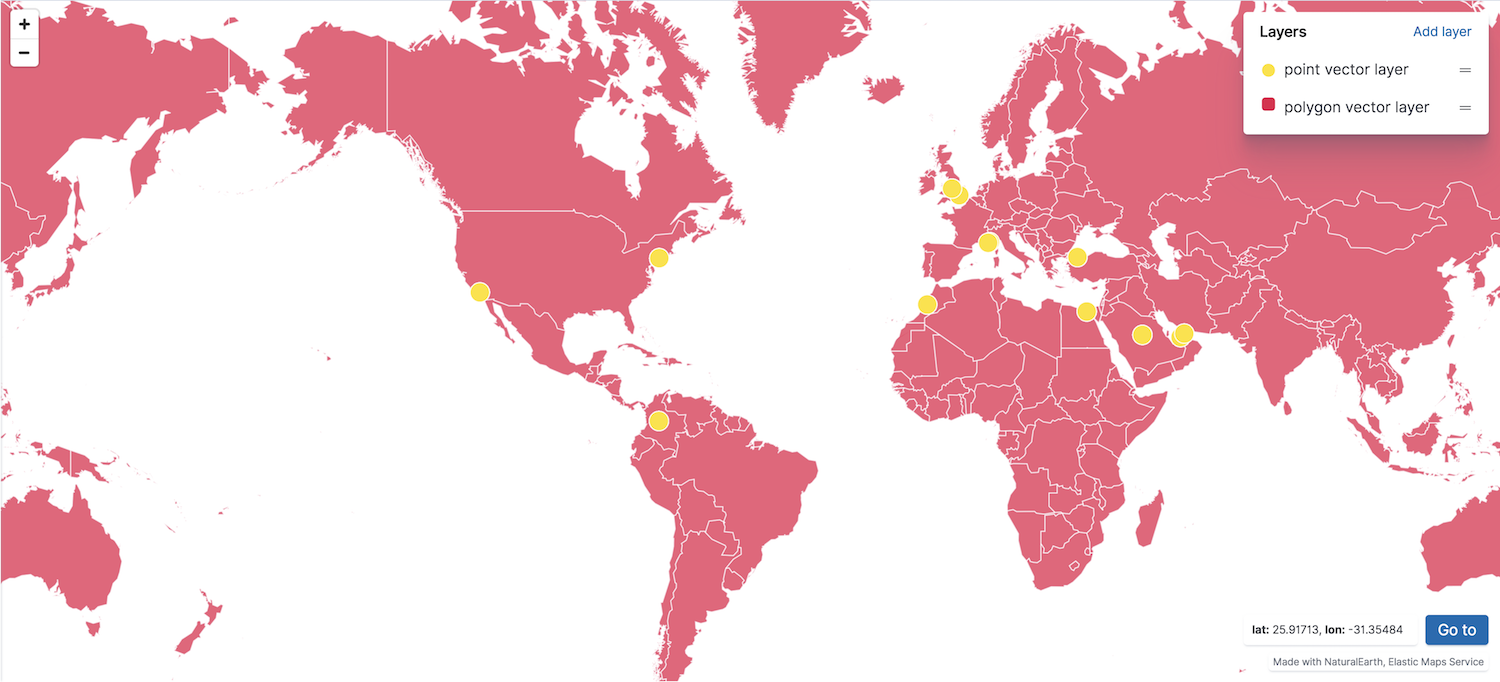
Vector layer
editThe vector layer displays points, lines, and polygons.
You can create a vector layer from the following sources:
- Configured GeoJSON
- Vector data from hosted GeoJSON configured in kibana.yml. See map.regionmap.* in Configuring Kibana for details.
- Documents
- Vector data from a Kibana index pattern. The index must contain at least one field mapped as geo_point or geo_shape.
Document results are limited to the first 10000 matching documents. Use aggregations to plot large data sets.
- Grid aggregation
- Geospatial data grouped in grids with metrics for each gridded cell. Set Show as to grid rectangles or points. The index must contain at least one field mapped as geo_point.
- EMS Boundaries
- Administrative boundaries from Elastic Maps Service.
- Point to point
- Aggregated data paths between the source and destination. The index must contain at least 2 fields mapped as geo_point, source and destination.