IMPORTANT: No additional bug fixes or documentation updates
will be released for this version. For the latest information, see the
current release documentation.
Data frame analytics
edit
IMPORTANT: This documentation is no longer updated. Refer to Elastic's version policy and the latest documentation.
Data frame analytics
editThis functionality is in technical preview and may be changed or removed in a future release. Elastic will work to fix any issues, but features in technical preview are not subject to the support SLA of official GA features.
The Elastic machine learning data frame analytics feature enables you to analyze your data using classification, outlier detection, and regression algorithms and generate new indices that contain the results alongside your source data.
If you have a license that includes the machine learning features, you can create data frame analytics jobs and view their results on the Analytics page in Kibana. For example:
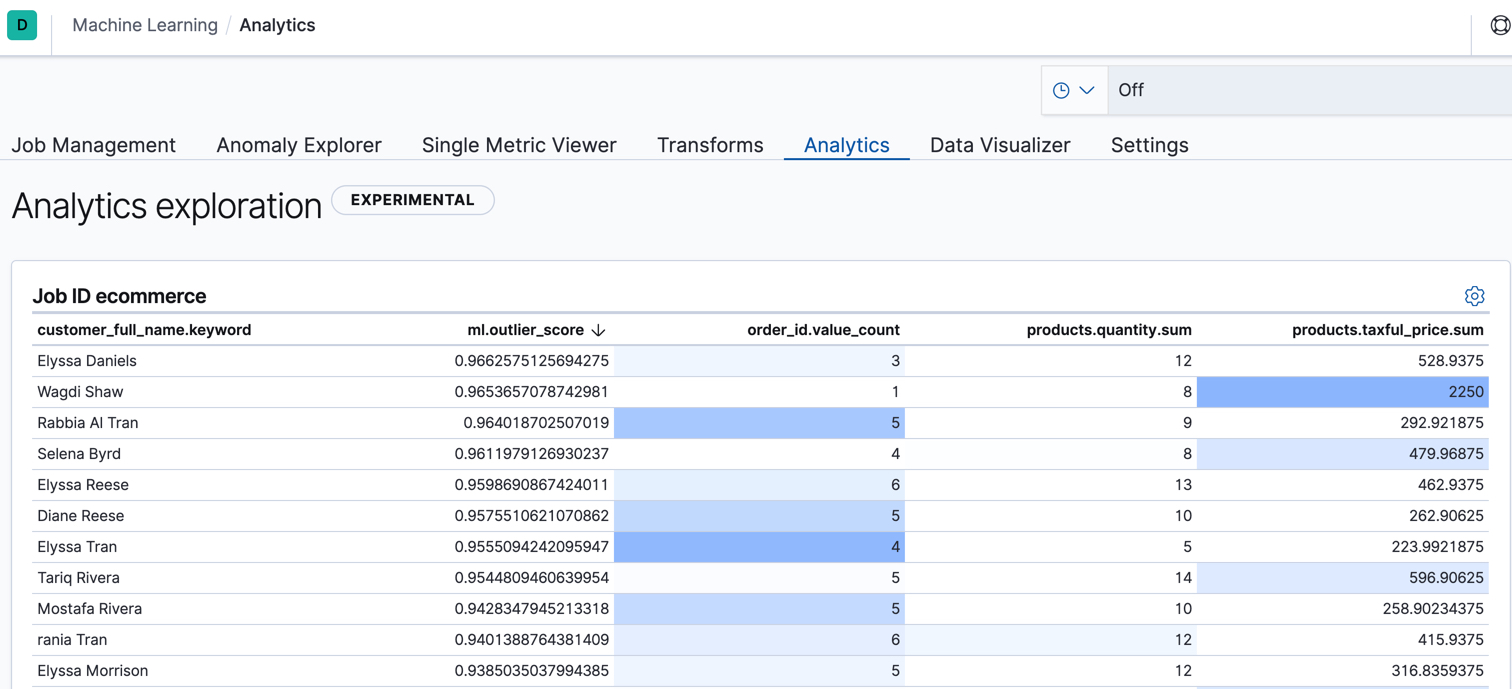
For more information about the data frame analytics feature, see Machine learning data frame analytics.