IMPORTANT: No additional bug fixes or documentation updates
will be released for this version. For the latest information, see the
current release documentation.
Profiling queries and aggregations
edit
IMPORTANT: This documentation is no longer updated. Refer to Elastic's version policy and the latest documentation.
Profiling queries and aggregations
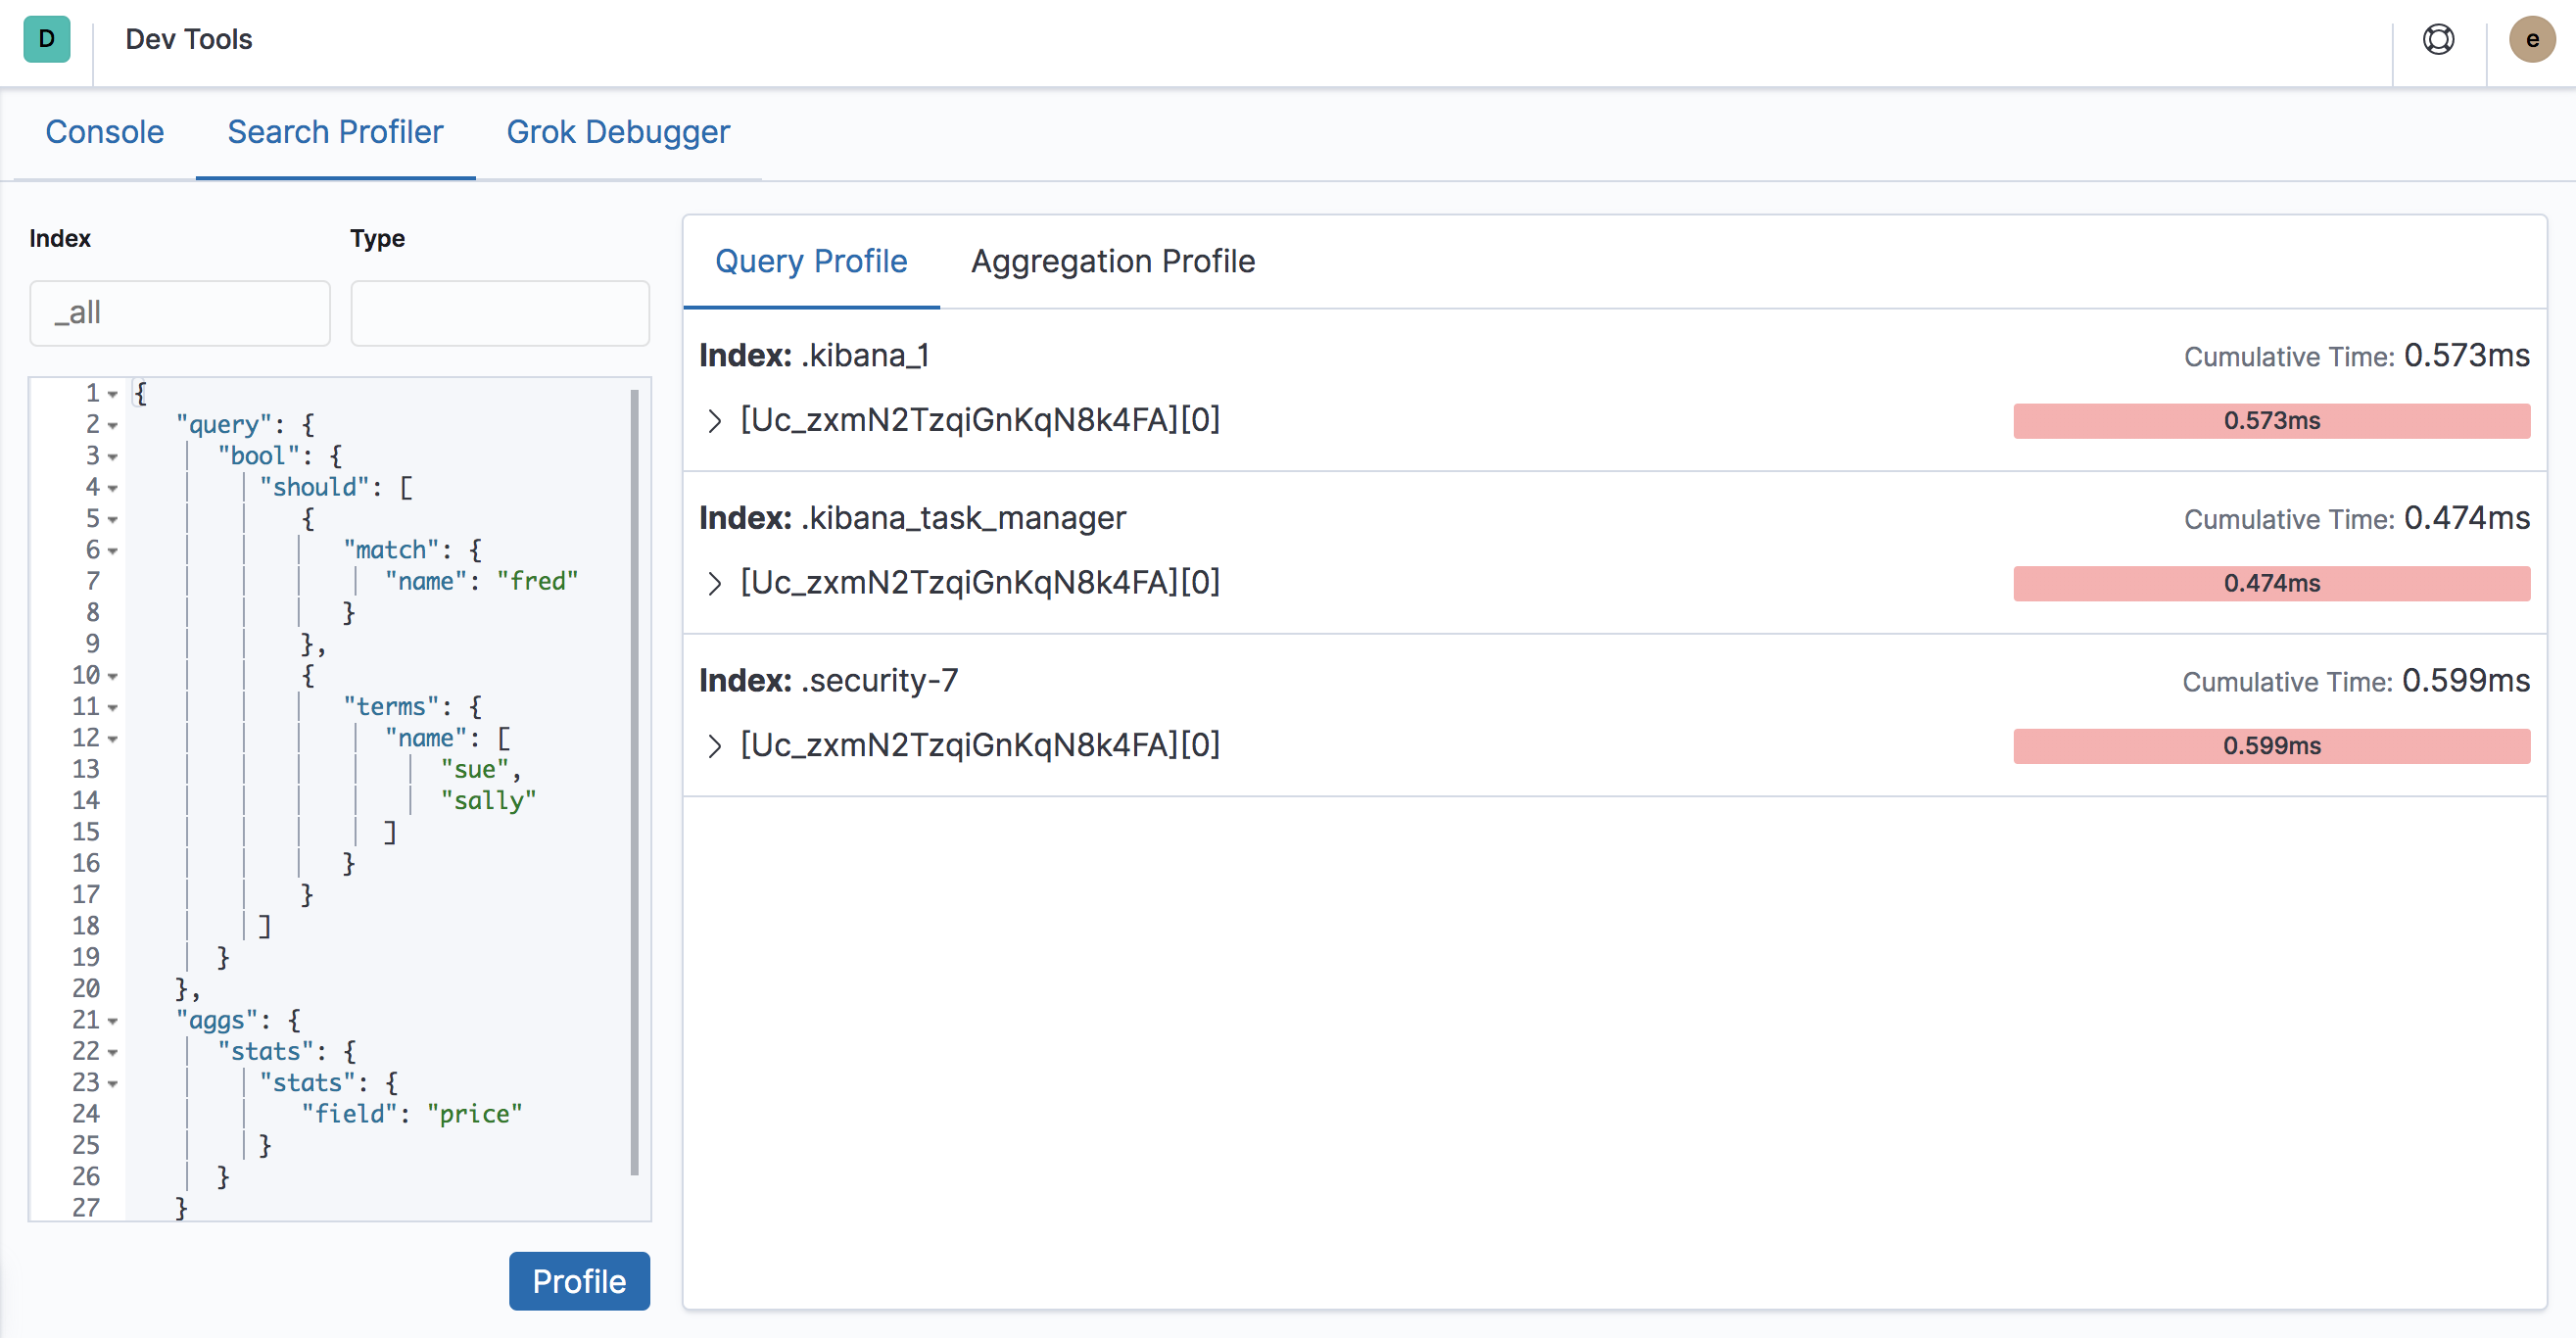
editElasticsearch has a powerful Profile API which can be used to inspect and analyze your search queries. The response returns a large JSON blob, which can be difficult to analyze manually.
The Search Profiler tool can transform this JSON output into a visualization that is easy to navigate, allowing you to diagnose and debug poorly performing queries much faster.