IMPORTANT: No additional bug fixes or documentation updates
will be released for this version. For the latest information, see the
current release documentation.
Metrics overview
edit
IMPORTANT: This documentation is no longer updated. Refer to Elastic's version policy and the latest documentation.
Metrics overview
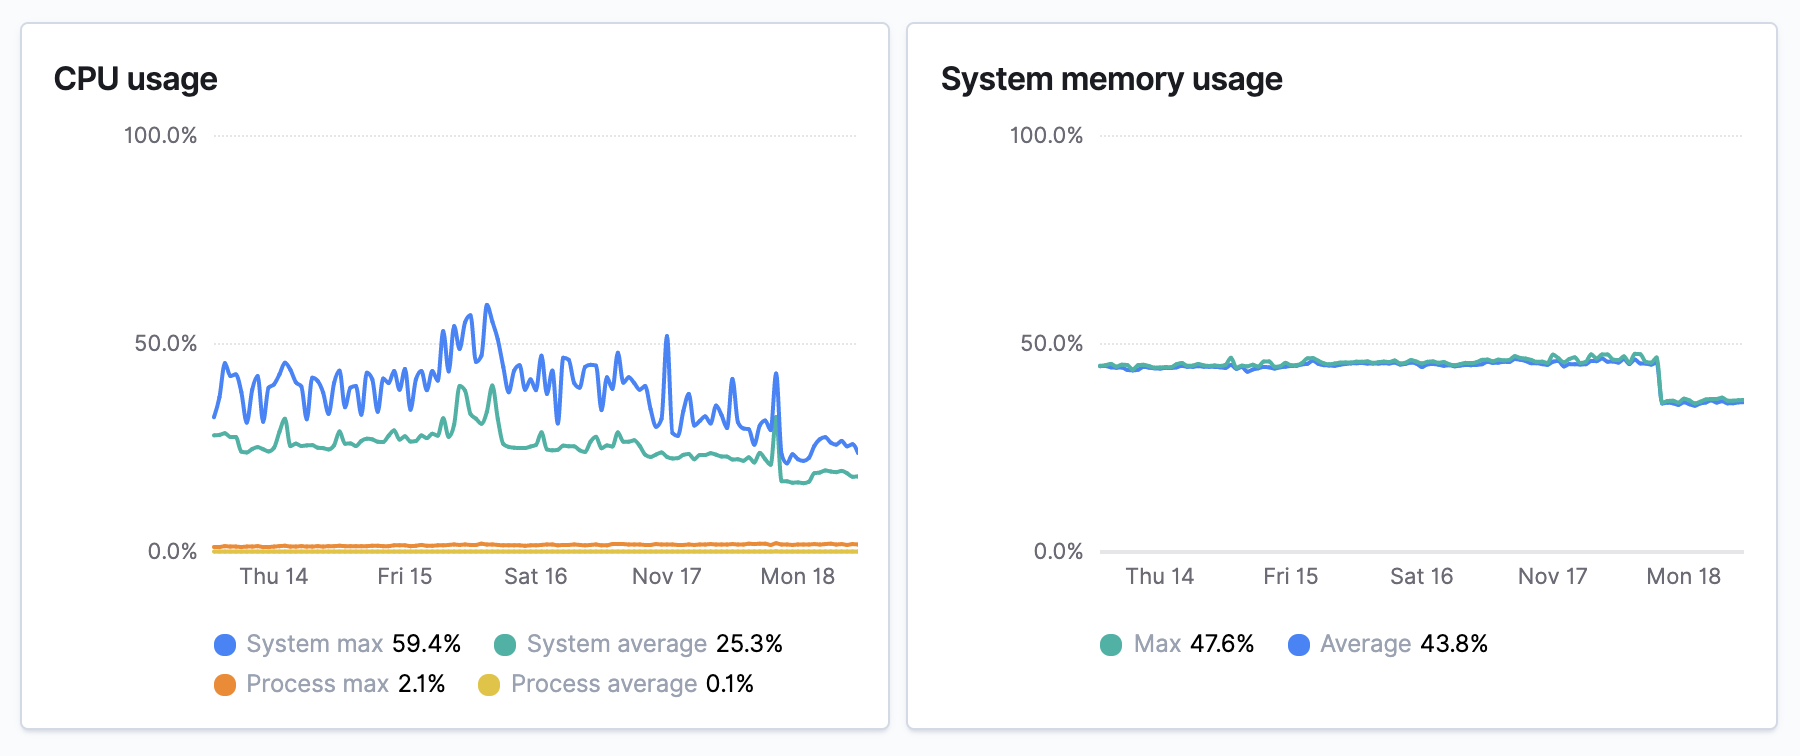
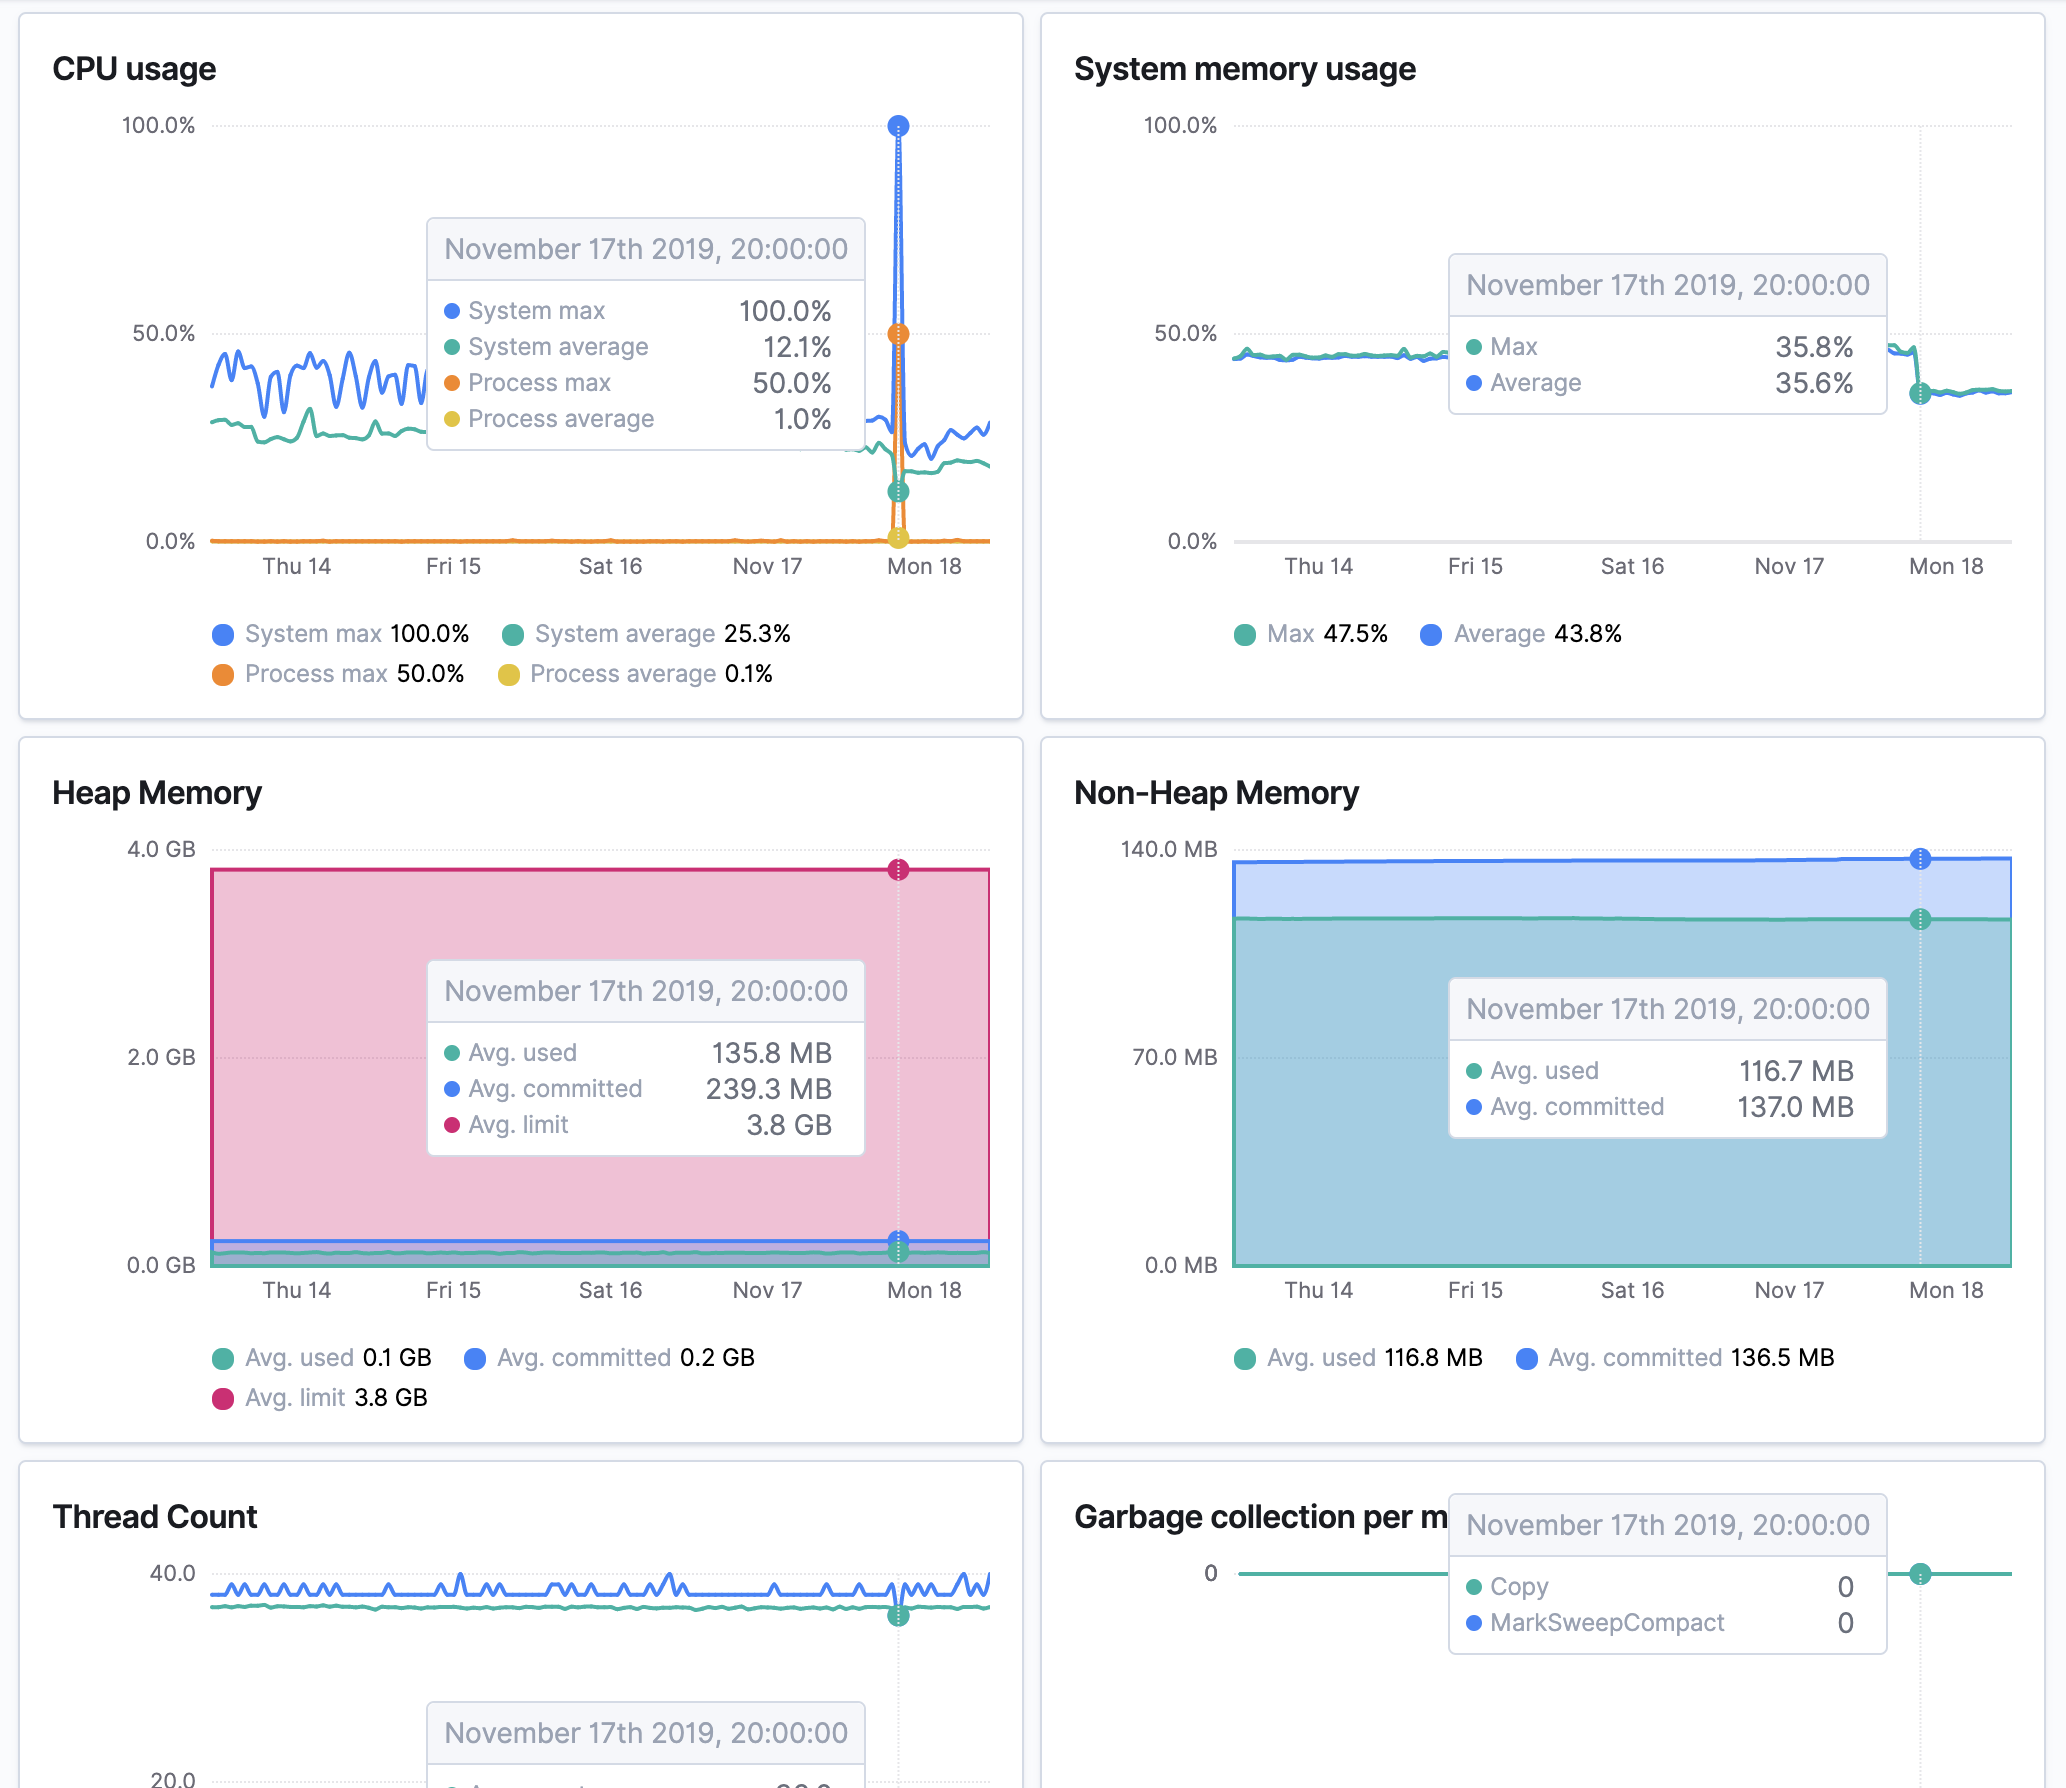
editThe Metrics overview provides agent-specific metrics, which lets you perform more in-depth root cause analysis investigations within the APM app.
If you’re experiencing a problem with your service, you can use this page to attempt to find the underlying cause. For example, you might be able to correlate a high number of errors with a long transaction duration, high CPU usage, or a memory leak.

If you’re using the Java Agent, the metrics view focuses on JVMs. A detailed view of metrics per JVM makes it much easier to analyze the provided metrics: CPU usage, memory usage, heap or non-heap memory, thread count, garbage collection rate, and garbage collection time spent per minute.
