- Elastic Security: other versions:
- Elastic Security overview
- What’s new in 9.0
- Upgrade Elastic Security to 9.0.0-beta1
- Post-upgrade steps (optional)
- Get started with Elastic Security
- AI for Security
- Detections and alerts
- Detections requirements
- Using logsdb index mode with Elastic Security
- About detection rules
- Create a detection rule
- Install and manage Elastic prebuilt rules
- Manage detection rules
- Monitor and troubleshoot rule executions
- Rule exceptions
- About building block rules
- MITRE ATT&CK® coverage
- Manage detection alerts
- Reduce notifications and alerts
- Query alert indices
- Tune detection rules
- Prebuilt rule reference
- A scheduled task was created
- A scheduled task was updated
- AWS Access Secret in Secrets Manager
- AWS CloudTrail Log Created
- AWS CloudTrail Log Deleted
- AWS CloudTrail Log Suspended
- AWS CloudTrail Log Updated
- AWS CloudWatch Alarm Deletion
- AWS CloudWatch Log Group Deletion
- AWS CloudWatch Log Stream Deletion
- AWS Config Resource Deletion
- AWS Configuration Recorder Stopped
- AWS Deletion of RDS Instance or Cluster
- AWS EC2 Encryption Disabled
- AWS EC2 Full Network Packet Capture Detected
- AWS EC2 Network Access Control List Creation
- AWS EC2 Network Access Control List Deletion
- AWS EC2 Snapshot Activity
- AWS EC2 VM Export Failure
- AWS EFS File System or Mount Deleted
- AWS ElastiCache Security Group Created
- AWS ElastiCache Security Group Modified or Deleted
- AWS EventBridge Rule Disabled or Deleted
- AWS Execution via System Manager
- AWS GuardDuty Detector Deletion
- AWS IAM Assume Role Policy Update
- AWS IAM Brute Force of Assume Role Policy
- AWS IAM Deactivation of MFA Device
- AWS IAM Group Creation
- AWS IAM Group Deletion
- AWS IAM Password Recovery Requested
- AWS IAM User Addition to Group
- AWS KMS Customer Managed Key Disabled or Scheduled for Deletion
- AWS Management Console Brute Force of Root User Identity
- AWS Management Console Root Login
- AWS RDS Cluster Creation
- AWS RDS Instance Creation
- AWS RDS Instance/Cluster Stoppage
- AWS RDS Security Group Creation
- AWS RDS Security Group Deletion
- AWS RDS Snapshot Export
- AWS RDS Snapshot Restored
- AWS Redshift Cluster Creation
- AWS Root Login Without MFA
- AWS Route 53 Domain Transfer Lock Disabled
- AWS Route 53 Domain Transferred to Another Account
- AWS Route Table Created
- AWS Route Table Modified or Deleted
- AWS Route53 private hosted zone associated with a VPC
- AWS S3 Bucket Configuration Deletion
- AWS SAML Activity
- AWS STS GetSessionToken Abuse
- AWS Security Group Configuration Change Detection
- AWS Security Token Service (STS) AssumeRole Usage
- AWS VPC Flow Logs Deletion
- AWS WAF Access Control List Deletion
- AWS WAF Rule or Rule Group Deletion
- Abnormal Process ID or Lock File Created
- Abnormally Large DNS Response
- Accepted Default Telnet Port Connection
- Access of Stored Browser Credentials
- Access to Keychain Credentials Directories
- Access to a Sensitive LDAP Attribute
- Account Configured with Never-Expiring Password
- Account Discovery Command via SYSTEM Account
- Account Password Reset Remotely
- AdFind Command Activity
- Adding Hidden File Attribute via Attrib
- AdminSDHolder Backdoor
- AdminSDHolder SDProp Exclusion Added
- Administrator Privileges Assigned to an Okta Group
- Administrator Role Assigned to an Okta User
- Adobe Hijack Persistence
- Adversary Behavior - Detected - Elastic Endgame
- Agent Spoofing - Mismatched Agent ID
- Agent Spoofing - Multiple Hosts Using Same Agent
- Anomalous Linux Compiler Activity
- Anomalous Process For a Linux Population
- Anomalous Process For a Windows Population
- Anomalous Windows Process Creation
- Apple Script Execution followed by Network Connection
- Apple Scripting Execution with Administrator Privileges
- Application Added to Google Workspace Domain
- Application Removed from Blocklist in Google Workspace
- Attempt to Create Okta API Token
- Attempt to Deactivate MFA for an Okta User Account
- Attempt to Deactivate an Okta Application
- Attempt to Deactivate an Okta Network Zone
- Attempt to Deactivate an Okta Policy
- Attempt to Deactivate an Okta Policy Rule
- Attempt to Delete an Okta Application
- Attempt to Delete an Okta Network Zone
- Attempt to Delete an Okta Policy
- Attempt to Delete an Okta Policy Rule
- Attempt to Disable Gatekeeper
- Attempt to Disable Syslog Service
- Attempt to Enable the Root Account
- Attempt to Install Root Certificate
- Attempt to Modify an Okta Application
- Attempt to Modify an Okta Network Zone
- Attempt to Modify an Okta Policy
- Attempt to Modify an Okta Policy Rule
- Attempt to Mount SMB Share via Command Line
- Attempt to Remove File Quarantine Attribute
- Attempt to Reset MFA Factors for an Okta User Account
- Attempt to Revoke Okta API Token
- Attempt to Unload Elastic Endpoint Security Kernel Extension
- Attempted Bypass of Okta MFA
- Attempts to Brute Force a Microsoft 365 User Account
- Attempts to Brute Force an Okta User Account
- Authorization Plugin Modification
- Azure AD Global Administrator Role Assigned
- Azure Active Directory High Risk Sign-in
- Azure Active Directory High Risk User Sign-in Heuristic
- Azure Active Directory PowerShell Sign-in
- Azure Alert Suppression Rule Created or Modified
- Azure Application Credential Modification
- Azure Automation Account Created
- Azure Automation Runbook Created or Modified
- Azure Automation Runbook Deleted
- Azure Automation Webhook Created
- Azure Blob Container Access Level Modification
- Azure Blob Permissions Modification
- Azure Command Execution on Virtual Machine
- Azure Conditional Access Policy Modified
- Azure Diagnostic Settings Deletion
- Azure Event Hub Authorization Rule Created or Updated
- Azure Event Hub Deletion
- Azure External Guest User Invitation
- Azure Firewall Policy Deletion
- Azure Frontdoor Web Application Firewall (WAF) Policy Deleted
- Azure Full Network Packet Capture Detected
- Azure Global Administrator Role Addition to PIM User
- Azure Key Vault Modified
- Azure Kubernetes Events Deleted
- Azure Kubernetes Pods Deleted
- Azure Kubernetes Rolebindings Created
- Azure Network Watcher Deletion
- Azure Privilege Identity Management Role Modified
- Azure Resource Group Deletion
- Azure Service Principal Addition
- Azure Service Principal Credentials Added
- Azure Storage Account Key Regenerated
- Azure Virtual Network Device Modified or Deleted
- BPF filter applied using TC
- Base16 or Base32 Encoding/Decoding Activity
- Bash Shell Profile Modification
- Binary Executed from Shared Memory Directory
- Bypass UAC via Event Viewer
- Chkconfig Service Add
- Clearing Windows Console History
- Clearing Windows Event Logs
- Cobalt Strike Command and Control Beacon
- Command Execution via SolarWinds Process
- Command Prompt Network Connection
- Command Shell Activity Started via RunDLL32
- Component Object Model Hijacking
- Conhost Spawned By Suspicious Parent Process
- Connection to Commonly Abused Free SSL Certificate Providers
- Connection to Commonly Abused Web Services
- Connection to External Network via Telnet
- Connection to Internal Network via Telnet
- Control Panel Process with Unusual Arguments
- Creation of Hidden Files and Directories via CommandLine
- Creation of Hidden Launch Agent or Daemon
- Creation of Hidden Login Item via Apple Script
- Creation of Hidden Shared Object File
- Creation of a Hidden Local User Account
- Creation or Modification of Domain Backup DPAPI private key
- Creation or Modification of Root Certificate
- Creation or Modification of a new GPO Scheduled Task or Service
- Credential Acquisition via Registry Hive Dumping
- Credential Dumping - Detected - Elastic Endgame
- Credential Dumping - Prevented - Elastic Endgame
- Credential Manipulation - Detected - Elastic Endgame
- Credential Manipulation - Prevented - Elastic Endgame
- CyberArk Privileged Access Security Error
- CyberArk Privileged Access Security Recommended Monitor
- DNS Tunneling
- DNS-over-HTTPS Enabled via Registry
- Default Cobalt Strike Team Server Certificate
- Delete Volume USN Journal with Fsutil
- Deleting Backup Catalogs with Wbadmin
- Direct Outbound SMB Connection
- Disable Windows Event and Security Logs Using Built-in Tools
- Disable Windows Firewall Rules via Netsh
- Disabling User Account Control via Registry Modification
- Disabling Windows Defender Security Settings via PowerShell
- Domain Added to Google Workspace Trusted Domains
- Dumping Account Hashes via Built-In Commands
- Dumping of Keychain Content via Security Command
- Dynamic Linker Copy
- EggShell Backdoor Execution
- Elastic Agent Service Terminated
- Emond Rules Creation or Modification
- Enable Host Network Discovery via Netsh
- Encoded Executable Stored in the Registry
- Encrypting Files with WinRar or 7z
- Endpoint Security
- Enumerating Domain Trusts via NLTEST.EXE
- Enumeration Command Spawned via WMIPrvSE
- Enumeration of Administrator Accounts
- Enumeration of Kernel Modules
- Enumeration of Privileged Local Groups Membership
- Enumeration of Users or Groups via Built-in Commands
- Executable File Creation with Multiple Extensions
- Execution from Unusual Directory - Command Line
- Execution of COM object via Xwizard
- Execution of File Written or Modified by Microsoft Office
- Execution of File Written or Modified by PDF Reader
- Execution of Persistent Suspicious Program
- Execution via Electron Child Process Node.js Module
- Execution via MSSQL xp_cmdshell Stored Procedure
- Execution via TSClient Mountpoint
- Execution via local SxS Shared Module
- Execution with Explicit Credentials via Scripting
- Exploit - Detected - Elastic Endgame
- Exploit - Prevented - Elastic Endgame
- Exporting Exchange Mailbox via PowerShell
- External Alerts
- External IP Lookup from Non-Browser Process
- File Deletion via Shred
- File Permission Modification in Writable Directory
- File Transfer or Listener Established via Netcat
- File made Immutable by Chattr
- Finder Sync Plugin Registered and Enabled
- Full User-Mode Dumps Enabled System-Wide
- GCP Firewall Rule Creation
- GCP Firewall Rule Deletion
- GCP Firewall Rule Modification
- GCP IAM Custom Role Creation
- GCP IAM Role Deletion
- GCP IAM Service Account Key Deletion
- GCP Logging Bucket Deletion
- GCP Logging Sink Deletion
- GCP Logging Sink Modification
- GCP Pub/Sub Subscription Creation
- GCP Pub/Sub Subscription Deletion
- GCP Pub/Sub Topic Creation
- GCP Pub/Sub Topic Deletion
- GCP Service Account Creation
- GCP Service Account Deletion
- GCP Service Account Disabled
- GCP Service Account Key Creation
- GCP Storage Bucket Configuration Modification
- GCP Storage Bucket Deletion
- GCP Storage Bucket Permissions Modification
- GCP Virtual Private Cloud Network Deletion
- GCP Virtual Private Cloud Route Creation
- GCP Virtual Private Cloud Route Deletion
- Google Drive Ownership Transferred via Google Workspace
- Google Workspace 2SV Policy Disabled
- Google Workspace API Access Granted via Domain-Wide Delegation of Authority
- Google Workspace Admin Role Assigned to a User
- Google Workspace Admin Role Deletion
- Google Workspace Bitlocker Setting Disabled
- Google Workspace Custom Admin Role Created
- Google Workspace Custom Gmail Route Created or Modified
- Google Workspace MFA Enforcement Disabled
- Google Workspace Password Policy Modified
- Google Workspace Restrictions for Google Marketplace Modified to Allow Any App
- Google Workspace Role Modified
- Google Workspace User Group Access Modified to Allow External Access
- Google Workspace User Organizational Unit Changed
- Group Policy Abuse for Privilege Addition
- Halfbaked Command and Control Beacon
- High Number of Okta User Password Reset or Unlock Attempts
- High Number of Process Terminations
- High Number of Process and/or Service Terminations
- Hosts File Modified
- Hping Process Activity
- IIS HTTP Logging Disabled
- IPSEC NAT Traversal Port Activity
- Image File Execution Options Injection
- ImageLoad via Windows Update Auto Update Client
- Inbound Connection to an Unsecure Elasticsearch Node
- Incoming DCOM Lateral Movement via MSHTA
- Incoming DCOM Lateral Movement with MMC
- Incoming DCOM Lateral Movement with ShellBrowserWindow or ShellWindows
- Incoming Execution via PowerShell Remoting
- Incoming Execution via WinRM Remote Shell
- InstallUtil Process Making Network Connections
- Installation of Custom Shim Databases
- Installation of Security Support Provider
- Interactive Terminal Spawned via Perl
- Interactive Terminal Spawned via Python
- KRBTGT Delegation Backdoor
- Kerberos Cached Credentials Dumping
- Kerberos Pre-authentication Disabled for User
- Kerberos Traffic from Unusual Process
- Kernel Module Removal
- Kernel module load via insmod
- Keychain Password Retrieval via Command Line
- Kubernetes Anonymous Request Authorized
- Kubernetes Container Created with Excessive Linux Capabilities
- Kubernetes Denied Service Account Request
- Kubernetes Exposed Service Created With Type NodePort
- Kubernetes Pod Created With HostIPC
- Kubernetes Pod Created With HostNetwork
- Kubernetes Pod Created With HostPID
- Kubernetes Pod created with a Sensitive hostPath Volume
- Kubernetes Privileged Pod Created
- Kubernetes Suspicious Assignment of Controller Service Account
- Kubernetes Suspicious Self-Subject Review
- Kubernetes User Exec into Pod
- LSASS Memory Dump Creation
- LSASS Memory Dump Handle Access
- Lateral Movement via Startup Folder
- Launch Agent Creation or Modification and Immediate Loading
- LaunchDaemon Creation or Modification and Immediate Loading
- Linux Restricted Shell Breakout via Linux Binary(s)
- Local Account TokenFilter Policy Disabled
- Local Scheduled Task Creation
- MFA Disabled for Google Workspace Organization
- MS Office Macro Security Registry Modifications
- MacOS Installer Package Spawns Network Event
- Malware - Detected - Elastic Endgame
- Malware - Prevented - Elastic Endgame
- Masquerading Space After Filename
- Microsoft 365 Exchange Anti-Phish Policy Deletion
- Microsoft 365 Exchange Anti-Phish Rule Modification
- Microsoft 365 Exchange DKIM Signing Configuration Disabled
- Microsoft 365 Exchange DLP Policy Removed
- Microsoft 365 Exchange Malware Filter Policy Deletion
- Microsoft 365 Exchange Malware Filter Rule Modification
- Microsoft 365 Exchange Management Group Role Assignment
- Microsoft 365 Exchange Safe Attachment Rule Disabled
- Microsoft 365 Exchange Safe Link Policy Disabled
- Microsoft 365 Exchange Transport Rule Creation
- Microsoft 365 Exchange Transport Rule Modification
- Microsoft 365 Global Administrator Role Assigned
- Microsoft 365 Inbox Forwarding Rule Created
- Microsoft 365 Potential ransomware activity
- Microsoft 365 Teams Custom Application Interaction Allowed
- Microsoft 365 Teams External Access Enabled
- Microsoft 365 Teams Guest Access Enabled
- Microsoft 365 Unusual Volume of File Deletion
- Microsoft 365 User Restricted from Sending Email
- Microsoft Build Engine Started an Unusual Process
- Microsoft Build Engine Started by a Script Process
- Microsoft Build Engine Started by a System Process
- Microsoft Build Engine Started by an Office Application
- Microsoft Build Engine Using an Alternate Name
- Microsoft Exchange Server UM Spawning Suspicious Processes
- Microsoft Exchange Server UM Writing Suspicious Files
- Microsoft Exchange Worker Spawning Suspicious Processes
- Microsoft IIS Connection Strings Decryption
- Microsoft IIS Service Account Password Dumped
- Microsoft Windows Defender Tampering
- Mimikatz Memssp Log File Detected
- Modification of AmsiEnable Registry Key
- Modification of Boot Configuration
- Modification of Dynamic Linker Preload Shared Object
- Modification of Environment Variable via Launchctl
- Modification of OpenSSH Binaries
- Modification of Safari Settings via Defaults Command
- Modification of Standard Authentication Module or Configuration
- Modification of WDigest Security Provider
- Modification of the msPKIAccountCredentials
- Modification or Removal of an Okta Application Sign-On Policy
- Mounting Hidden or WebDav Remote Shares
- MsBuild Making Network Connections
- Mshta Making Network Connections
- Multi-Factor Authentication Disabled for an Azure User
- Multiple Alerts in Different ATT&CK Tactics on a Single Host
- Multiple Logon Failure Followed by Logon Success
- Multiple Logon Failure from the same Source Address
- Multiple Vault Web Credentials Read
- My First Alert
- NTDS or SAM Database File Copied
- Namespace Manipulation Using Unshare
- Network Connection via Certutil
- Network Connection via Compiled HTML File
- Network Connection via MsXsl
- Network Connection via Registration Utility
- Network Connection via Signed Binary
- Network Logon Provider Registry Modification
- Network Traffic to Rare Destination Country
- New ActiveSyncAllowedDeviceID Added via PowerShell
- New or Modified Federation Domain
- Nping Process Activity
- NullSessionPipe Registry Modification
- O365 Email Reported by User as Malware or Phish
- O365 Excessive Single Sign-On Logon Errors
- O365 Exchange Suspicious Mailbox Right Delegation
- O365 Mailbox Audit Logging Bypass
- Okta Brute Force or Password Spraying Attack
- Okta User Session Impersonation
- OneDrive Malware File Upload
- Outbound Scheduled Task Activity via PowerShell
- Parent Process PID Spoofing
- Peripheral Device Discovery
- Permission Theft - Detected - Elastic Endgame
- Permission Theft - Prevented - Elastic Endgame
- Persistence via BITS Job Notify Cmdline
- Persistence via DirectoryService Plugin Modification
- Persistence via Docker Shortcut Modification
- Persistence via Folder Action Script
- Persistence via Hidden Run Key Detected
- Persistence via KDE AutoStart Script or Desktop File Modification
- Persistence via Login or Logout Hook
- Persistence via Microsoft Office AddIns
- Persistence via Microsoft Outlook VBA
- Persistence via PowerShell profile
- Persistence via Scheduled Job Creation
- Persistence via TelemetryController Scheduled Task Hijack
- Persistence via Update Orchestrator Service Hijack
- Persistence via WMI Event Subscription
- Persistence via WMI Standard Registry Provider
- Persistent Scripts in the Startup Directory
- Port Forwarding Rule Addition
- Possible Consent Grant Attack via Azure-Registered Application
- Possible FIN7 DGA Command and Control Behavior
- Possible Okta DoS Attack
- Potential Abuse of Repeated MFA Push Notifications
- Potential Admin Group Account Addition
- Potential Application Shimming via Sdbinst
- Potential Command and Control via Internet Explorer
- Potential Cookies Theft via Browser Debugging
- Potential Credential Access via DCSync
- Potential Credential Access via DuplicateHandle in LSASS
- Potential Credential Access via LSASS Memory Dump
- Potential Credential Access via Renamed COM+ Services DLL
- Potential Credential Access via Trusted Developer Utility
- Potential Credential Access via Windows Utilities
- Potential DLL Side-Loading via Microsoft Antimalware Service Executable
- Potential DLL SideLoading via Trusted Microsoft Programs
- Potential DNS Tunneling via Iodine
- Potential DNS Tunneling via NsLookup
- Potential Disabling of SELinux
- Potential Evasion via Filter Manager
- Potential Hidden Local User Account Creation
- Potential Invoke-Mimikatz PowerShell Script
- Potential JAVA/JNDI Exploitation Attempt
- Potential Kerberos Attack via Bifrost
- Potential LSA Authentication Package Abuse
- Potential LSASS Clone Creation via PssCaptureSnapShot
- Potential LSASS Memory Dump via PssCaptureSnapShot
- Potential Lateral Tool Transfer via SMB Share
- Potential Linux SSH Brute Force Detected
- Potential Local NTLM Relay via HTTP
- Potential Microsoft Office Sandbox Evasion
- Potential Modification of Accessibility Binaries
- Potential Non-Standard Port SSH connection
- Potential OpenSSH Backdoor Logging Activity
- Potential Password Spraying of Microsoft 365 User Accounts
- Potential Persistence via Atom Init Script Modification
- Potential Persistence via Login Hook
- Potential Persistence via Periodic Tasks
- Potential Persistence via Time Provider Modification
- Potential Port Monitor or Print Processor Registration Abuse
- Potential Privacy Control Bypass via Localhost Secure Copy
- Potential Privacy Control Bypass via TCCDB Modification
- Potential Privilege Escalation via InstallerFileTakeOver
- Potential Privilege Escalation via PKEXEC
- Potential Privilege Escalation via Sudoers File Modification
- Potential Privileged Escalation via SamAccountName Spoofing
- Potential Process Herpaderping Attempt
- Potential Process Injection via PowerShell
- Potential Protocol Tunneling via EarthWorm
- Potential Remote Credential Access via Registry
- Potential Remote Desktop Shadowing Activity
- Potential Remote Desktop Tunneling Detected
- Potential Reverse Shell Activity via Terminal
- Potential SSH Brute Force Detected on Privileged Account
- Potential SSH Password Guessing
- Potential Secure File Deletion via SDelete Utility
- Potential Shadow Credentials added to AD Object
- Potential Shadow File Read via Command Line Utilities
- Potential SharpRDP Behavior
- Potential Shell via Web Server
- Potential Windows Error Manager Masquerading
- Potential macOS SSH Brute Force Detected
- PowerShell Kerberos Ticket Request
- PowerShell Keylogging Script
- PowerShell MiniDump Script
- PowerShell PSReflect Script
- PowerShell Script Block Logging Disabled
- PowerShell Script with Token Impersonation Capabilities
- PowerShell Share Enumeration Script
- PowerShell Suspicious Discovery Related Windows API Functions
- PowerShell Suspicious Payload Encoded and Compressed
- PowerShell Suspicious Script with Audio Capture Capabilities
- PowerShell Suspicious Script with Screenshot Capabilities
- Privilege Escalation via Named Pipe Impersonation
- Privilege Escalation via Rogue Named Pipe Impersonation
- Privilege Escalation via Root Crontab File Modification
- Privilege Escalation via Windir Environment Variable
- Privileged Account Brute Force
- Privileges Elevation via Parent Process PID Spoofing
- Process Activity via Compiled HTML File
- Process Created with an Elevated Token
- Process Creation via Secondary Logon
- Process Execution from an Unusual Directory
- Process Injection - Detected - Elastic Endgame
- Process Injection - Prevented - Elastic Endgame
- Process Injection by the Microsoft Build Engine
- Process Started from Process ID (PID) File
- Process Termination followed by Deletion
- Program Files Directory Masquerading
- Prompt for Credentials with OSASCRIPT
- PsExec Network Connection
- RDP (Remote Desktop Protocol) from the Internet
- RDP Enabled via Registry
- RPC (Remote Procedure Call) from the Internet
- RPC (Remote Procedure Call) to the Internet
- Ransomware - Detected - Elastic Endgame
- Ransomware - Prevented - Elastic Endgame
- Rare AWS Error Code
- Rare User Logon
- Registry Persistence via AppCert DLL
- Registry Persistence via AppInit DLL
- Remote Computer Account DnsHostName Update
- Remote Desktop Enabled in Windows Firewall by Netsh
- Remote Execution via File Shares
- Remote File Copy to a Hidden Share
- Remote File Copy via TeamViewer
- Remote File Download via Desktopimgdownldr Utility
- Remote File Download via MpCmdRun
- Remote File Download via PowerShell
- Remote File Download via Script Interpreter
- Remote Logon followed by Scheduled Task Creation
- Remote SSH Login Enabled via systemsetup Command
- Remote Scheduled Task Creation
- Remote System Discovery Commands
- Remote Windows Service Installed
- Remotely Started Services via RPC
- Renamed AutoIt Scripts Interpreter
- Reverse Shell Created via Named Pipe
- Roshal Archive (RAR) or PowerShell File Downloaded from the Internet
- SIP Provider Modification
- SMB (Windows File Sharing) Activity to the Internet
- SMTP on Port 26/TCP
- SSH Authorized Keys File Modification
- SUNBURST Command and Control Activity
- Scheduled Task Created by a Windows Script
- Scheduled Task Execution at Scale via GPO
- Scheduled Tasks AT Command Enabled
- Screensaver Plist File Modified by Unexpected Process
- SeDebugPrivilege Enabled by a Suspicious Process
- Searching for Saved Credentials via VaultCmd
- Security Software Discovery using WMIC
- Security Software Discovery via Grep
- Sensitive Files Compression
- Sensitive Privilege SeEnableDelegationPrivilege assigned to a User
- Service Command Lateral Movement
- Service Control Spawned via Script Interpreter
- Service Creation via Local Kerberos Authentication
- Setuid / Setgid Bit Set via chmod
- SharePoint Malware File Upload
- Shell Execution via Apple Scripting
- Signed Proxy Execution via MS Work Folders
- SoftwareUpdate Preferences Modification
- SolarWinds Process Disabling Services via Registry
- Spike in AWS Error Messages
- Spike in Failed Logon Events
- Spike in Firewall Denies
- Spike in Logon Events
- Spike in Logon Events from a Source IP
- Spike in Network Traffic
- Spike in Network Traffic To a Country
- Startup Folder Persistence via Unsigned Process
- Startup Persistence by a Suspicious Process
- Startup or Run Key Registry Modification
- Startup/Logon Script added to Group Policy Object
- Sublime Plugin or Application Script Modification
- Sudo Heap-Based Buffer Overflow Attempt
- Sudoers File Modification
- Suspicious .NET Code Compilation
- Suspicious .NET Reflection via PowerShell
- Suspicious Activity Reported by Okta User
- Suspicious Automator Workflows Execution
- Suspicious Browser Child Process
- Suspicious Calendar File Modification
- Suspicious CertUtil Commands
- Suspicious Child Process of Adobe Acrobat Reader Update Service
- Suspicious Cmd Execution via WMI
- Suspicious CronTab Creation or Modification
- Suspicious DLL Loaded for Persistence or Privilege Escalation
- Suspicious Emond Child Process
- Suspicious Endpoint Security Parent Process
- Suspicious Execution - Short Program Name
- Suspicious Execution from a Mounted Device
- Suspicious Execution via Scheduled Task
- Suspicious Explorer Child Process
- Suspicious File Creation in /etc for Persistence
- Suspicious HTML File Creation
- Suspicious Hidden Child Process of Launchd
- Suspicious Image Load (taskschd.dll) from MS Office
- Suspicious ImagePath Service Creation
- Suspicious JAVA Child Process
- Suspicious LSASS Access via MalSecLogon
- Suspicious MS Office Child Process
- Suspicious MS Outlook Child Process
- Suspicious Managed Code Hosting Process
- Suspicious Microsoft Diagnostics Wizard Execution
- Suspicious Network Connection Attempt by Root
- Suspicious PDF Reader Child Process
- Suspicious Portable Executable Encoded in Powershell Script
- Suspicious PowerShell Engine ImageLoad
- Suspicious Powershell Script
- Suspicious Print Spooler File Deletion
- Suspicious Print Spooler Point and Print DLL
- Suspicious Print Spooler SPL File Created
- Suspicious PrintSpooler Service Executable File Creation
- Suspicious Process Access via Direct System Call
- Suspicious Process Creation CallTrace
- Suspicious Process Execution via Renamed PsExec Executable
- Suspicious RDP ActiveX Client Loaded
- Suspicious Remote Registry Access via SeBackupPrivilege
- Suspicious Script Object Execution
- Suspicious SolarWinds Child Process
- Suspicious Startup Shell Folder Modification
- Suspicious WMI Image Load from MS Office
- Suspicious WMIC XSL Script Execution
- Suspicious WerFault Child Process
- Suspicious Zoom Child Process
- Suspicious macOS MS Office Child Process
- Suspicious service was installed in the system
- Svchost spawning Cmd
- Symbolic Link to Shadow Copy Created
- System Information Discovery via Windows Command Shell
- System Log File Deletion
- System Shells via Services
- SystemKey Access via Command Line
- TCC Bypass via Mounted APFS Snapshot Access
- Tampering of Bash Command-Line History
- Temporarily Scheduled Task Creation
- Third-party Backup Files Deleted via Unexpected Process
- Threat Detected by Okta ThreatInsight
- Threat Intel Filebeat Module (v8.x) Indicator Match
- Threat Intel Indicator Match
- Timestomping using Touch Command
- UAC Bypass Attempt via Elevated COM Internet Explorer Add-On Installer
- UAC Bypass Attempt via Privileged IFileOperation COM Interface
- UAC Bypass Attempt via Windows Directory Masquerading
- UAC Bypass Attempt with IEditionUpgradeManager Elevated COM Interface
- UAC Bypass via DiskCleanup Scheduled Task Hijack
- UAC Bypass via ICMLuaUtil Elevated COM Interface
- UAC Bypass via Windows Firewall Snap-In Hijack
- Unauthorized Access to an Okta Application
- Uncommon Registry Persistence Change
- Unexpected Child Process of macOS Screensaver Engine
- Unusual AWS Command for a User
- Unusual Child Process from a System Virtual Process
- Unusual Child Process of dns.exe
- Unusual Child Processes of RunDLL32
- Unusual City For an AWS Command
- Unusual Country For an AWS Command
- Unusual DNS Activity
- Unusual Executable File Creation by a System Critical Process
- Unusual File Creation - Alternate Data Stream
- Unusual File Modification by dns.exe
- Unusual Hour for a User to Logon
- Unusual Linux Network Activity
- Unusual Linux Network Connection Discovery
- Unusual Linux Network Port Activity
- Unusual Linux Process Calling the Metadata Service
- Unusual Linux Process Discovery Activity
- Unusual Linux System Information Discovery Activity
- Unusual Linux System Network Configuration Discovery
- Unusual Linux System Owner or User Discovery Activity
- Unusual Linux User Calling the Metadata Service
- Unusual Linux Username
- Unusual Login Activity
- Unusual Network Activity from a Windows System Binary
- Unusual Network Connection via DllHost
- Unusual Network Connection via RunDLL32
- Unusual Network Destination Domain Name
- Unusual Parent Process for cmd.exe
- Unusual Parent-Child Relationship
- Unusual Persistence via Services Registry
- Unusual Print Spooler Child Process
- Unusual Process Execution Path - Alternate Data Stream
- Unusual Process For a Linux Host
- Unusual Process For a Windows Host
- Unusual Process Network Connection
- Unusual Service Host Child Process - Childless Service
- Unusual Source IP for a User to Logon from
- Unusual Sudo Activity
- Unusual Web Request
- Unusual Web User Agent
- Unusual Windows Network Activity
- Unusual Windows Path Activity
- Unusual Windows Process Calling the Metadata Service
- Unusual Windows Remote User
- Unusual Windows Service
- Unusual Windows User Calling the Metadata Service
- Unusual Windows User Privilege Elevation Activity
- Unusual Windows Username
- User Account Creation
- User Added as Owner for Azure Application
- User Added as Owner for Azure Service Principal
- User Added to Privileged Group
- User account exposed to Kerberoasting
- VNC (Virtual Network Computing) from the Internet
- VNC (Virtual Network Computing) to the Internet
- Virtual Machine Fingerprinting
- Virtual Machine Fingerprinting via Grep
- Virtual Private Network Connection Attempt
- Volume Shadow Copy Deleted or Resized via VssAdmin
- Volume Shadow Copy Deletion via PowerShell
- Volume Shadow Copy Deletion via WMIC
- WMI Incoming Lateral Movement
- Web Application Suspicious Activity: POST Request Declined
- Web Application Suspicious Activity: Unauthorized Method
- Web Application Suspicious Activity: sqlmap User Agent
- Web Shell Detection: Script Process Child of Common Web Processes
- WebProxy Settings Modification
- WebServer Access Logs Deleted
- Whoami Process Activity
- Windows CryptoAPI Spoofing Vulnerability (CVE-2020-0601 - CurveBall)
- Windows Defender Disabled via Registry Modification
- Windows Defender Exclusions Added via PowerShell
- Windows Event Logs Cleared
- Windows Firewall Disabled via PowerShell
- Windows Network Enumeration
- Windows Registry File Creation in SMB Share
- Windows Script Executing PowerShell
- Windows Script Interpreter Executing Process via WMI
- Windows Service Installed via an Unusual Client
- Wireless Credential Dumping using Netsh Command
- Zoom Meeting with no Passcode
- Downloadable rule updates
- Configure endpoint protection with Elastic Defend
- Manage Elastic Defend
- Endpoints
- Policies
- Trusted applications
- Event filters
- Host isolation exceptions
- Blocklist
- Optimize Elastic Defend
- Event capture and Elastic Defend
- Endpoint protection rules
- Allowlist Elastic Endpoint in third-party antivirus apps
- Elastic Endpoint self-protection features
- Elastic Endpoint command reference
- Endpoint response actions
- Cloud Security
- Dashboards
- Explore
- Advanced Entity Analytics
- Investigation tools
- Elastic Security APIs
- Detections API
- Exceptions API
- Create exception container
- Create exceptions used by multiple rules
- Create shared exception list
- Find exception containers
- Find exception items
- Get exception container
- Get exception item
- Import exception list
- Export exception list
- Update exception container
- Summary exception container
- Update exception item
- Delete exception container
- Delete exception item
- Lists index endpoint
- Lists API
- Detection Alerts Migration API
- Timeline API
- Get Timelines or Timeline templates
- Get Timeline or Timeline template by savedObjectId
- Get Timeline template by templateTimelineId
- Create Timeline or Timeline template
- Update Timeline or Timeline template
- Add a note to an existing Timeline
- Pin an event to an existing Timeline
- Delete Timelines or Timeline templates
- Import timelines and timeline templates
- Cases API
- Actions API (for pushing cases to external systems)
- Endpoint management API
- Get endpoint
- List endpoints
- Isolate a host
- Release an isolated host
- Terminate a process
- Suspend a process
- Get processes
- Get a file from a host
- Execute a command on a host
- Upload file to host
- Scan a file or folder
- Trusted applications
- Event filters
- Host isolation exceptions
- Blocklist
- Get action details
- List response actions
- Elastic AI Assistant API
- Asset criticality API
- Elastic Security fields and object schemas
- Troubleshooting
- Release notes
Hosts page
editHosts page
editThe Hosts page provides a comprehensive overview of all hosts and host-related security events. Key performance indicator (KPI) charts, data tables, and interactive widgets let you view specific data, drill down for deeper insights, and interact with Timeline for further investigation.
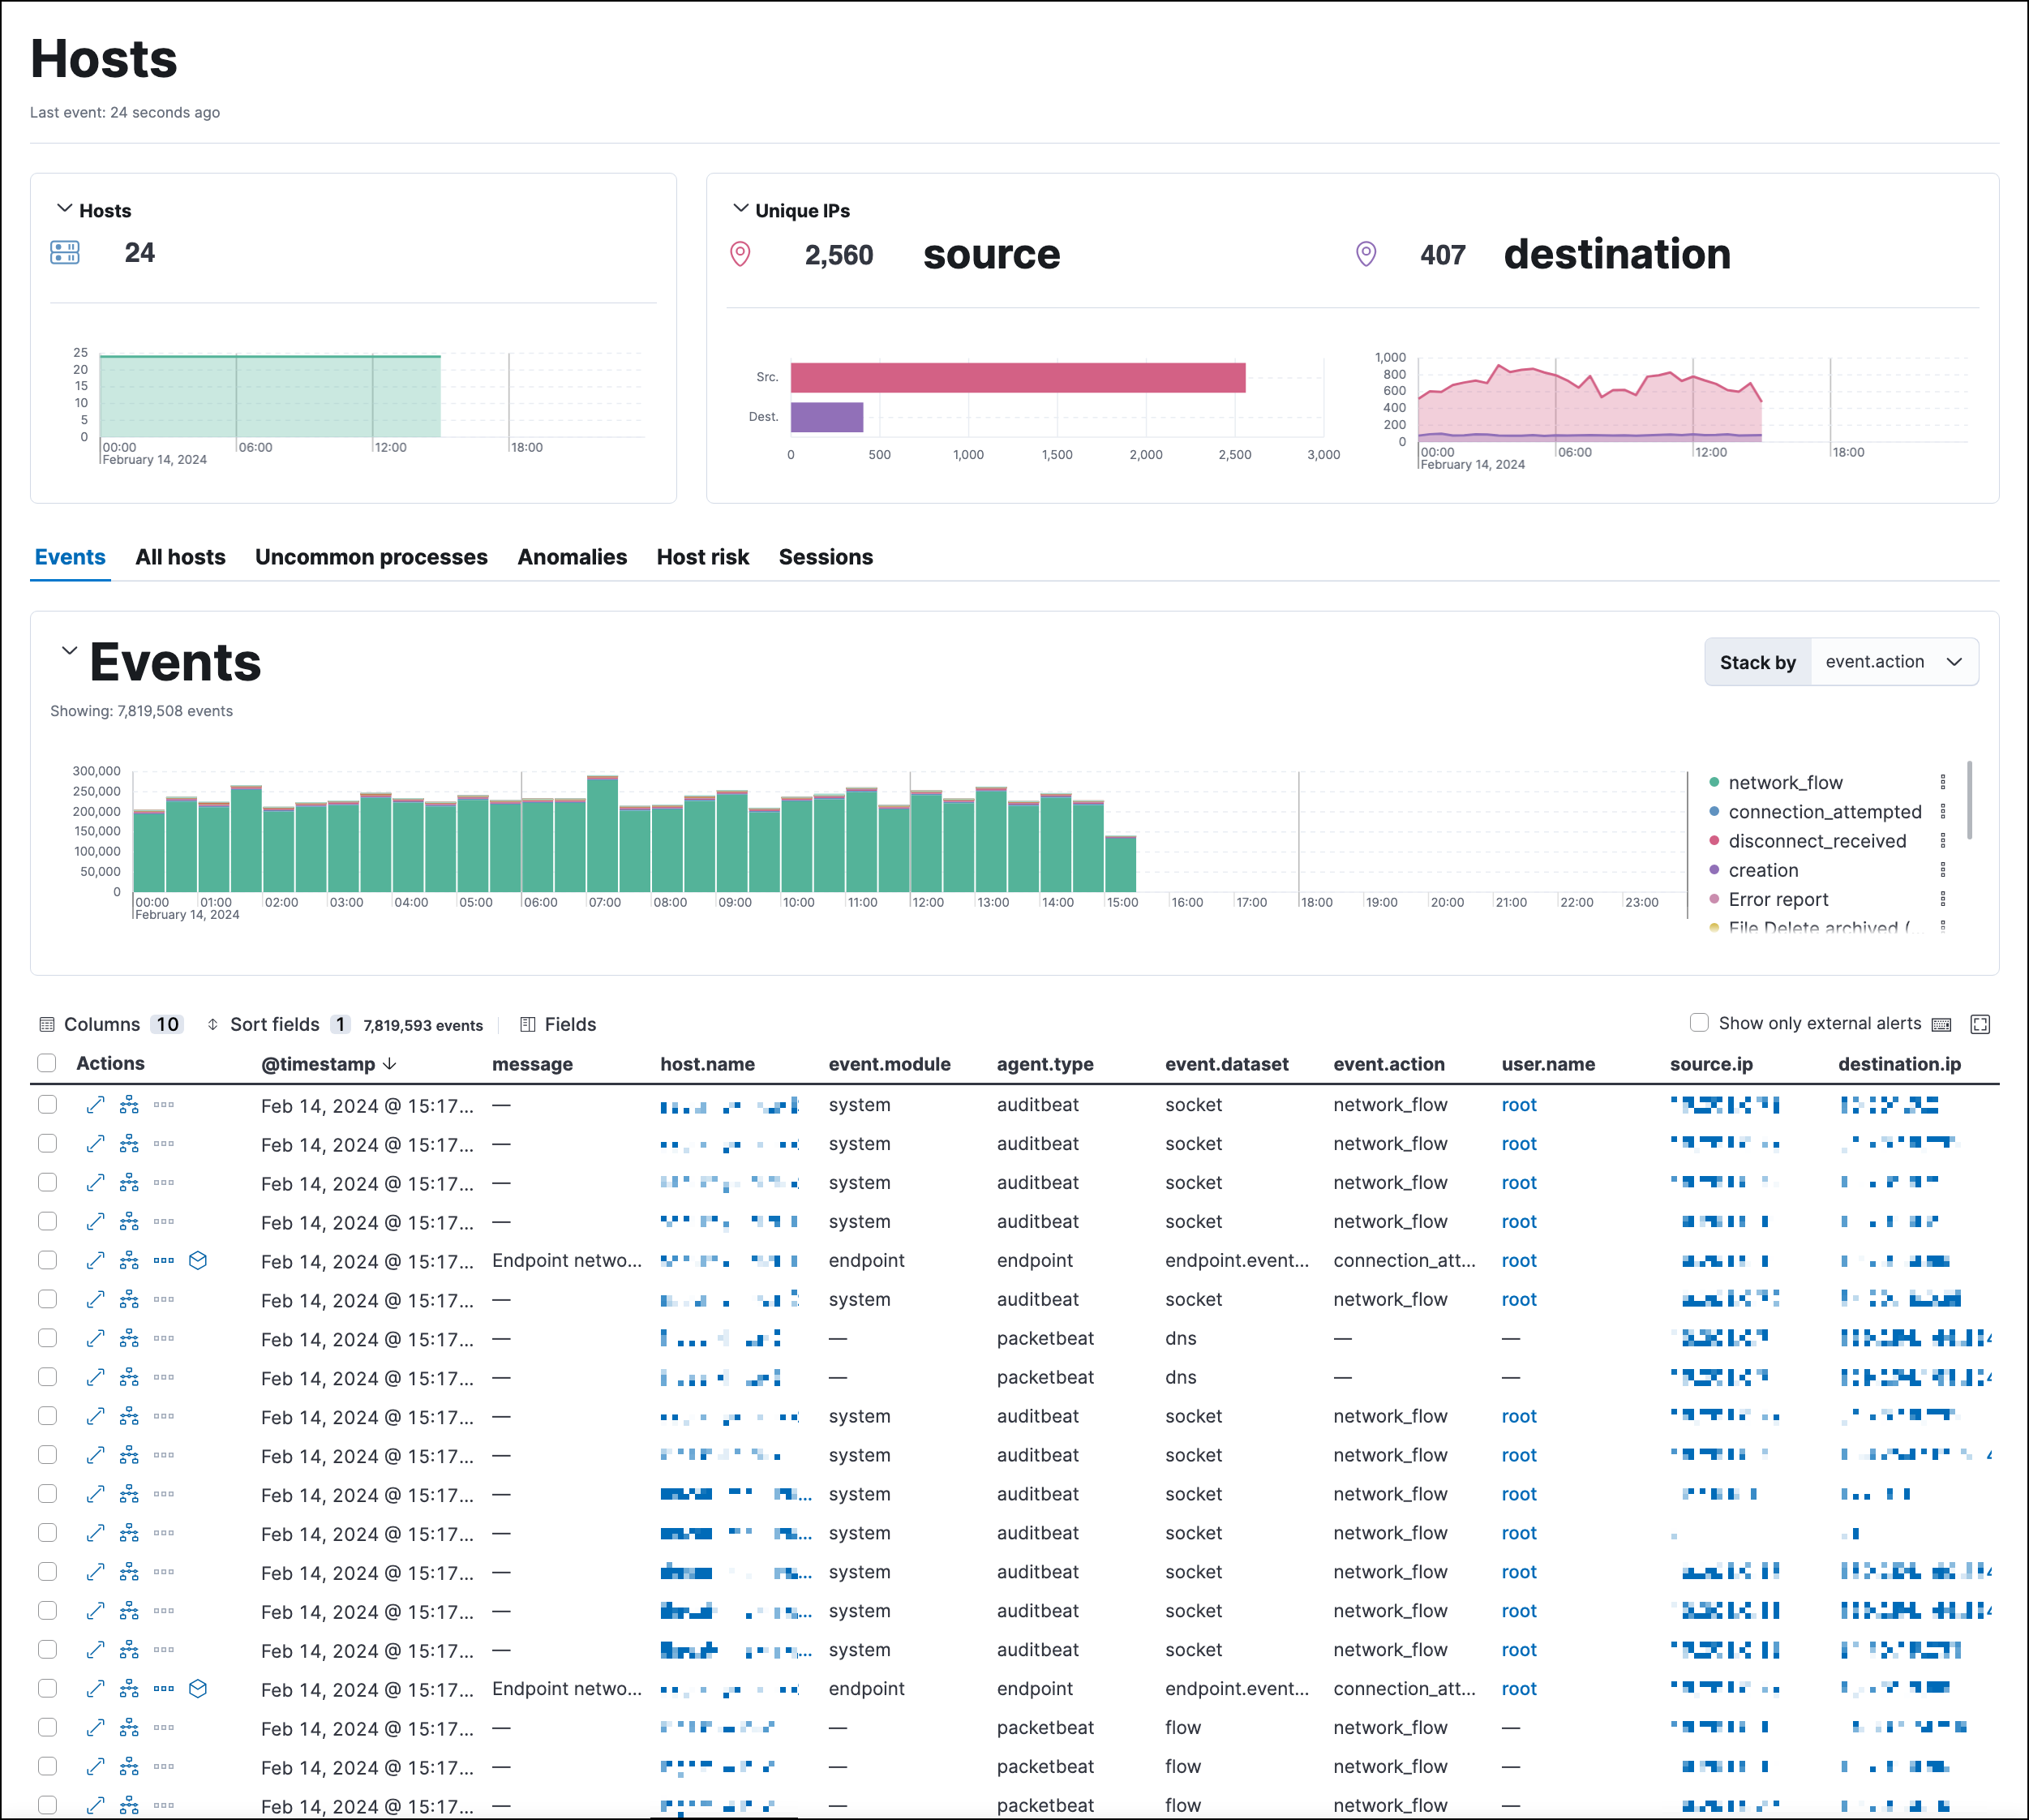
The Hosts page has the following sections:
Host KPI (key performance indicator) charts
editKPI charts show metrics for hosts and unique IPs within the time range specified in the date picker. This data is visualized using linear or bar graphs.
Hover inside a KPI chart to display the actions menu (…), where you can perform these actions: inspect, open in Lens, and add to a new or existing case.
Data tables
editBeneath the KPI charts are data tables, categorized by individual tabs, which are useful for viewing and investigating specific types of data. Select the relevant tab to view the following data:
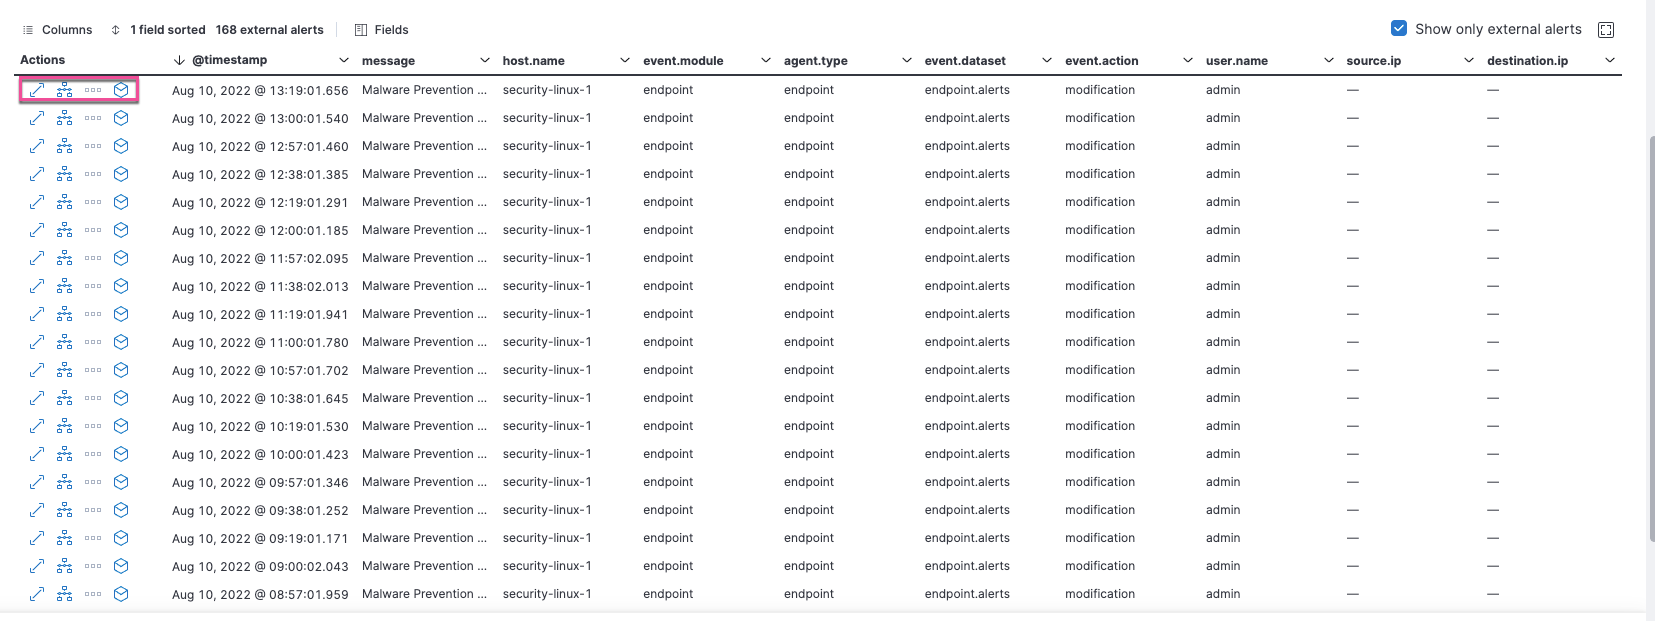
- Events: All host events. To display alerts received from external monitoring tools, scroll down to the Events table and select Show only external alerts on the right.
- All hosts: High-level host details.
- Uncommon processes: Uncommon processes running on hosts.
- Anomalies: Anomalies discovered by machine learning jobs.
- Host risk: The latest recorded host risk score for each host, and its host risk classification. This feature requires a Platinum subscription or higher and must be enabled to display the data. Click Enable on the Host risk tab to get started. To learn more, refer to our entity risk scoring documentation.
- Sessions: Linux process events that you can open in Session View, an investigation tool that allows you to examine Linux process data at a hierarchal level.
The tables within the Events and Sessions tabs include inline actions and several customization options. To learn more about what you can do with the data in these tables, refer to Manage detection alerts.
Host details page
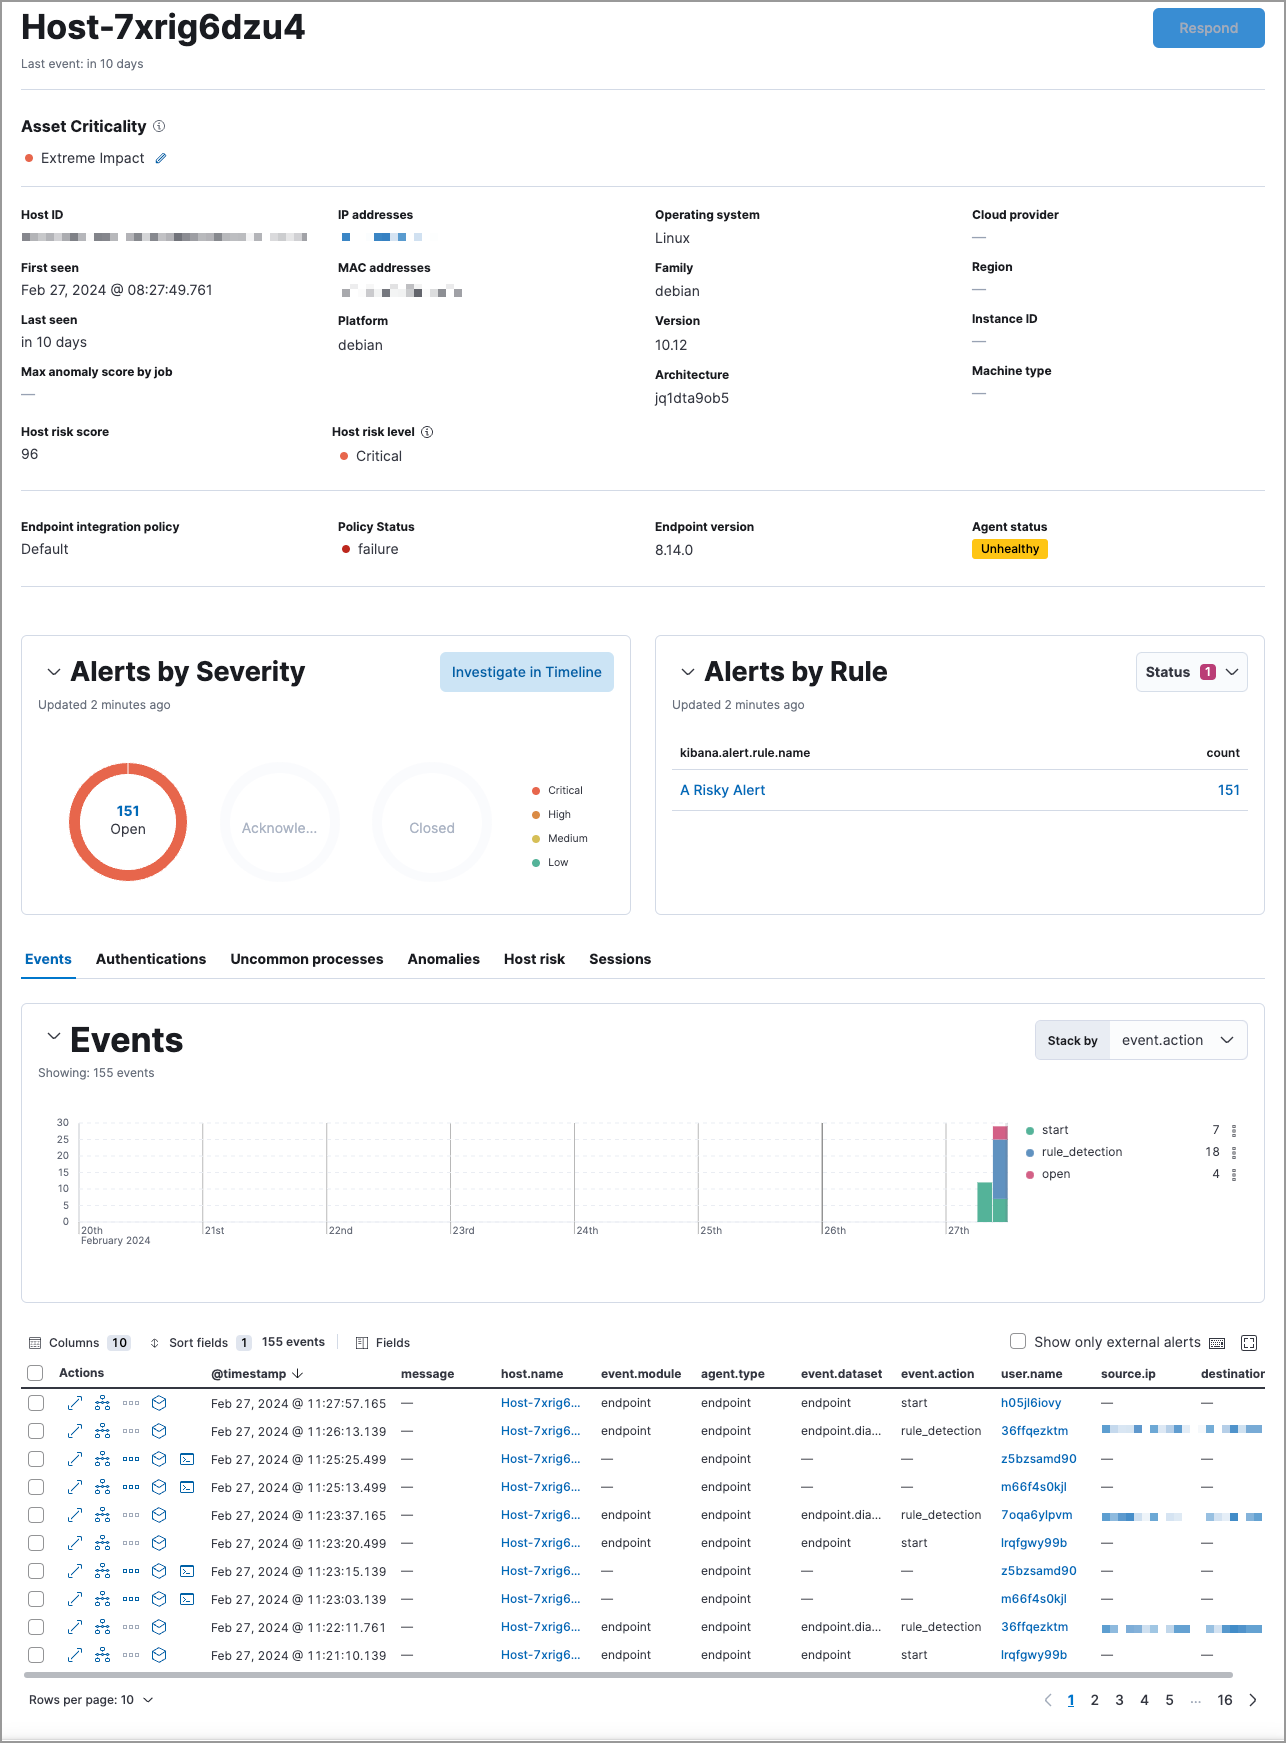
editA host’s details page displays all relevant information for the selected host. To view a host’s details page, click its Host name link in the All hosts table.
The host details page includes the following sections:
- Asset Criticality: This section displays the host’s current asset criticality level.
- Summary: Details such as the host ID, when the host was first and last seen, the associated IP addresses, and associated operating system. If the host risk score feature is enabled, this section also displays host risk score data.
-
Alert metrics: The total number of alerts by severity, rule, and status (
Open,Acknowledged, orClosed). - Data tables: The same data tables as on the main Hosts page, except with values for the selected host instead of all hosts.
Host details flyout
editIn addition to the host details page, relevant host information is also available in the host details flyout throughout the Elastic Security app. You can access this flyout from the following places:
- The Alerts page, by clicking on a host name in the Alerts
- The Entity Analytics dashboard, by clicking on a host name in the Host Risk Scores table
- The Events tab on the Users and user details pages, by clicking on a host name in the Events table
- The User risk tab on the user details page, by clicking on a host name in the Top risk score contributors table
- The Events tab on the Hosts and host details pages, by clicking on a host name in the Events table
- The Host risk tab on the host details page, by clicking on a host name in the Top risk score contributors table
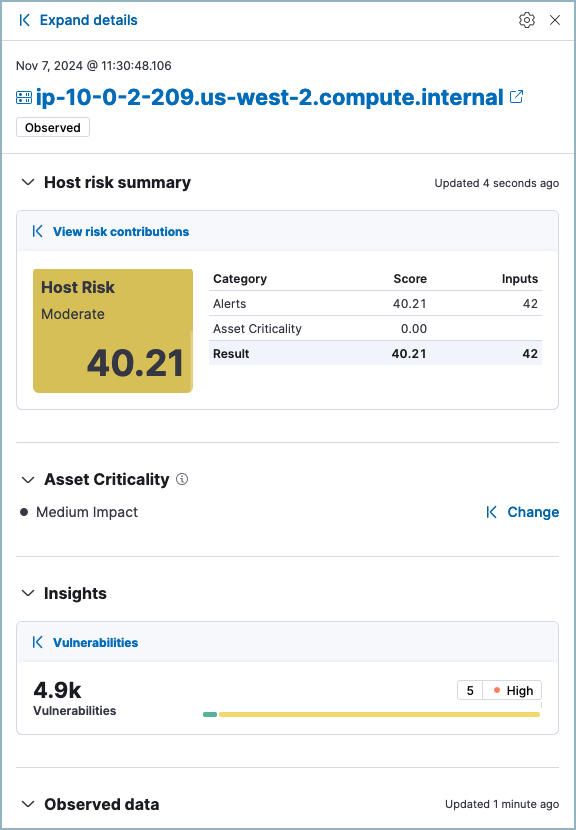
The host details flyout includes the following sections:
- Host risk summary, which displays host risk data and inputs.
- Asset Criticality, which allows you to view and assign asset criticality.
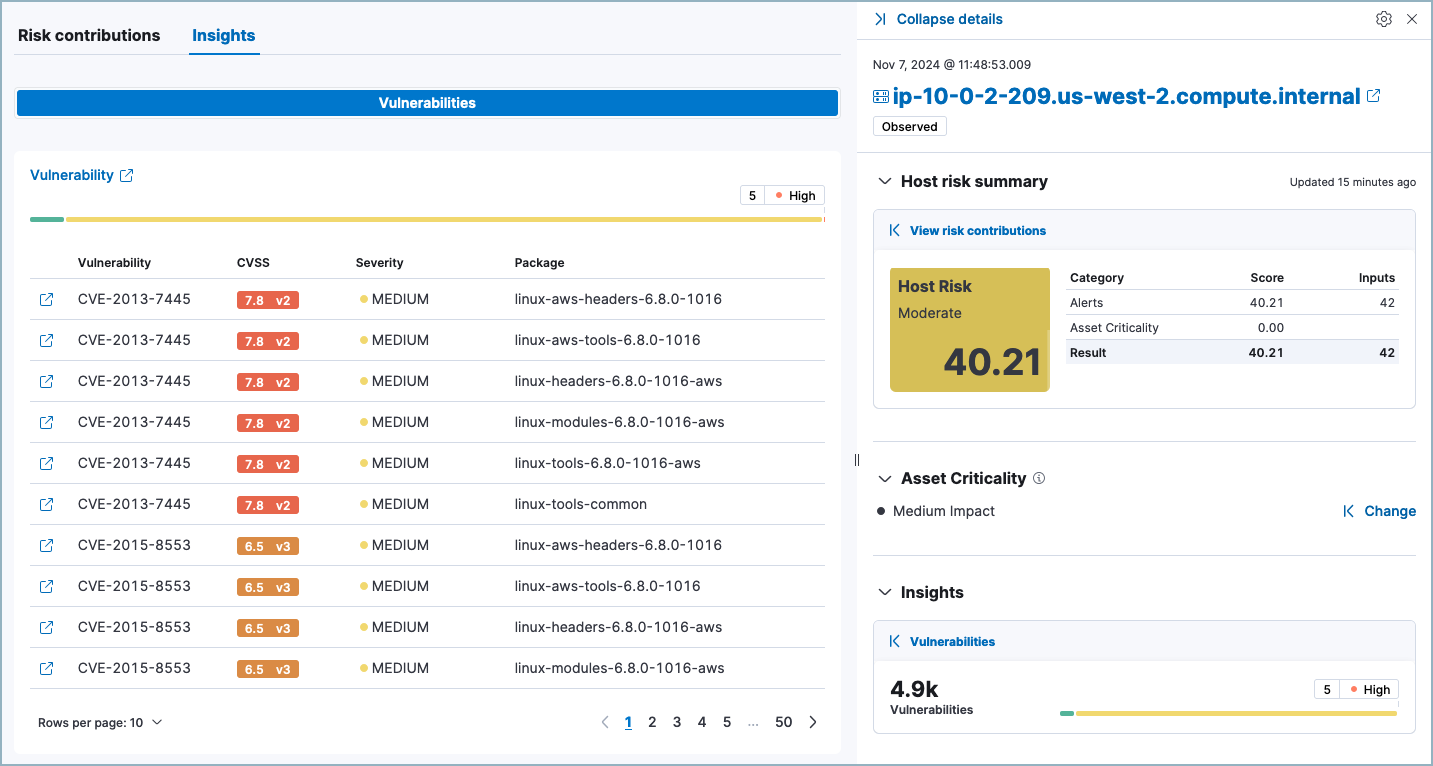
- Insights, which displays vulnerabilities findings for the host.
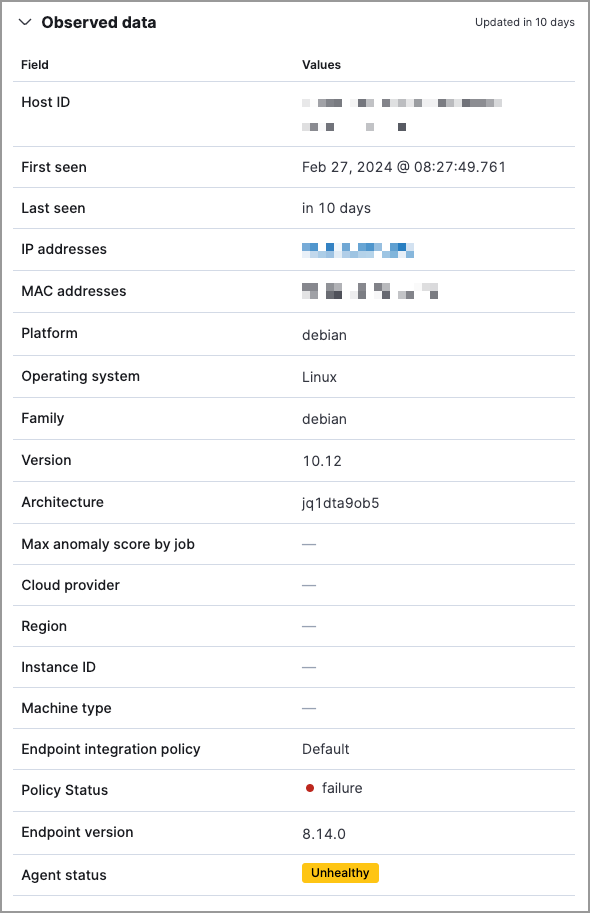
- Observed data, which displays host details.
Host risk summary
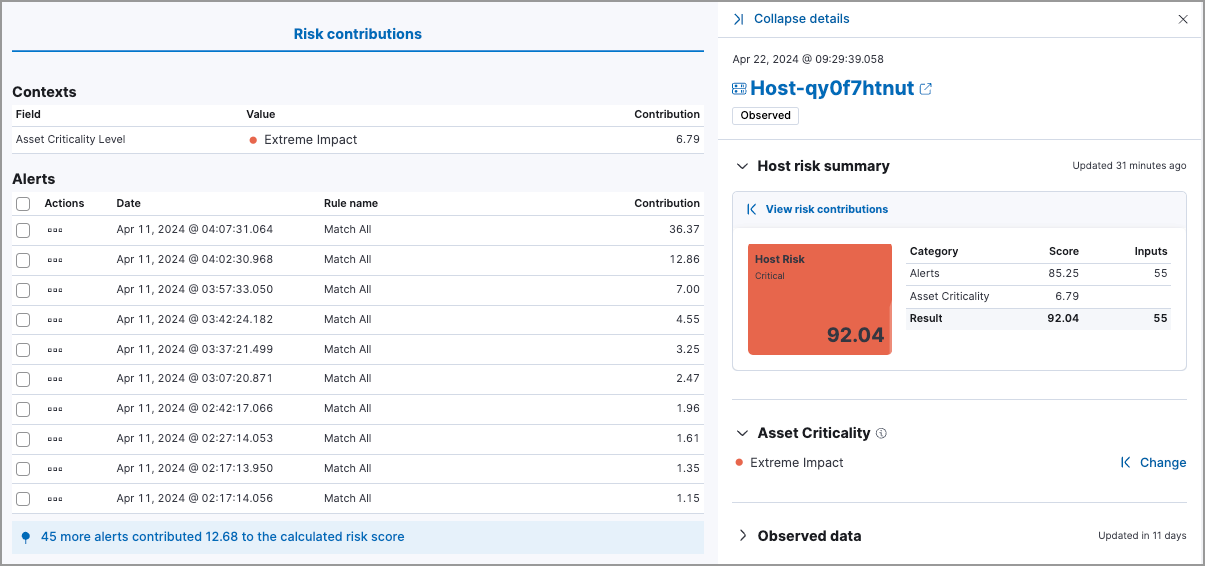
editThe Host risk summary section contains a risk summary visualization and table.
The risk summary visualization shows the host risk score and host risk level. Hover over the visualization to display the Options menu. Use this menu to inspect the visualization’s queries, add it to a new or existing case, save it to your Visualize Library, or open it in Lens for customization.
The risk summary table shows the category, score, and number of risk inputs that determine the host risk score. Hover over the table to display the Inspect button, which allows you to inspect the table’s queries.
To expand the Host risk summary section, click View risk contributions. The left panel displays additional details about the host’s risk inputs:
- The asset criticality level and contribution score from the latest risk scoring calculation.
- The top 10 alerts that contributed to the latest risk scoring calculation, and each alert’s contribution score.
If more than 10 alerts contributed to the risk scoring calculation, the remaining alerts' aggregate contribution score is displayed below the Alerts table.
Asset Criticality
editThe Asset Criticality section displays the selected host’s asset criticality level. Asset criticality contributes to the overall host risk score. The criticality level defines how impactful the host is when calculating the risk score.

Click Assign to assign a criticality level to the selected host, or Change to change the currently assigned criticality level.
Insights
editThe Insights section displays Vulnerabilities Findings for the host. Click Vulnerabilities to expand the flyout and view this data.
Observed data
editThis section displays details such as the host ID, when the host was first and last seen, the associated IP addresses and operating system, and the relevant Endpoint integration policy information.
On this page