Getting Started
editGetting Started
editTo use the Watcher UI, you need to create users with Watcher specific roles as described here.
To access Watcher UI within Kibana:
-
Open Kibana in your web browser and log in. If you are running Kibana
locally, go to
http://localhost:5601/. -
Click Management in the side navigation, then select Watcher under
Elasticsearch.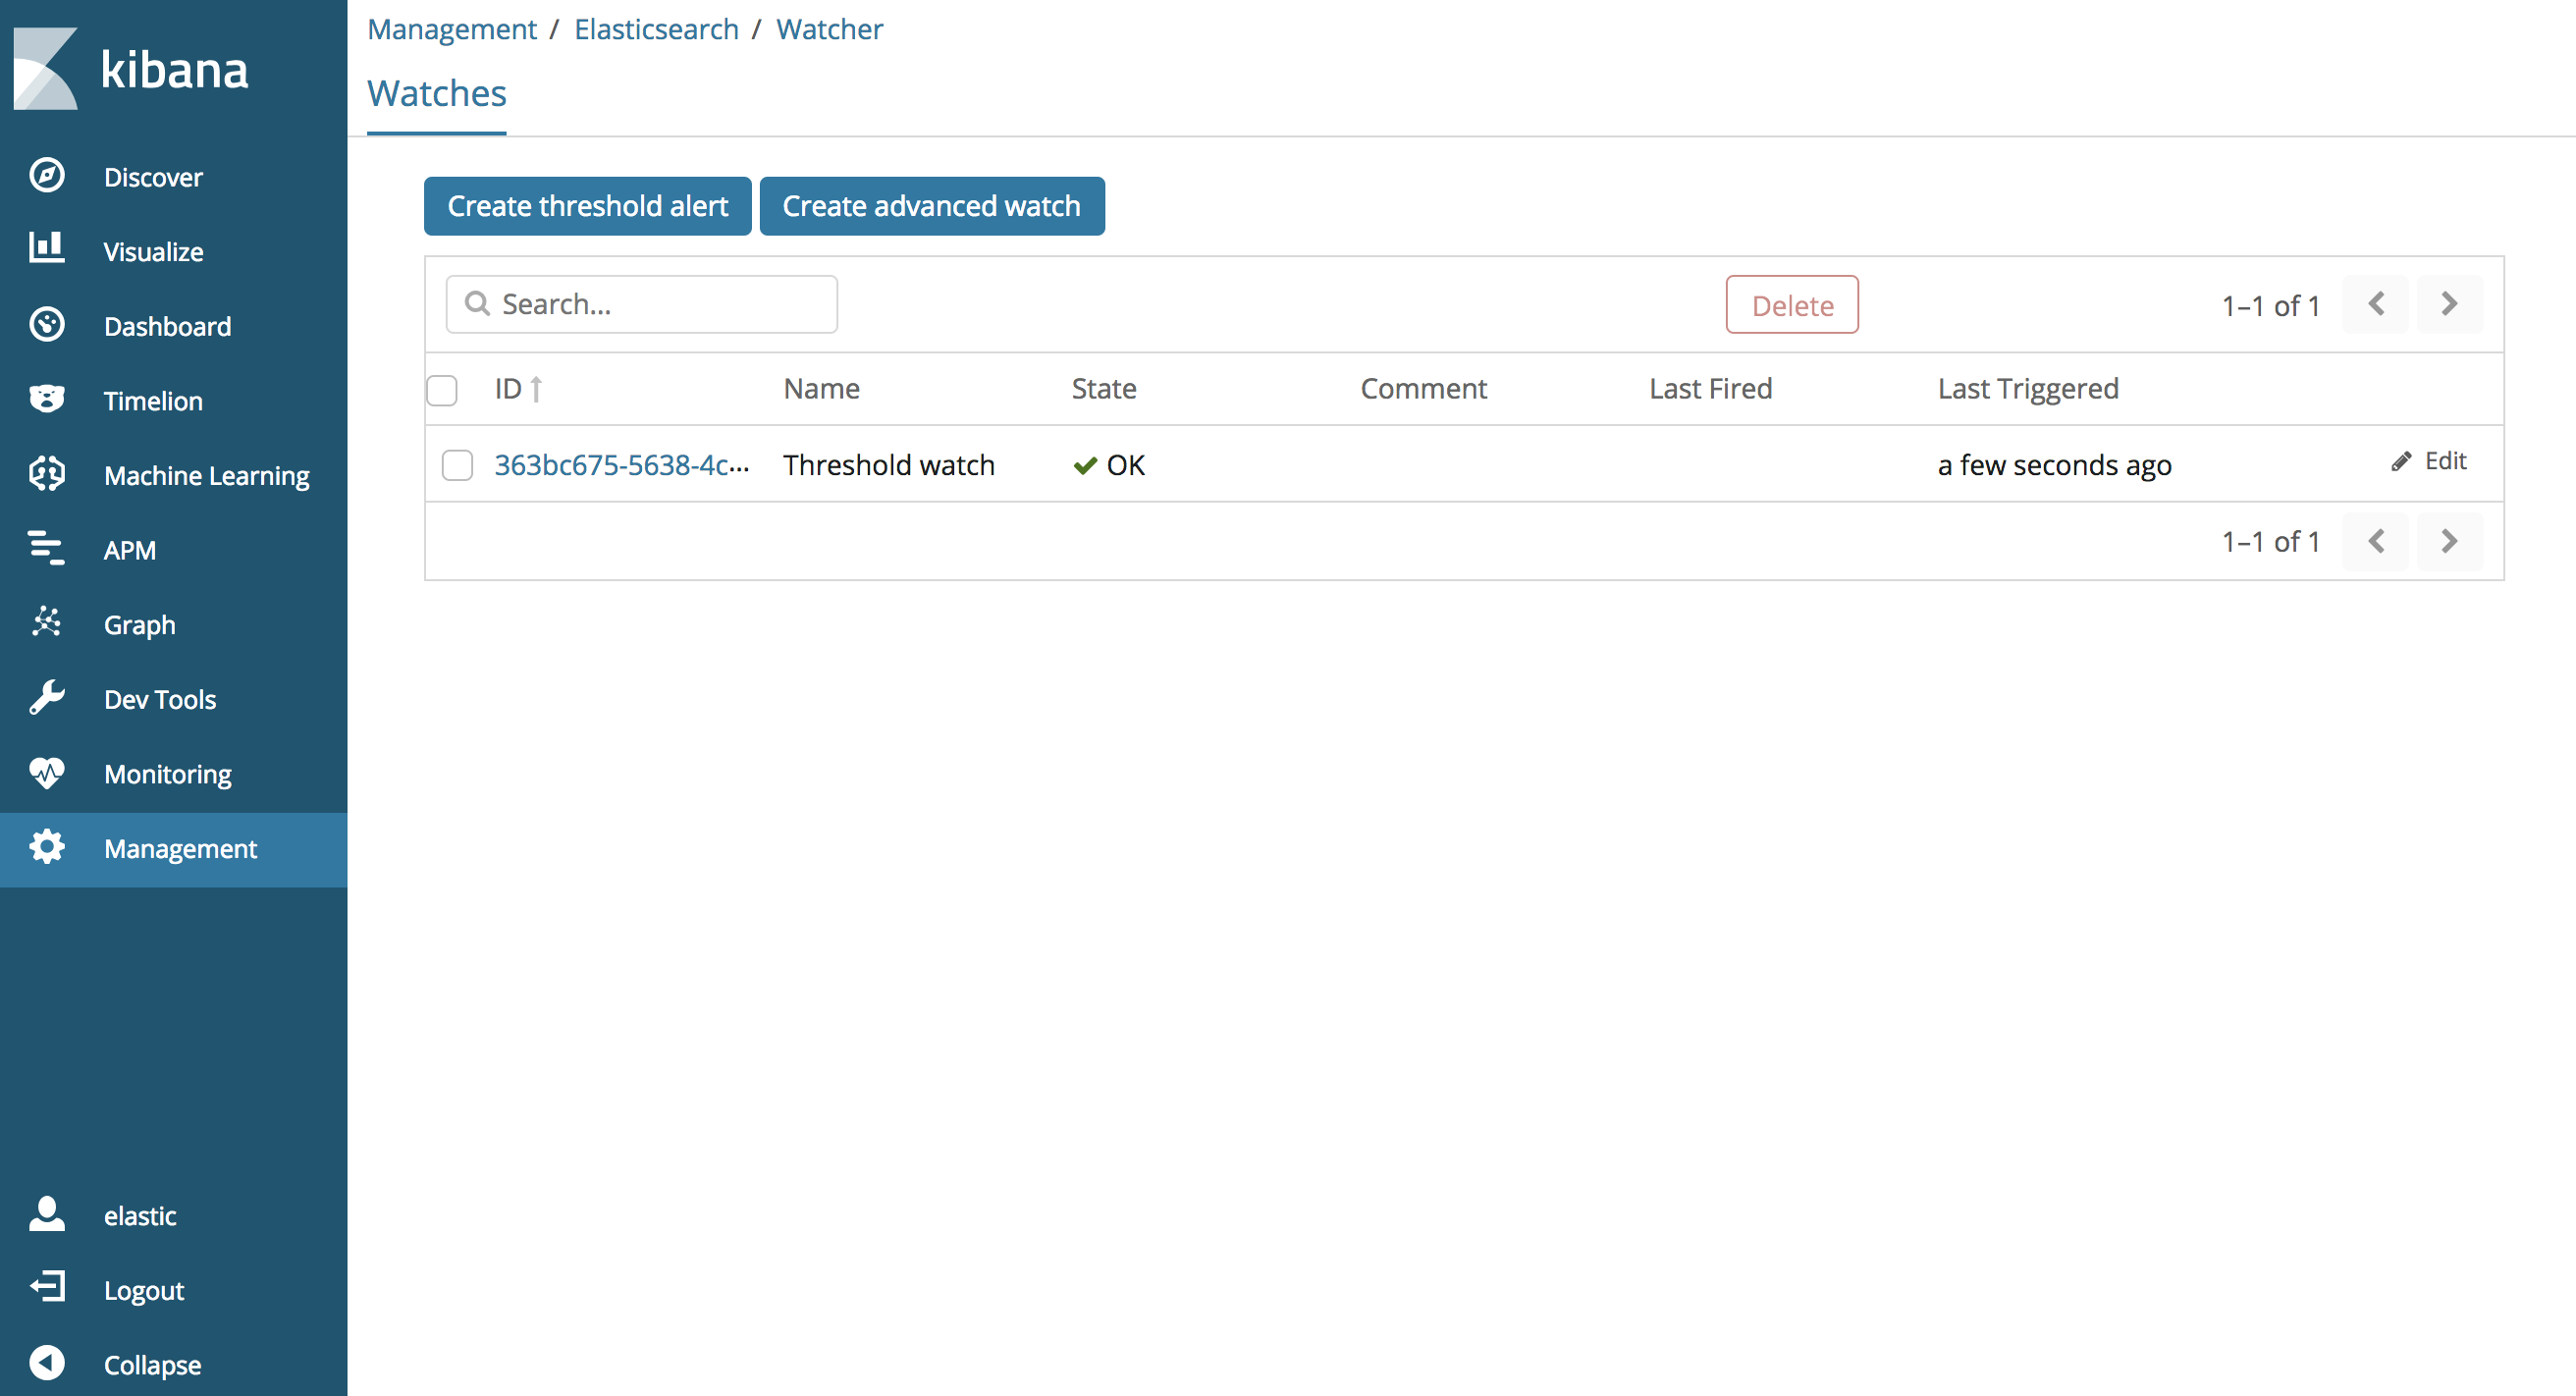

The watch list page within Watcher UI enables you to view all existing watches including stateful information about each watch. This includes State, Last Fired and Last Triggered.
The possible states for watches are:
-
Firing- The watch is currently triggered and is actively performing the associated actions. -
Error- The watch is an error state and not properly working. -
Ok- The watch is not actively firing but working properly. -
Disabled- The watch will not fire under any circumstance.
To delete or edit a watch, click on its checkbox in the list and then click the Delete or Edit button. Watches that do not have a checkbox are cluster alerts created by X-Pack monitoring and are immutable.
This page also allows you to create a threshold alert or an advanced watch. Let’s first look at creating a threshold alert.