IMPORTANT: No additional bug fixes or documentation updates
will be released for this version. For the latest information, see the
current release documentation.
Maps
edit
IMPORTANT: This documentation is no longer updated. Refer to Elastic's version policy and the latest documentation.
Maps
editThis functionality is in beta and is subject to change. The design and code is less mature than official GA features and is being provided as-is with no warranties. Beta features are not subject to the support SLA of official GA features.
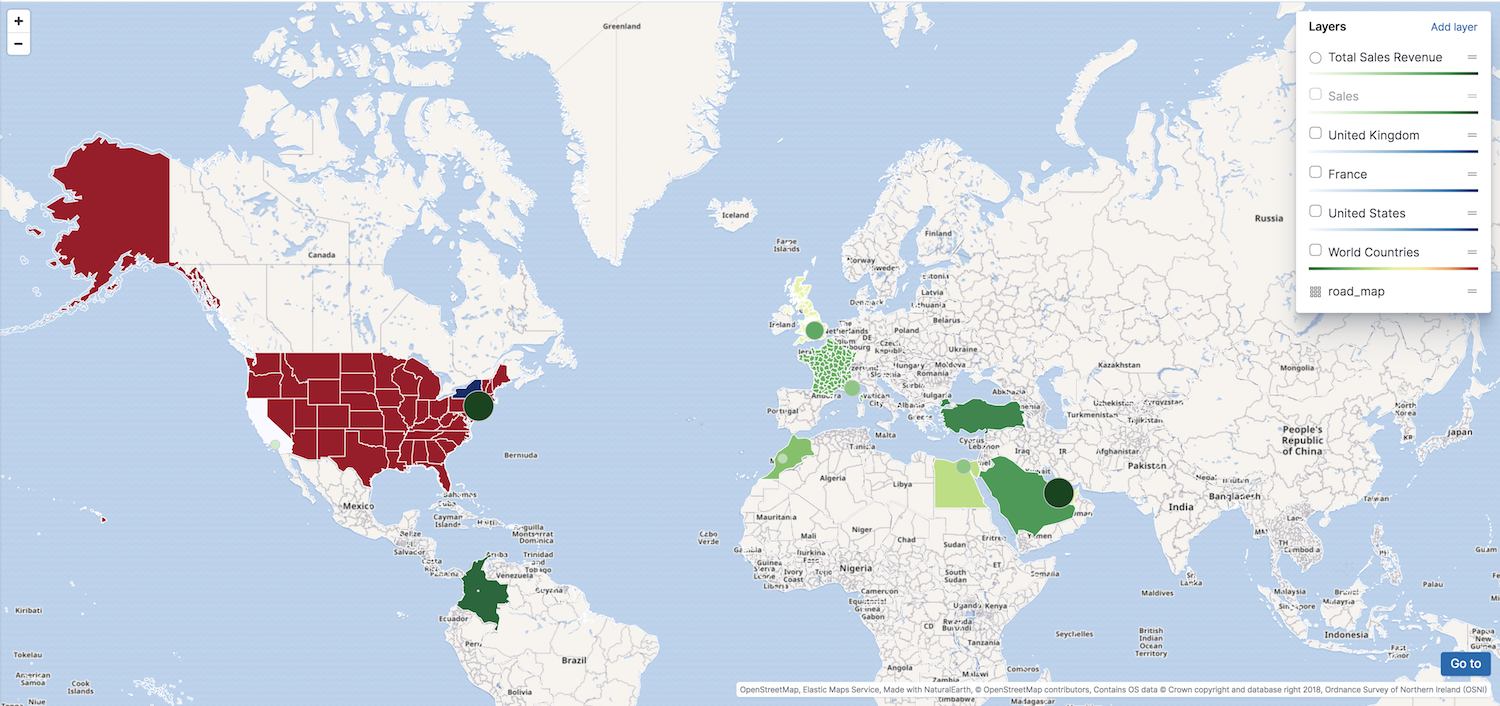
The Maps application enables you to parse through your geographical data at scale, with speed, and in real time. With features like multiple layers and indices in a map, plotting of raw documents, dynamic client-side styling, and global search across multiple layers, you can understand and monitor your data with ease.