- Kibana Guide: other versions:
- Introduction
- Get started
- Set Up Kibana
- Discover
- Visualize
- Creating a Visualization
- Saving Visualizations
- Using rolled up data in a visualization
- Line, Area, and Bar charts
- Controls Visualization
- Data Table
- Markdown Widget
- Metric
- Goal and Gauge
- Pie Charts
- Coordinate Maps
- Region Maps
- Timelion
- TSVB
- Tag Clouds
- Heatmap Chart
- Vega Graphs
- Inspecting Visualizations
- Dashboard
- Canvas
- Graph data connections
- Machine learning
- Maps
- Code
- Infrastructure
- Logs
- APM
- Uptime
- SIEM
- Dev Tools
- Stack Monitoring
- Management
- Reporting from Kibana
- REST API
- Kibana plugins
- Limitations
- Release Highlights
- Breaking Changes
- Release Notes
- Developer guide
IMPORTANT: No additional bug fixes or documentation updates
will be released for this version. For the latest information, see the
current release documentation.
Logs
edit
IMPORTANT: This documentation is no longer updated. Refer to Elastic's version policy and the latest documentation.
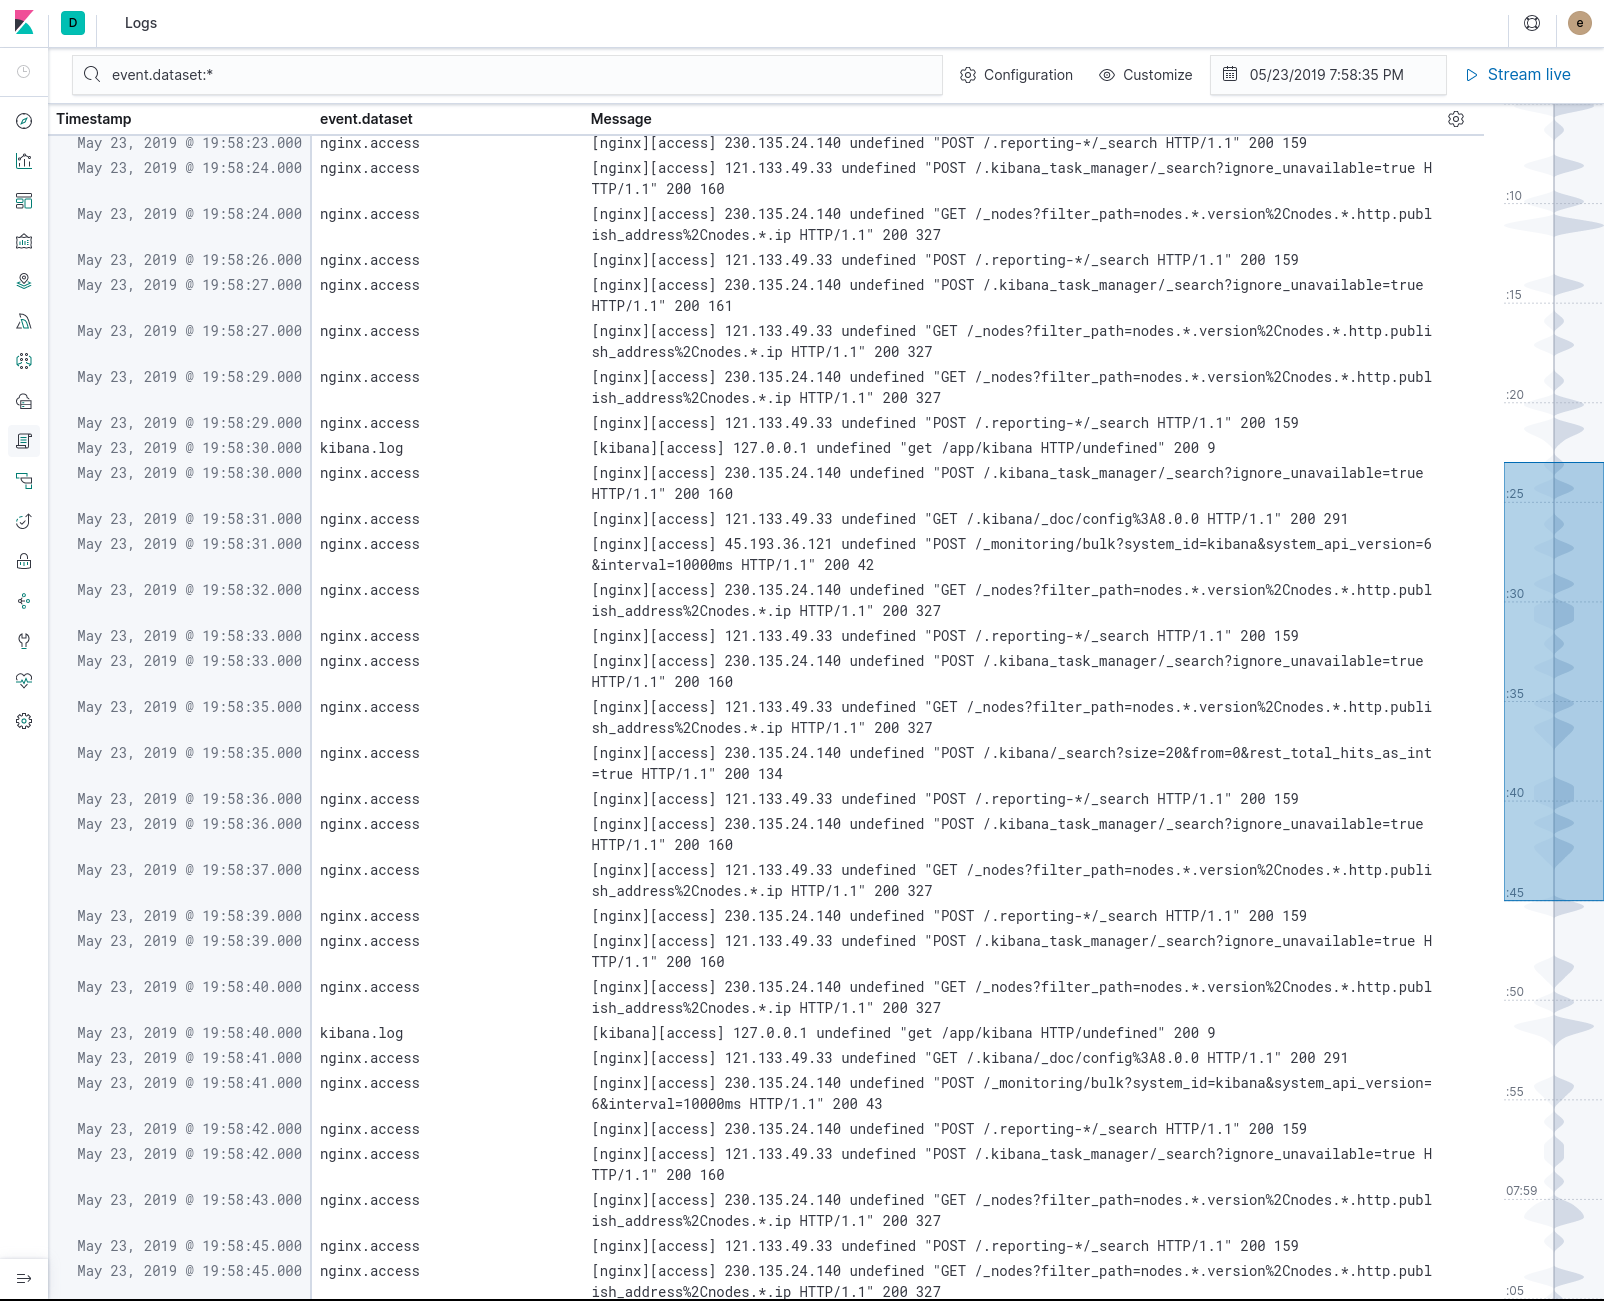
Logs
editUse the Logs UI to explore logs for common servers, containers, and services. Kibana provides a compact, console-like display that you can customize.

Was this helpful?
Thank you for your feedback.