- Kibana Guide: other versions:
- Introduction
- Get started
- Set Up Kibana
- Discover
- Visualize
- Creating a Visualization
- Saving Visualizations
- Using rolled up data in a visualization
- Line, Area, and Bar charts
- Controls Visualization
- Data Table
- Markdown Widget
- Metric
- Goal and Gauge
- Pie Charts
- Coordinate Maps
- Region Maps
- Timelion
- TSVB
- Tag Clouds
- Heatmap Chart
- Vega Graphs
- Inspecting Visualizations
- Dashboard
- Canvas
- Graph data connections
- Machine learning
- Maps
- Code
- Infrastructure
- Logs
- APM
- Uptime
- SIEM
- Dev Tools
- Stack Monitoring
- Management
- Reporting from Kibana
- REST API
- Kibana plugins
- Limitations
- Release Highlights
- Breaking Changes
- Release Notes
- Developer guide
IMPORTANT: No additional bug fixes or documentation updates
will be released for this version. For the latest information, see the
current release documentation.
Kibana Monitoring Metrics
editKibana Monitoring Metrics
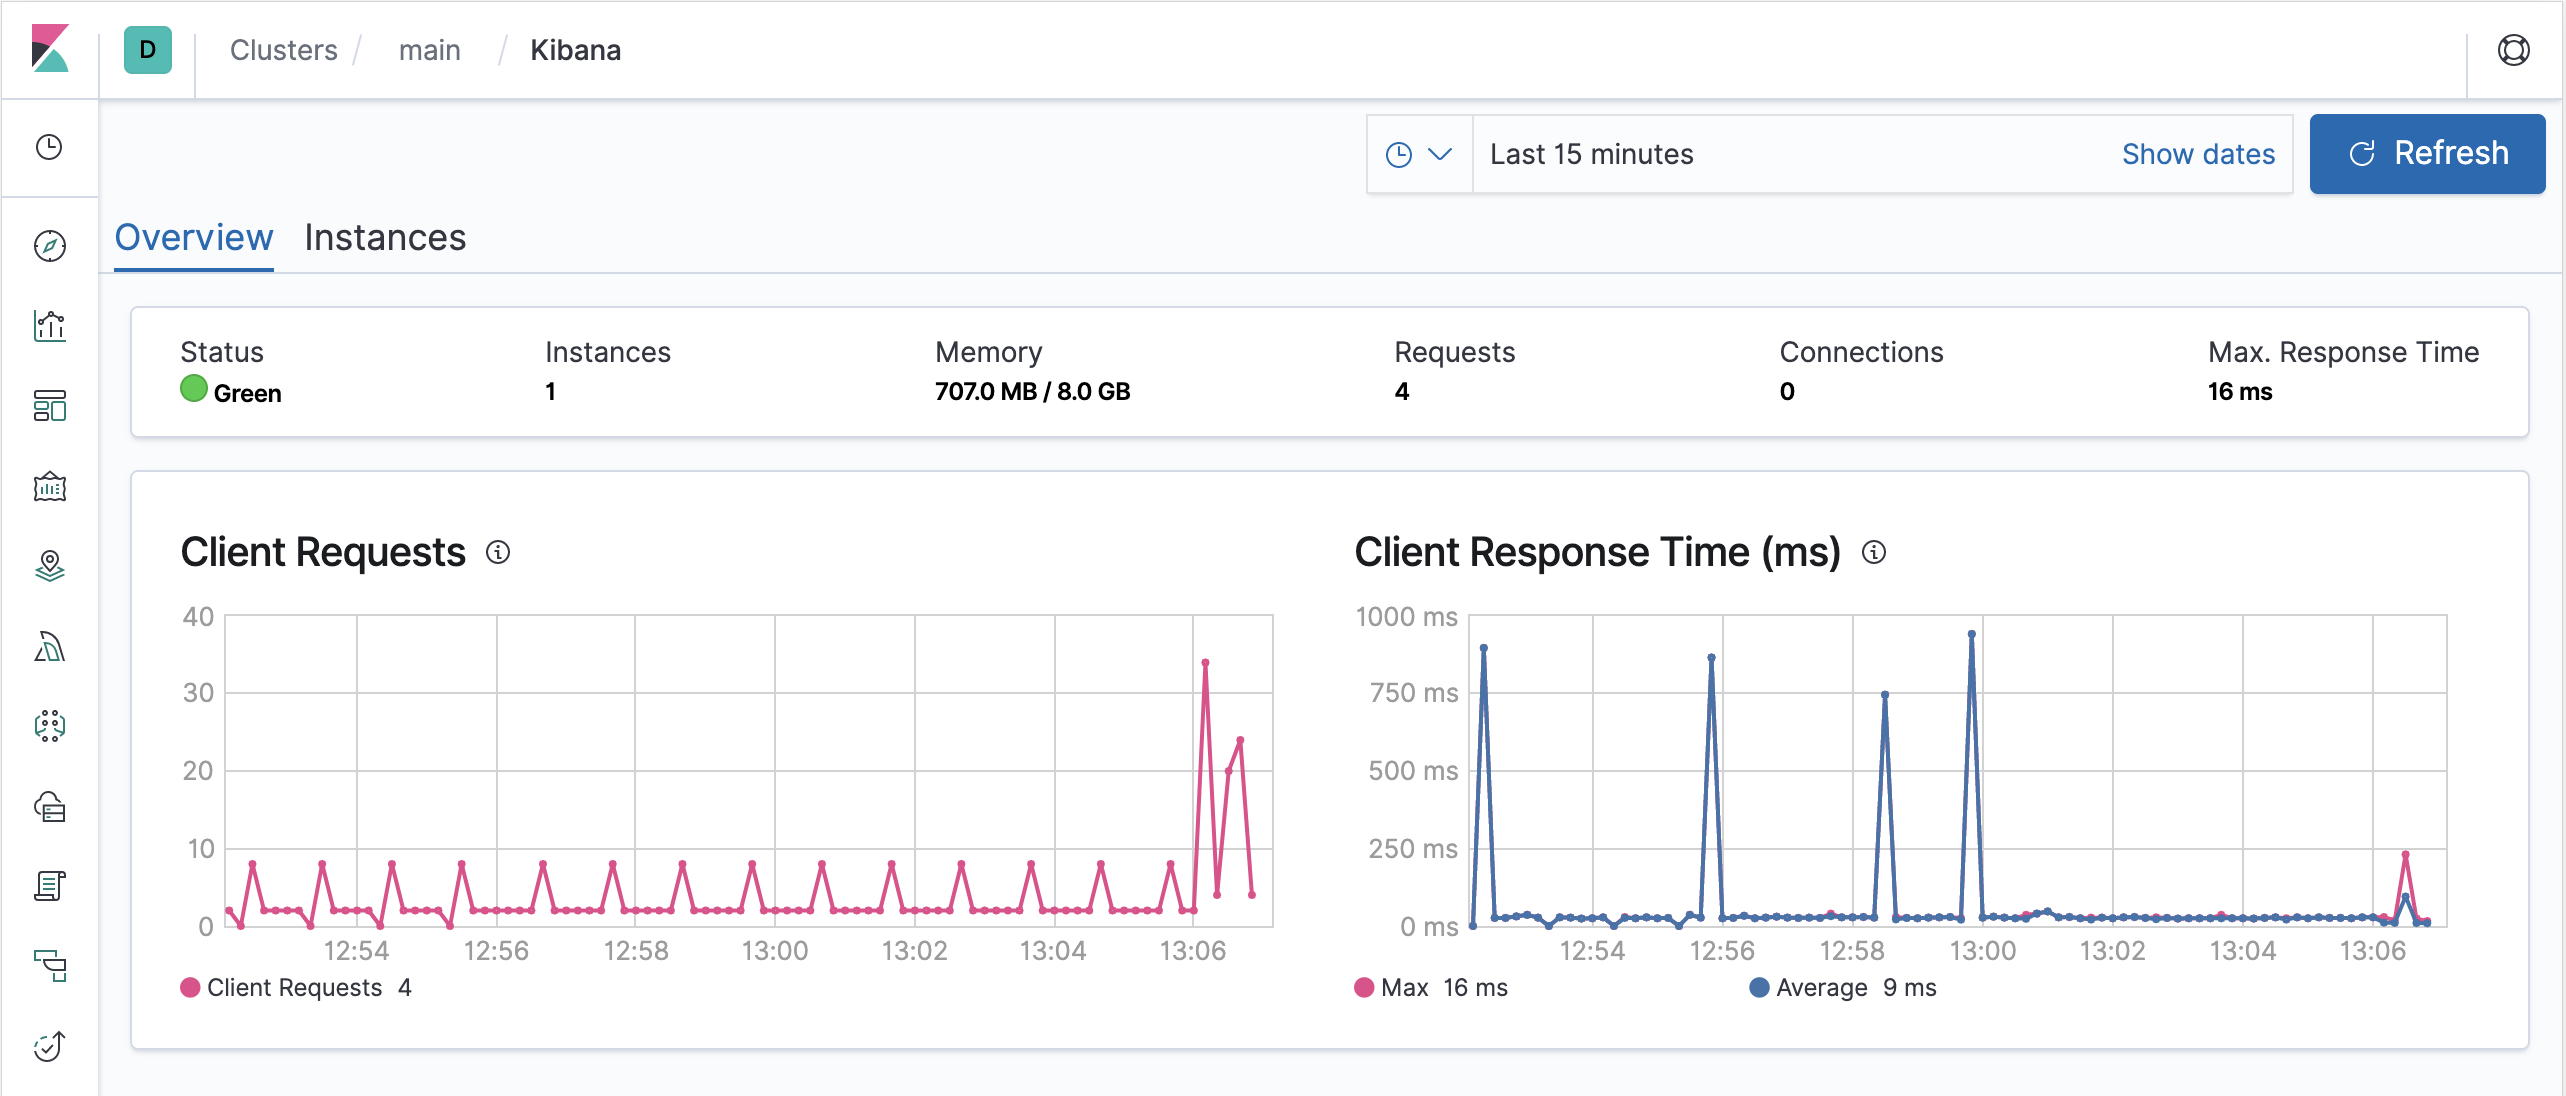
editTo view the key metrics that indicate the overall health of Kibana itself, click Overview in the Kibana section of the Stack Monitoring page.
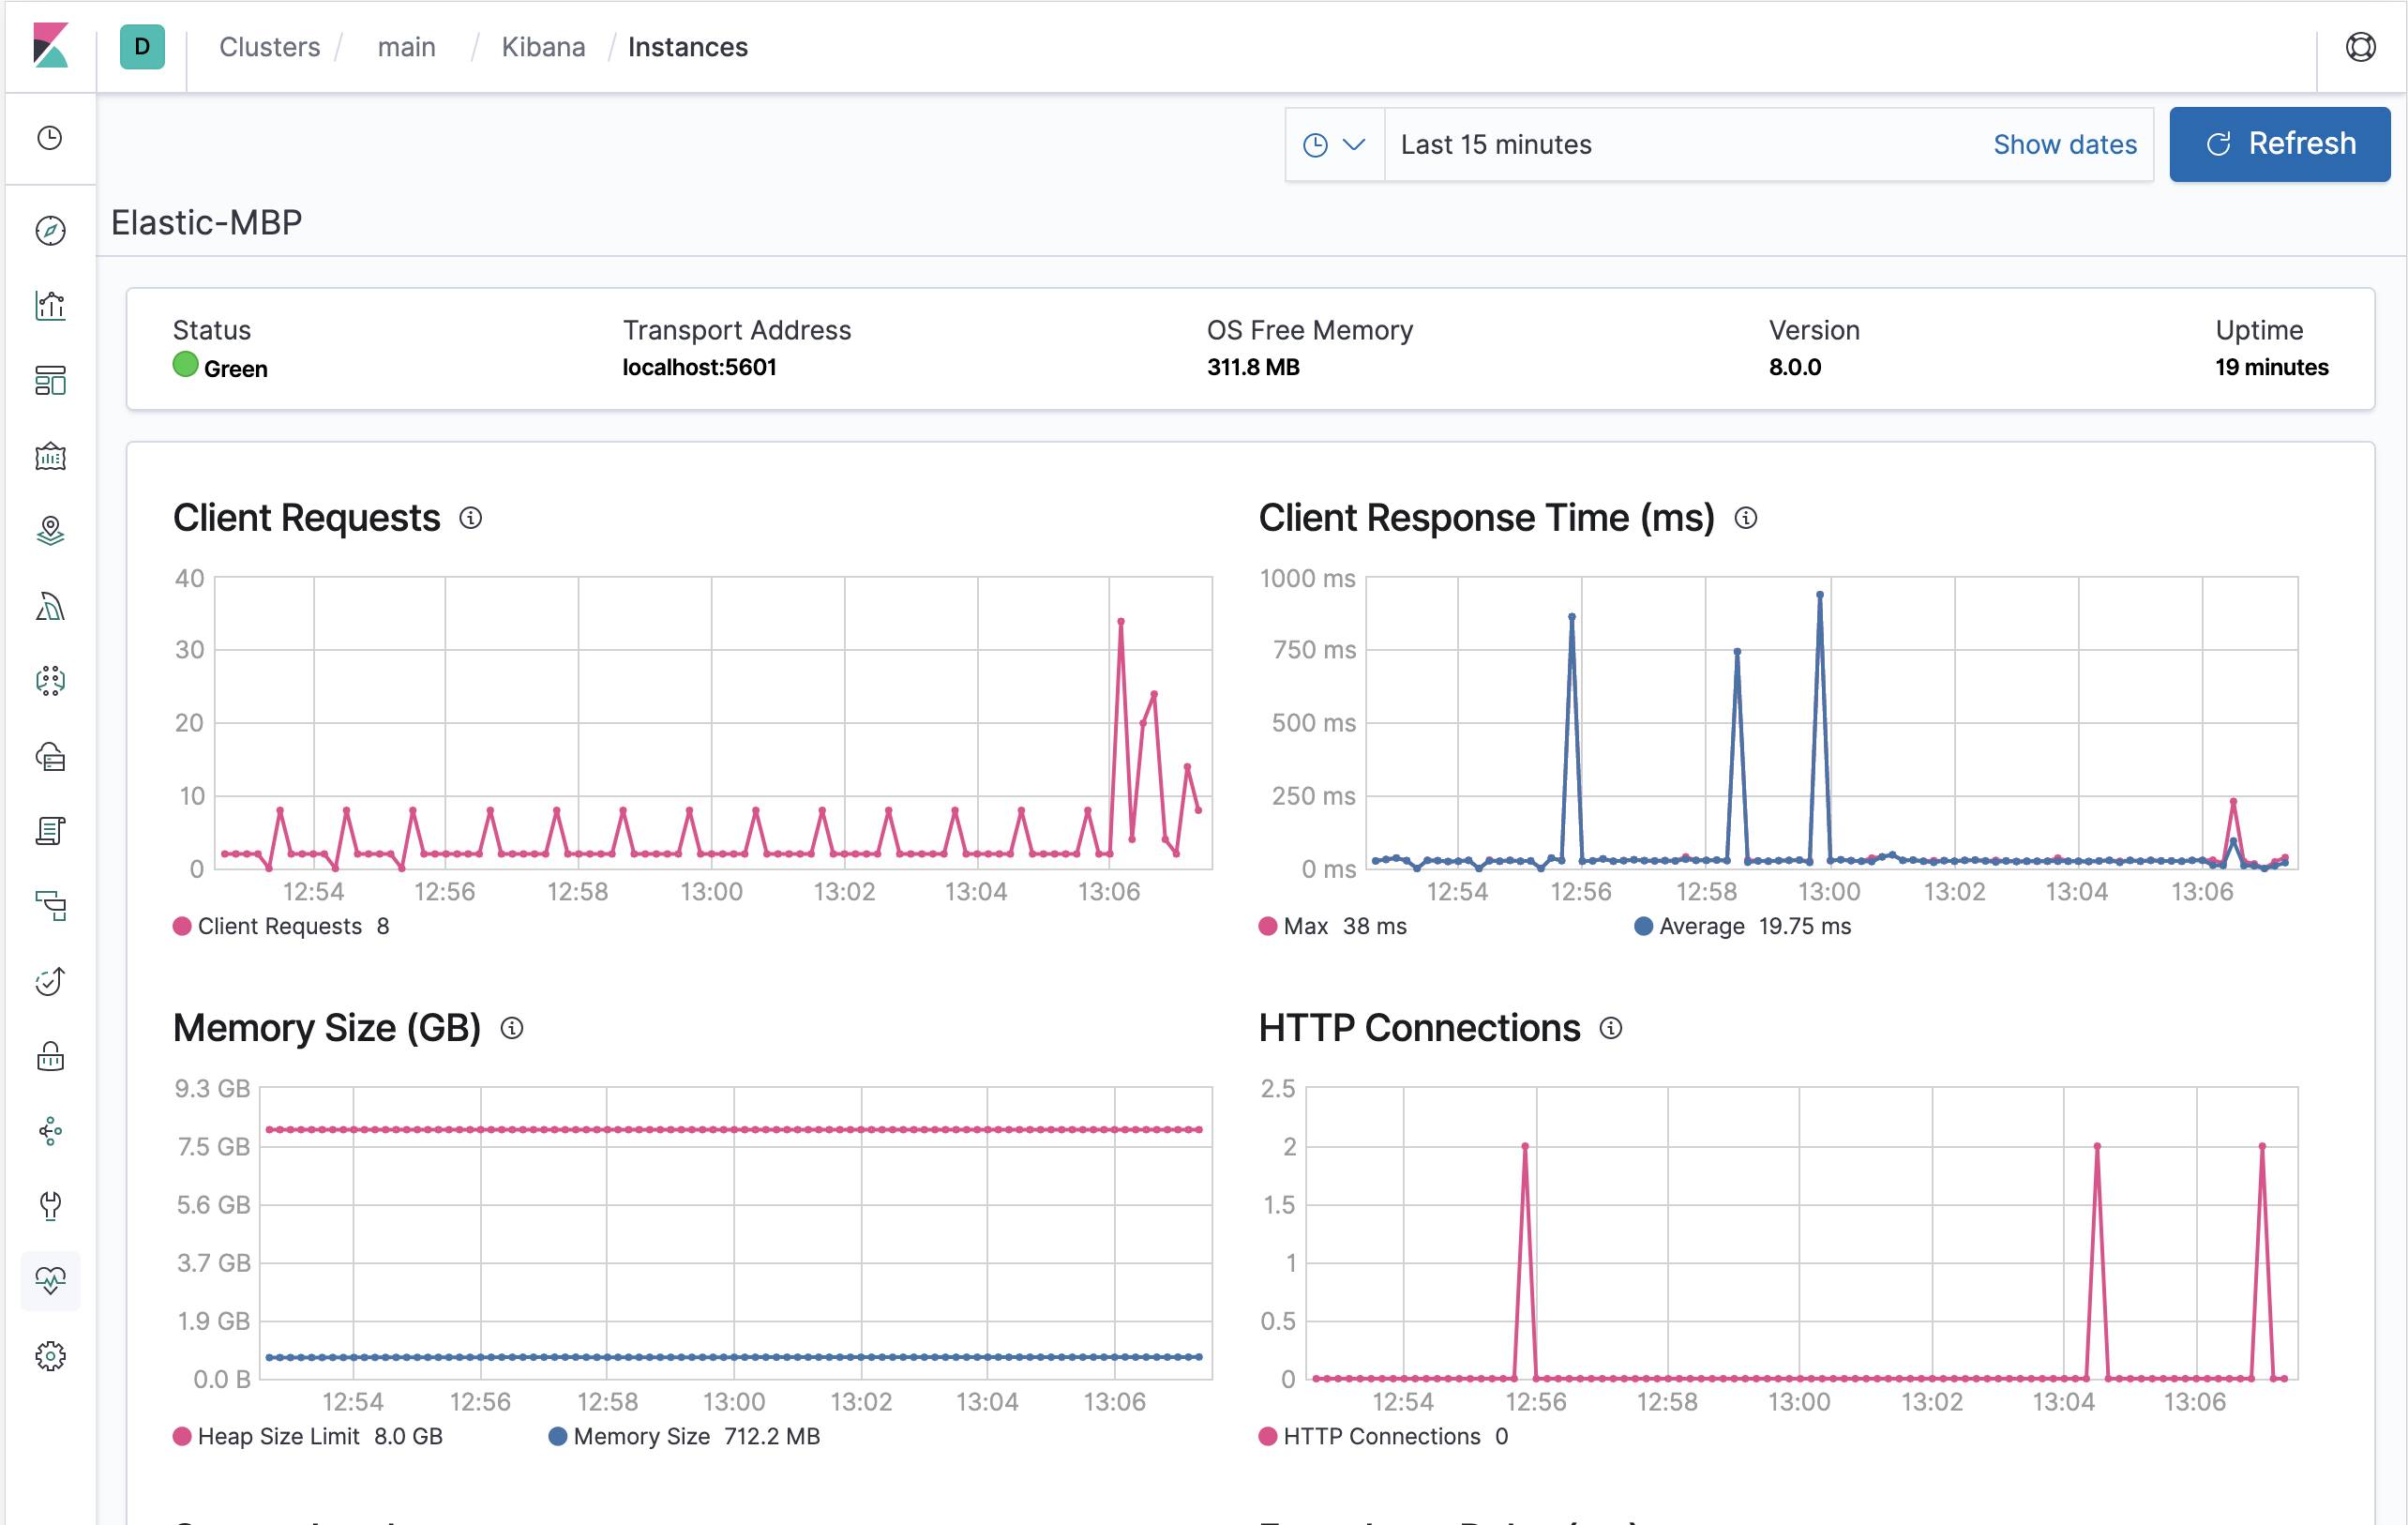
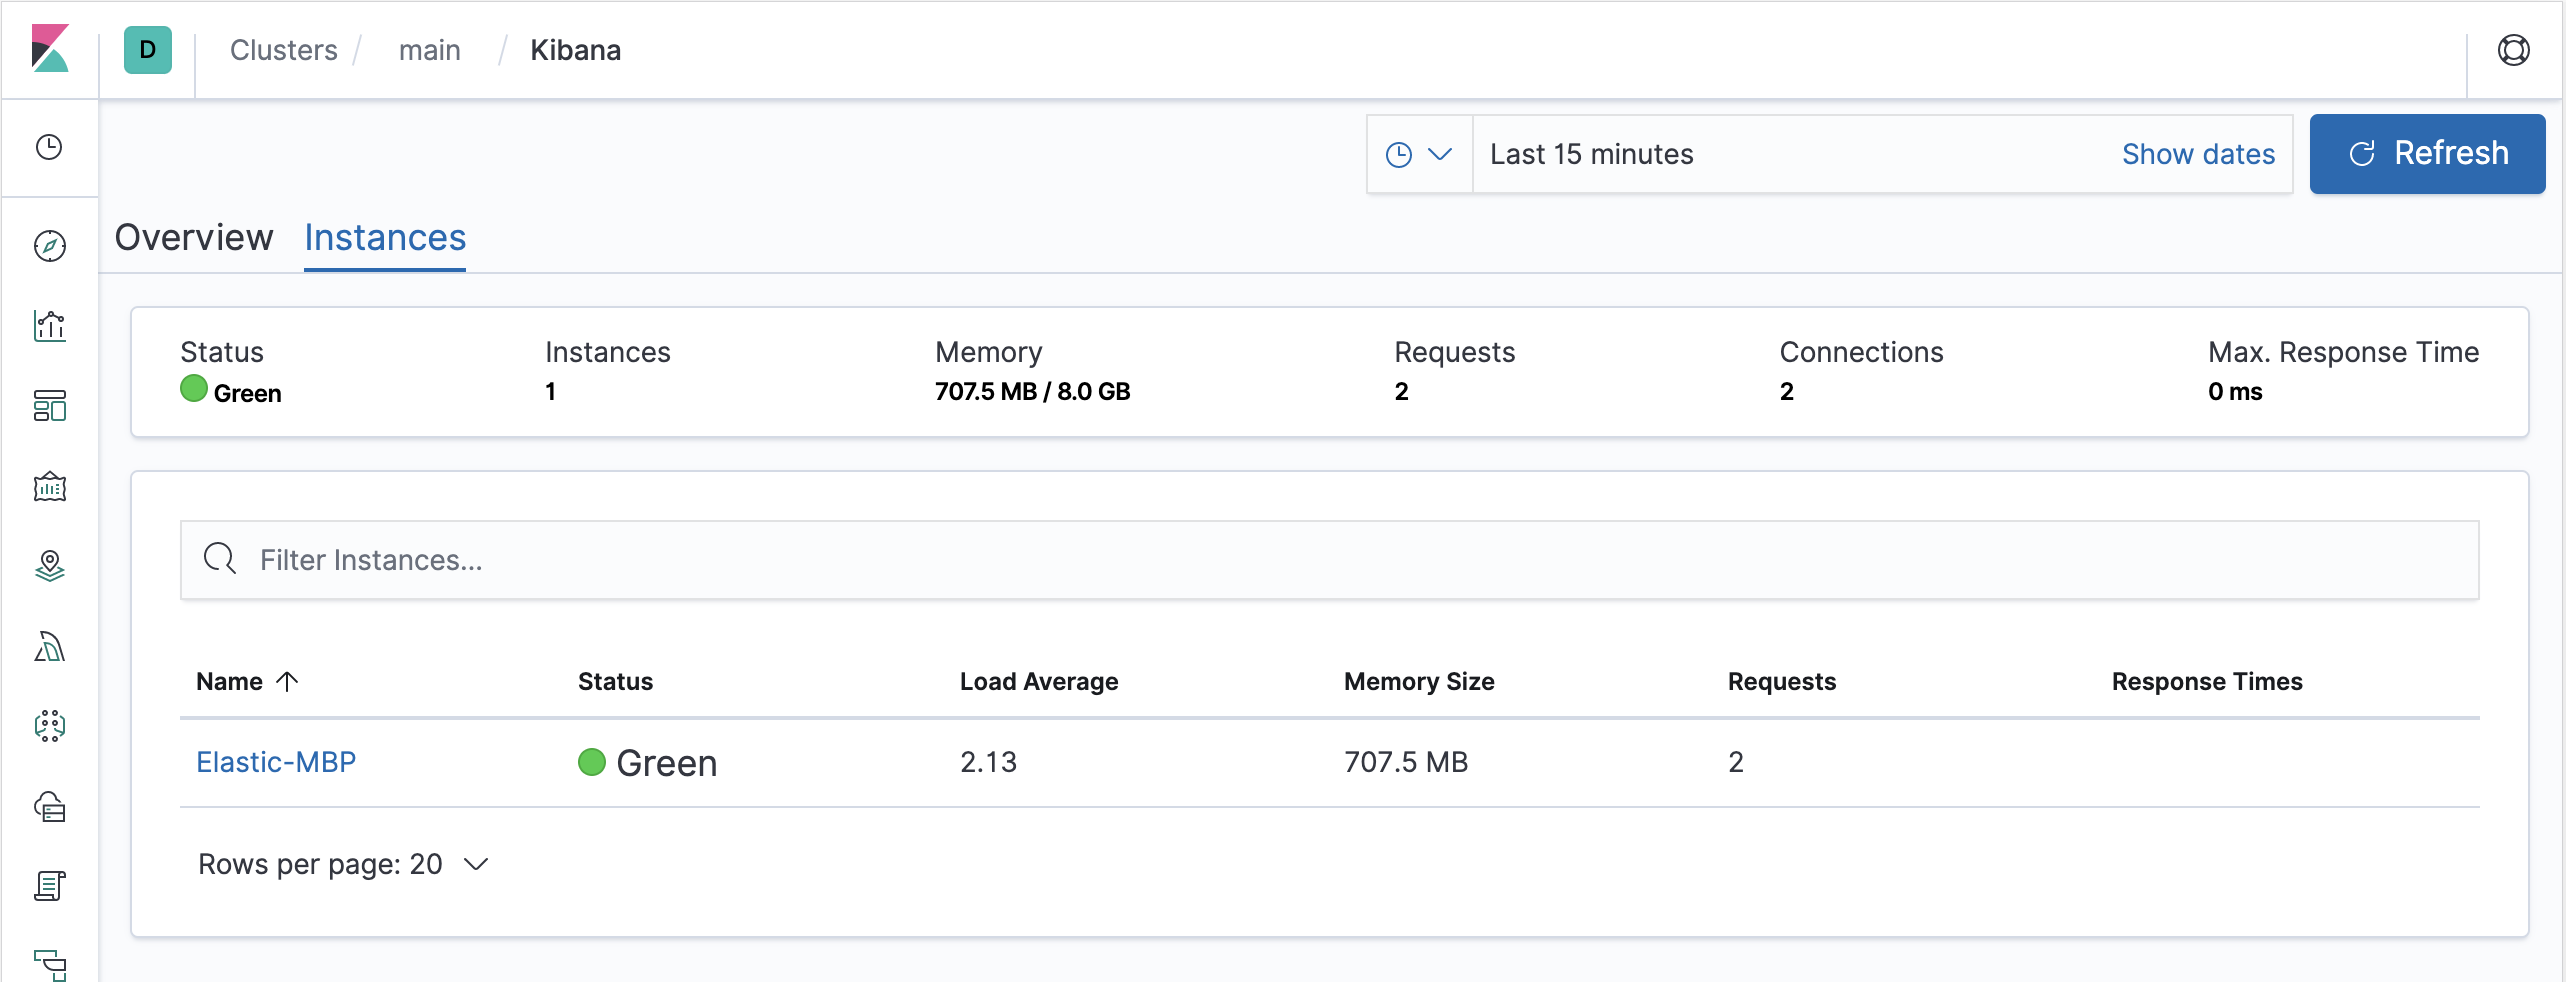
To view Kibana instance metrics, click Instances. The Instances section shows the status of each Kibana instance.
Click the name of an instance to view its instance statistics over time.
Was this helpful?
Thank you for your feedback.