- Kibana Guide: other versions:
- What is Kibana?
- What’s new in 7.12
- Kibana concepts
- Quick start
- Set up
- Install Kibana
- Configure Kibana
- Alerting and action settings
- APM settings
- Banners settings
- Development tools settings
- Graph settings
- Fleet settings
- i18n settings
- Logs settings
- Metrics settings
- Machine learning settings
- Monitoring settings
- Reporting settings
- Secure settings
- Search sessions settings
- Security settings
- Spaces settings
- Task Manager settings
- Telemetry settings
- Start and stop Kibana
- Access Kibana
- Securing access to Kibana
- Add data
- Upgrade Kibana
- Embed Kibana content in a web page
- Configure monitoring
- Configure security
- Production considerations
- Discover
- Dashboard
- Canvas
- Maps
- Machine learning
- Graph
- Observability
- APM
- Elastic Security
- Dev Tools
- Stack Monitoring
- Stack Management
- Fleet
- Reporting
- Alerting and Actions
- REST API
- Kibana plugins
- Accessibility
- Release notes
- Developer guide
Traces
editTraces
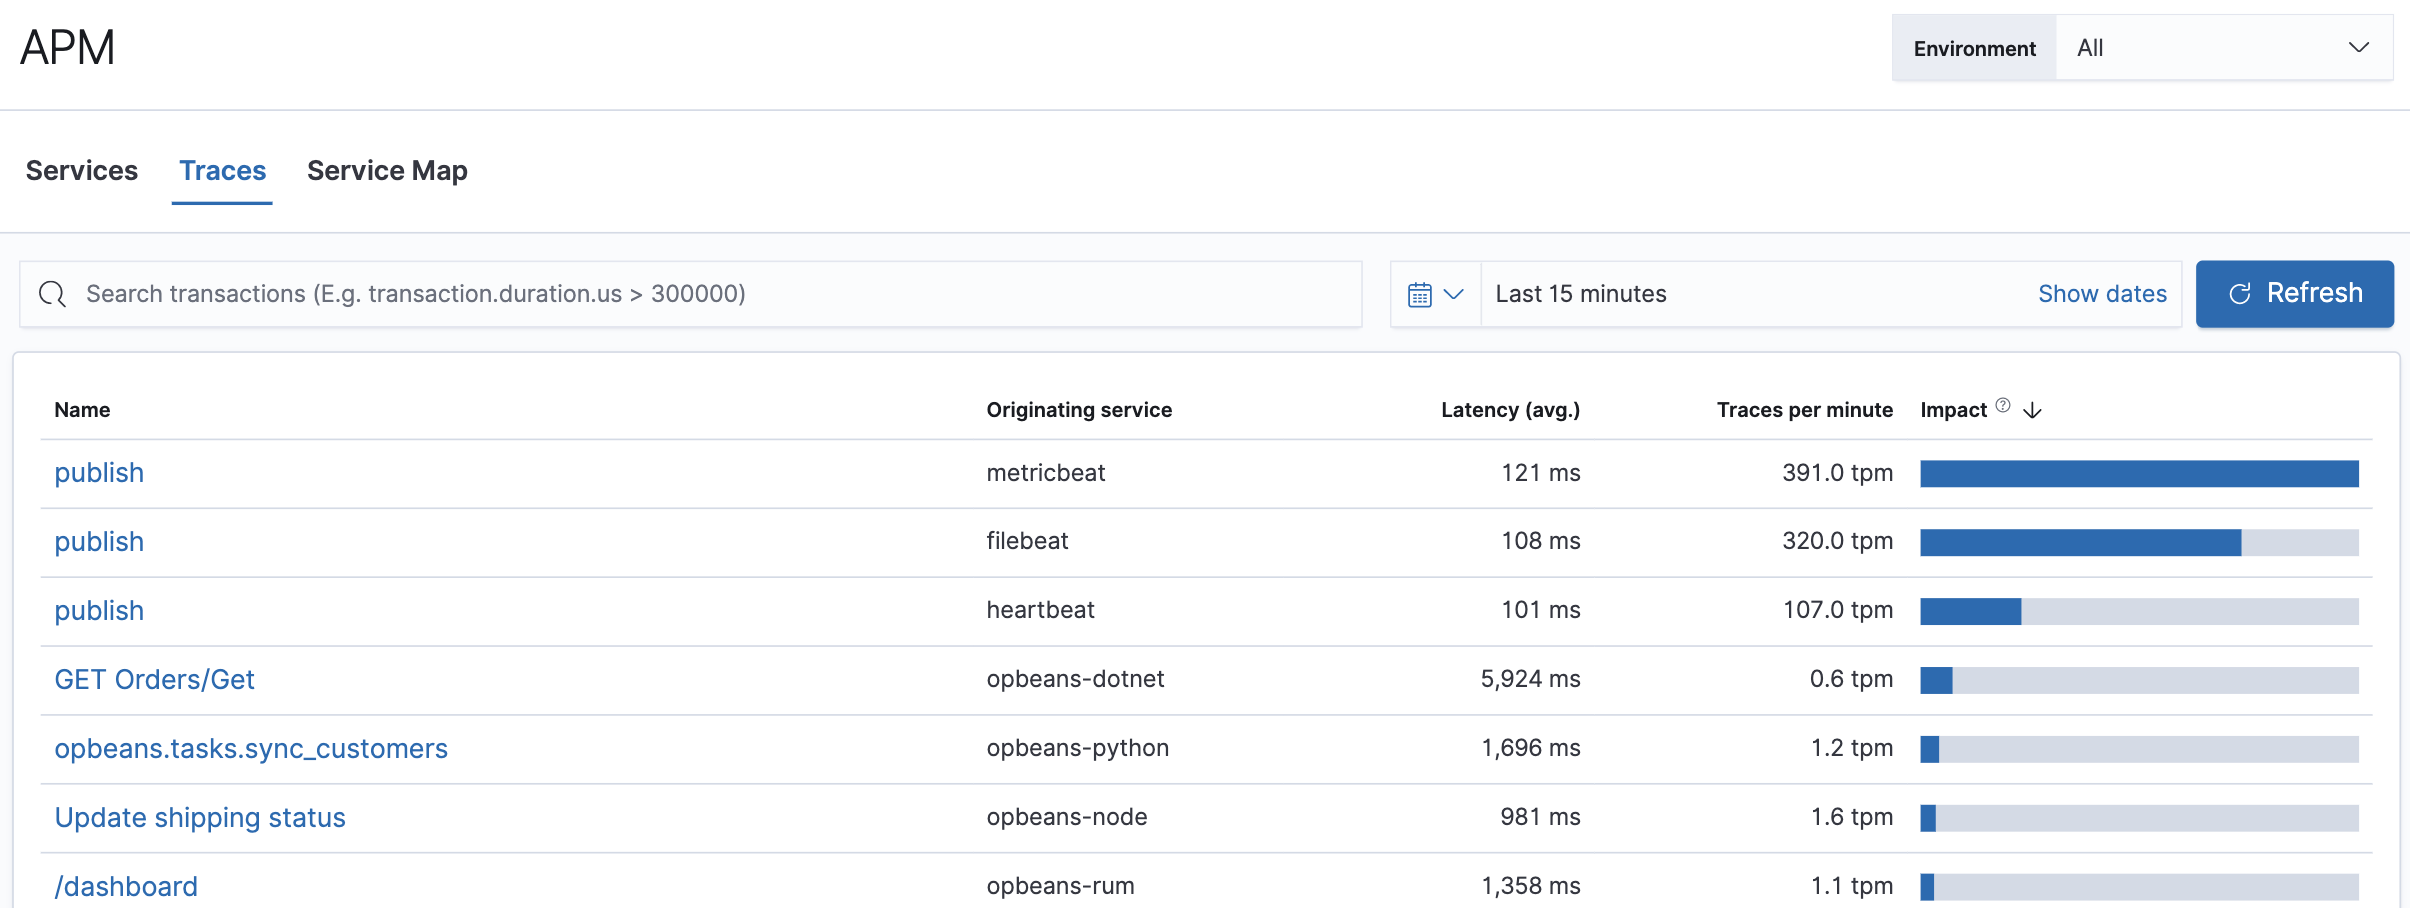
editTraces link together related transactions to show an end-to-end performance of how a request was served and which services were part of it. In addition to the Traces overview, you can view your application traces in the trace sample timeline waterfall.
Traces displays your application’s entry transactions. Transactions with the same name are grouped together and only shown once in this table. If you’re using distributed tracing, this view is key to finding the critical paths within your application.
By default, transactions are sorted by Impact. Impact helps show the most used and slowest endpoints in your service — in other words, it’s the collective amount of pain a specific endpoint is causing your users. If there’s a particular endpoint you’re worried about, select it to view its transaction details.
