IMPORTANT: No additional bug fixes or documentation updates
will be released for this version. For the latest information, see the
current release documentation.
Set the time range
edit
IMPORTANT: This documentation is no longer updated. Refer to Elastic's version policy and the latest documentation.
Set the time range
editDisplay data within a specified time range when your index contains time-based events, and a time-field is configured for the selected index pattern. The default time range is 15 minutes, but you can customize it in Advanced Settings.
-
Click
 .
.
-
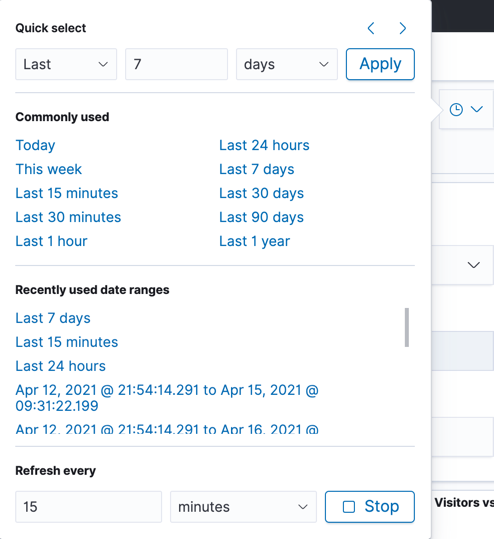
Choose one of the following:
- Quick select to use a recent time range, then use the back and forward arrows to move through the time ranges.
- Commonly used to use a time range from options such as Last 15 minutes, Today, and Week to date.
- Recently used date ranges to use a previously selected data range.
-
Refresh every to specify an automatic refresh rate.
-
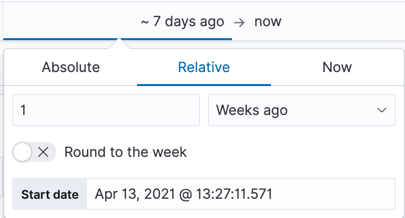
To set start and end times, click the bar next to the time filter. In the popup, select Absolute, Relative or Now, then specify the required options.