Observability
editObservability
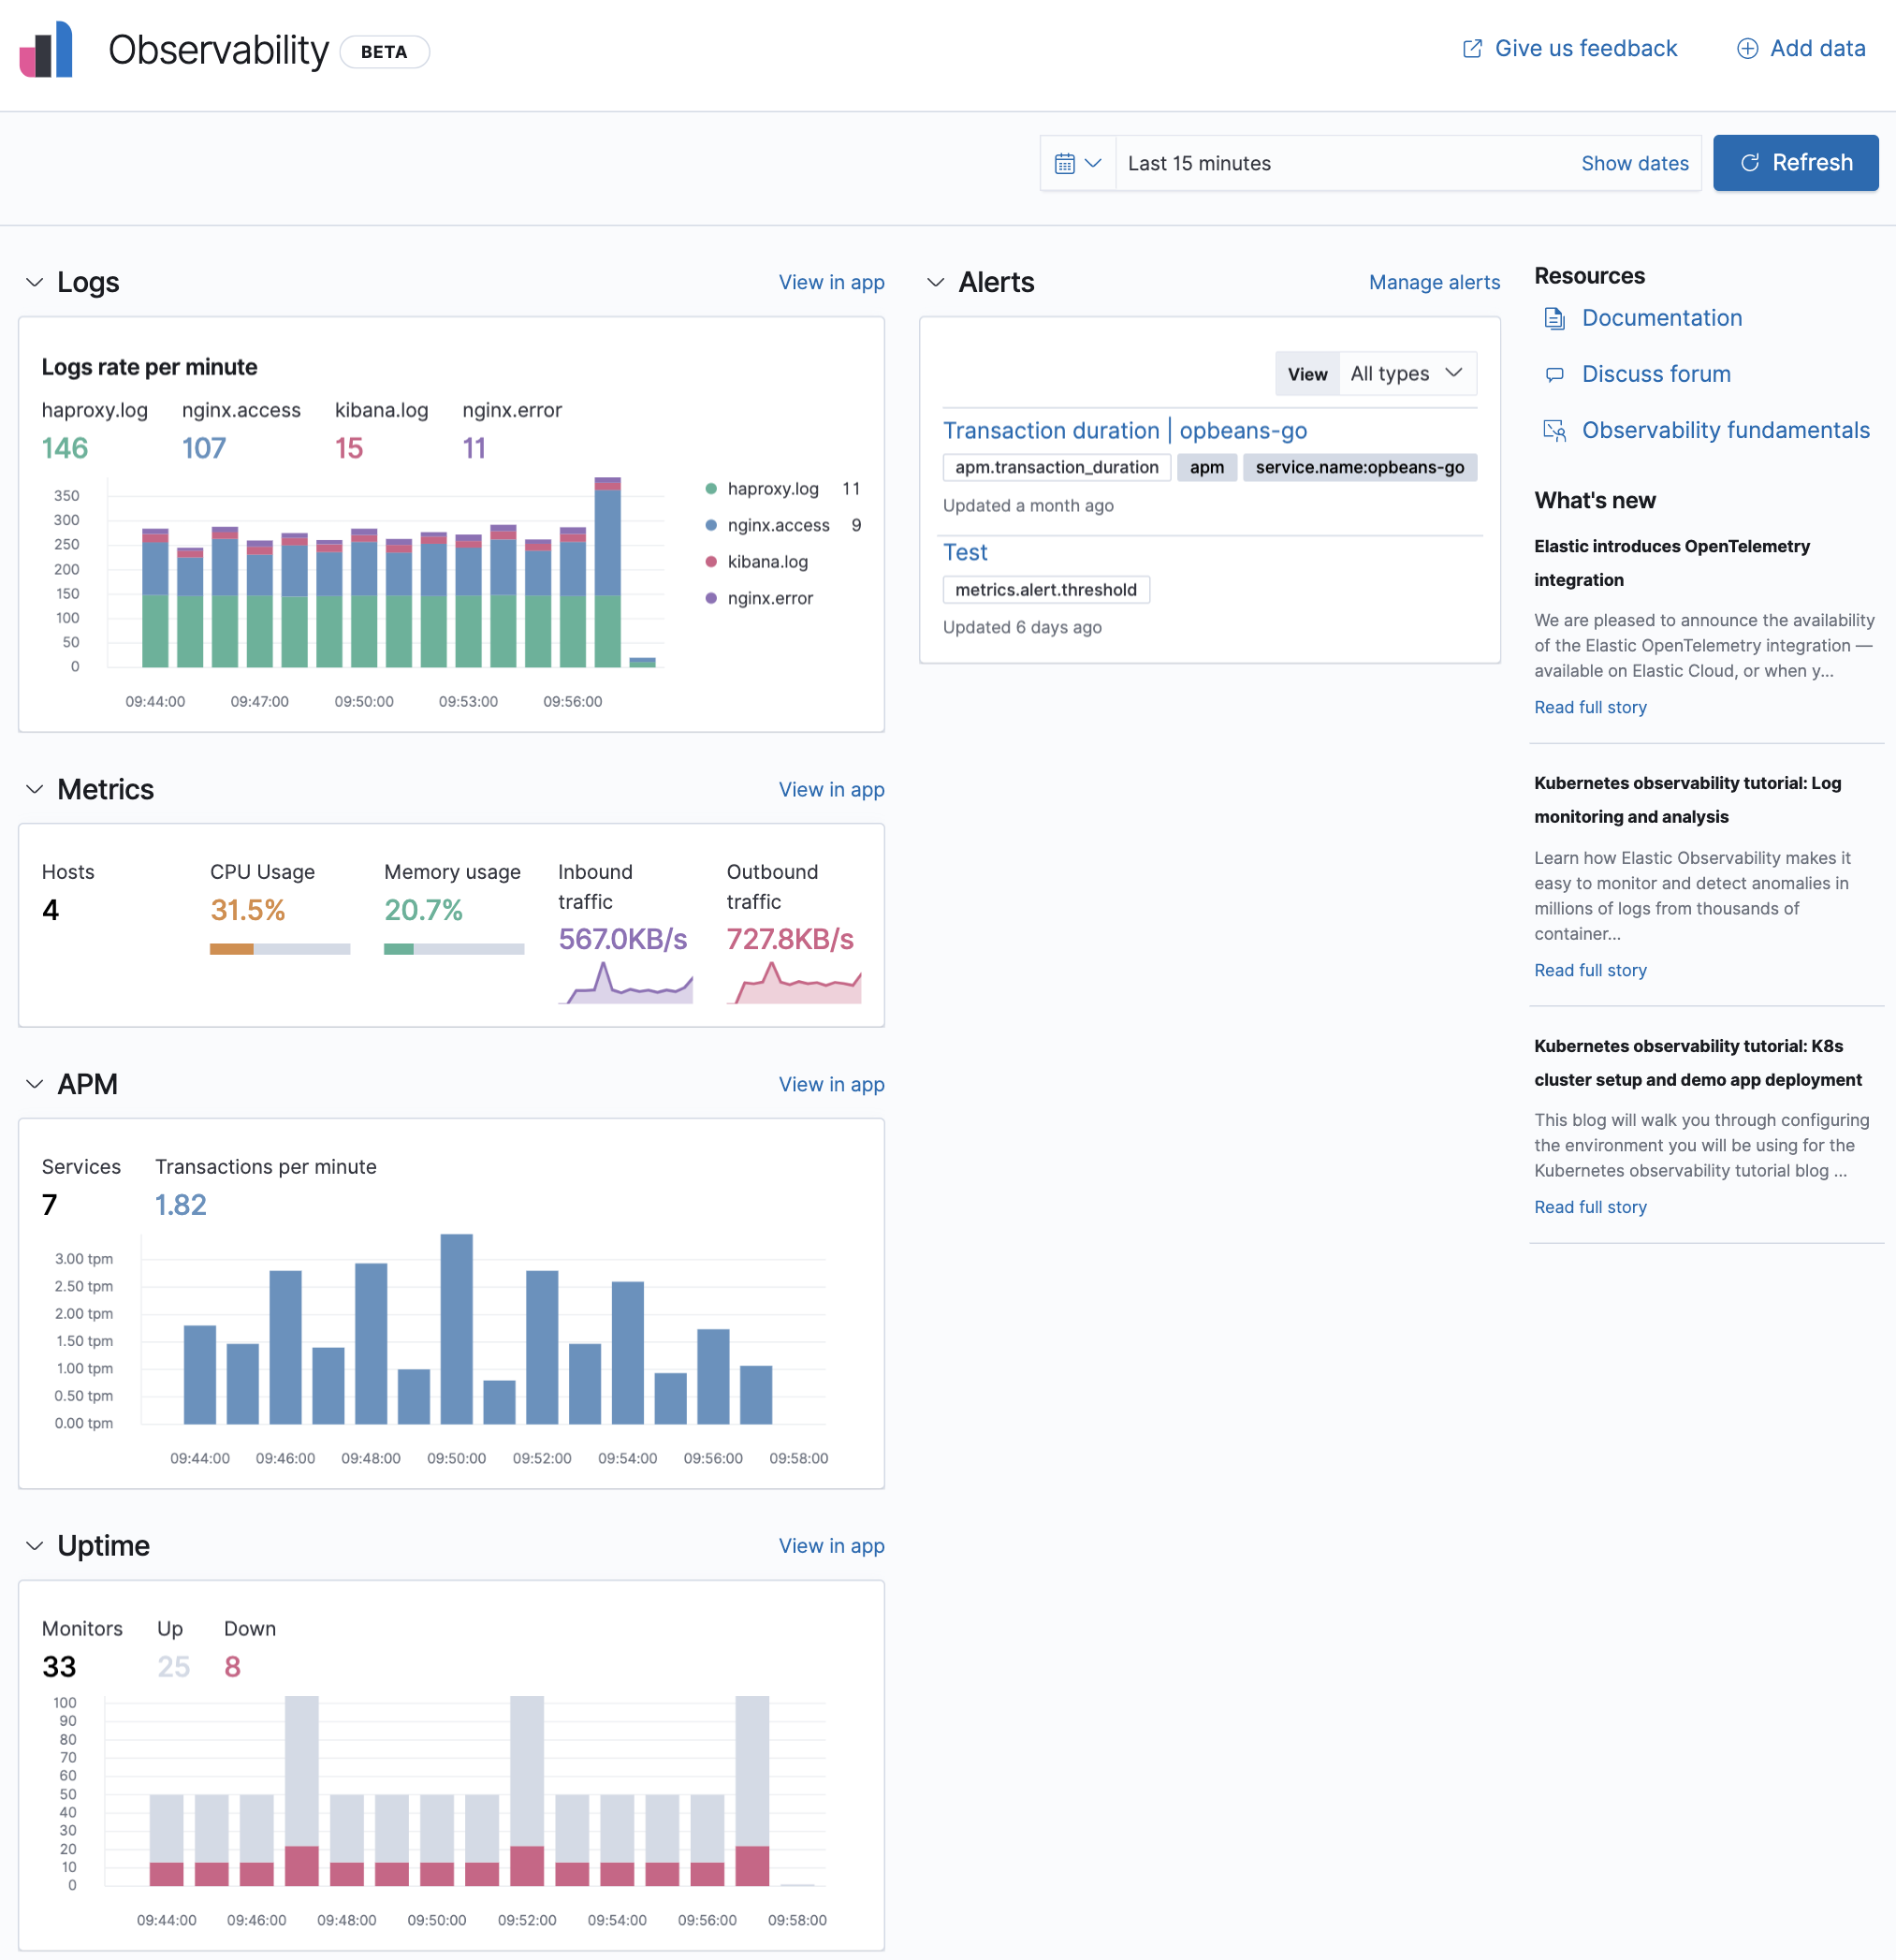
editObservability enables you to add and monitor your logs, system metrics, uptime data, and application traces, as a single stack.
With Observability, you have:
- A central place to add and configure your data sources.
- A variety of charts displaying analytics relating to each data source.
- View in app options to drill down and analyze data in the Logs, Metrics, Uptime, and APM apps.
- An alerts chart to keep you informed of any issues that you may need to resolve quickly.
Kibana provides step-by-step instructions to help you add and configure your data sources. The Observability Guide is a good source for more detailed information and instructions.
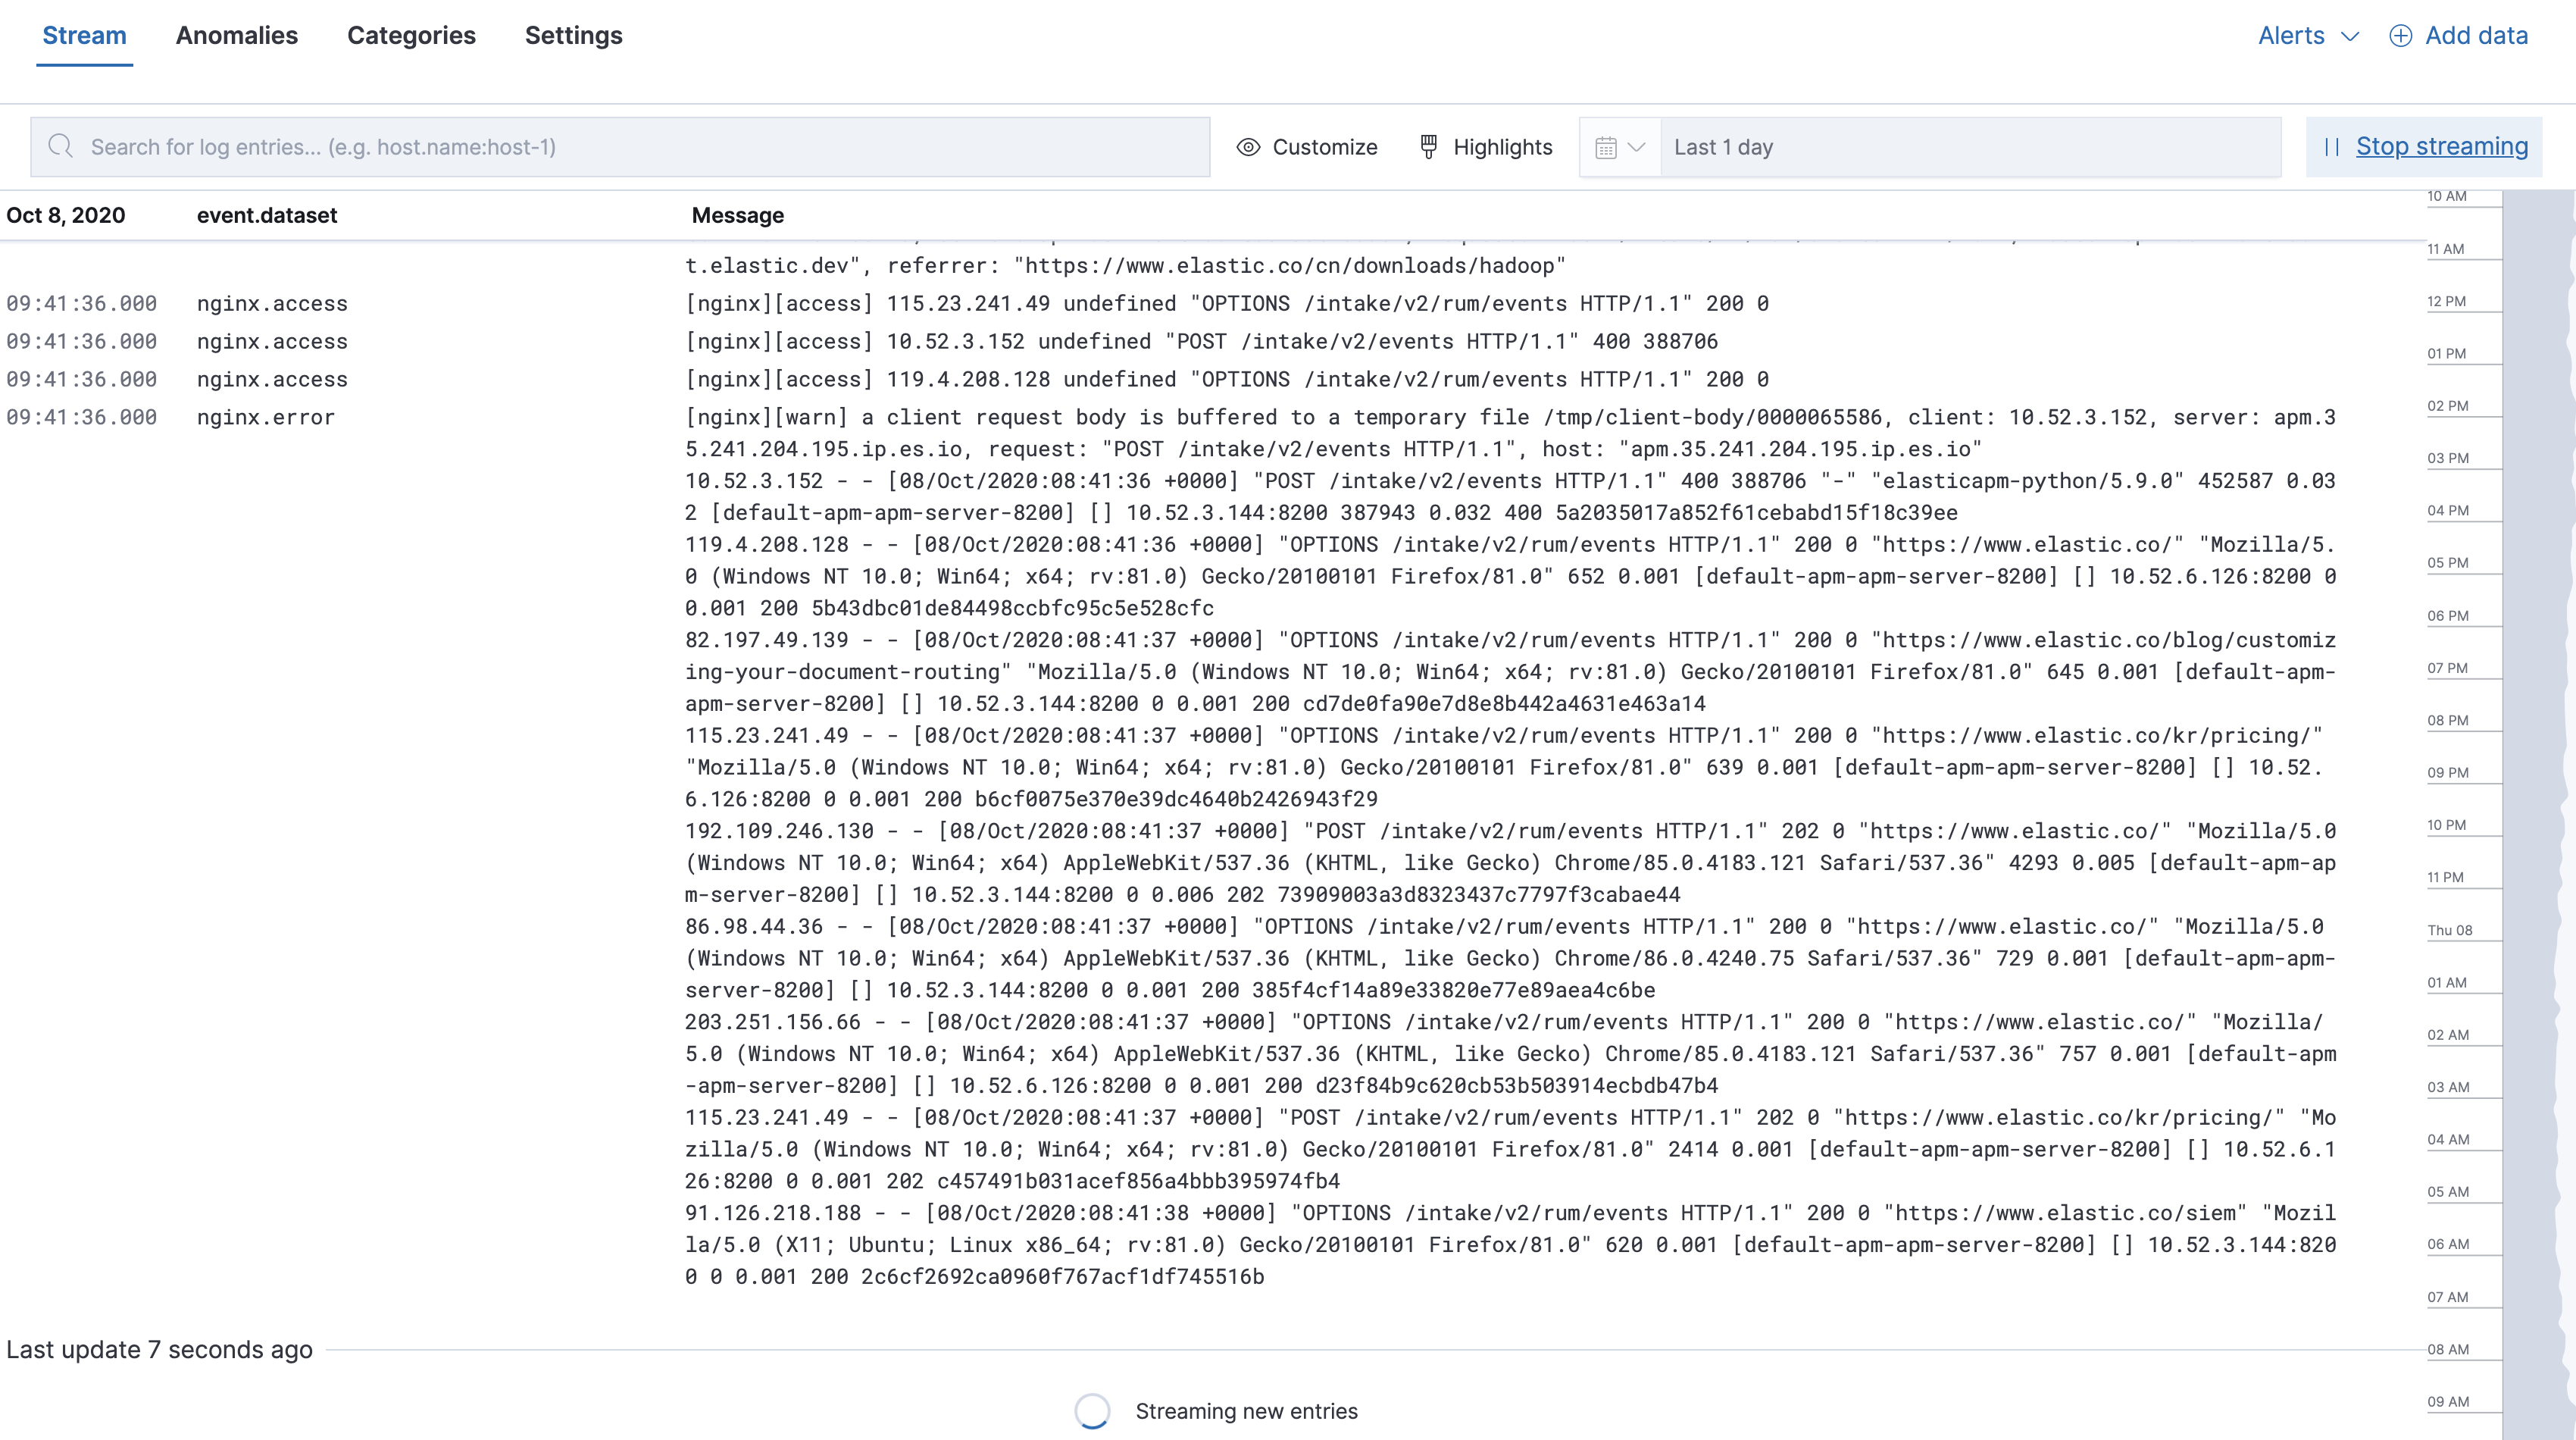
Logs
editThe Logs app in Kibana enables you to search, filter, and tail all your logs ingested into Elasticsearch. Instead of having to log into different servers, change directories, and tail individual files, all your logs are available in the Logs app.
There is live streaming of logs, filtering using auto-complete, and a logs histogram for quick navigation. You can also use machine learning to detect specific log anomalies automatically and categorize log messages to quickly identify patterns in your log events.
To get started with the Logs app, see Ingest logs.
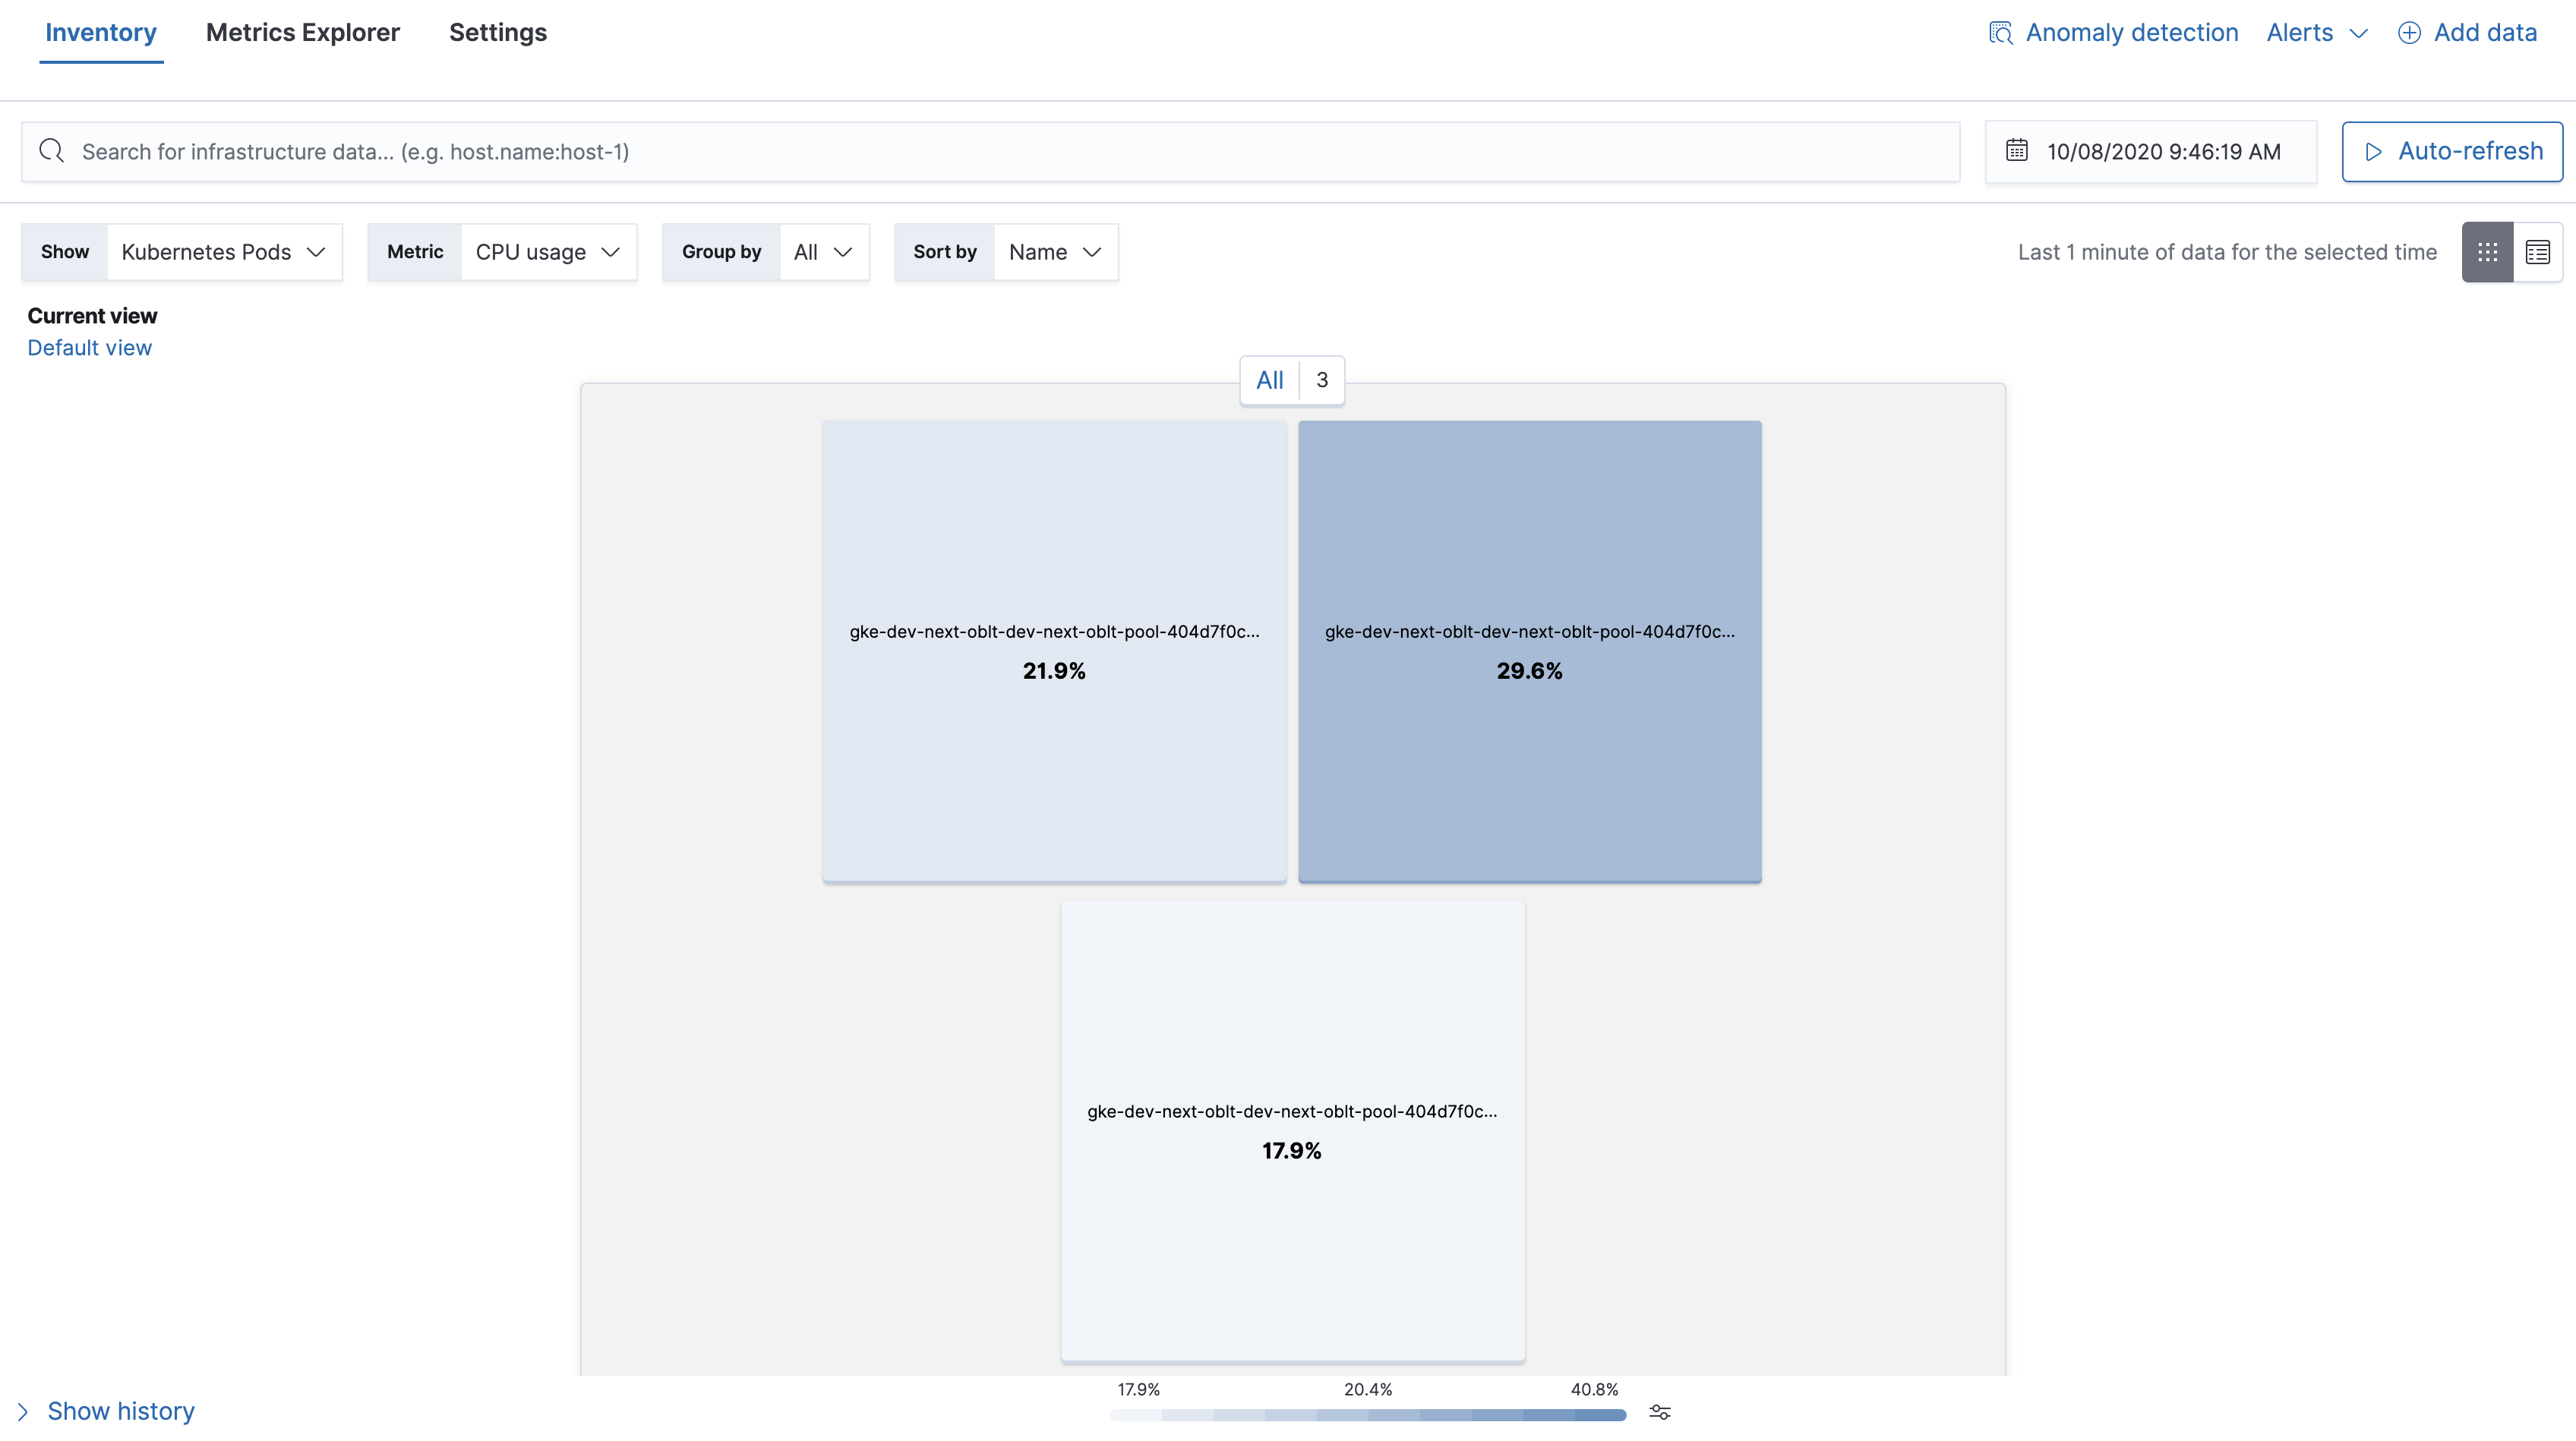
Metrics
editThe Metrics app in Kibana enables you to visualize infrastructure metrics to help diagnose problematic spikes, identify high resource utilization, automatically discover and track pods, and unify your metrics with logs and APM data in Elasticsearch.
To get started with the Metrics app, see Ingest metrics.
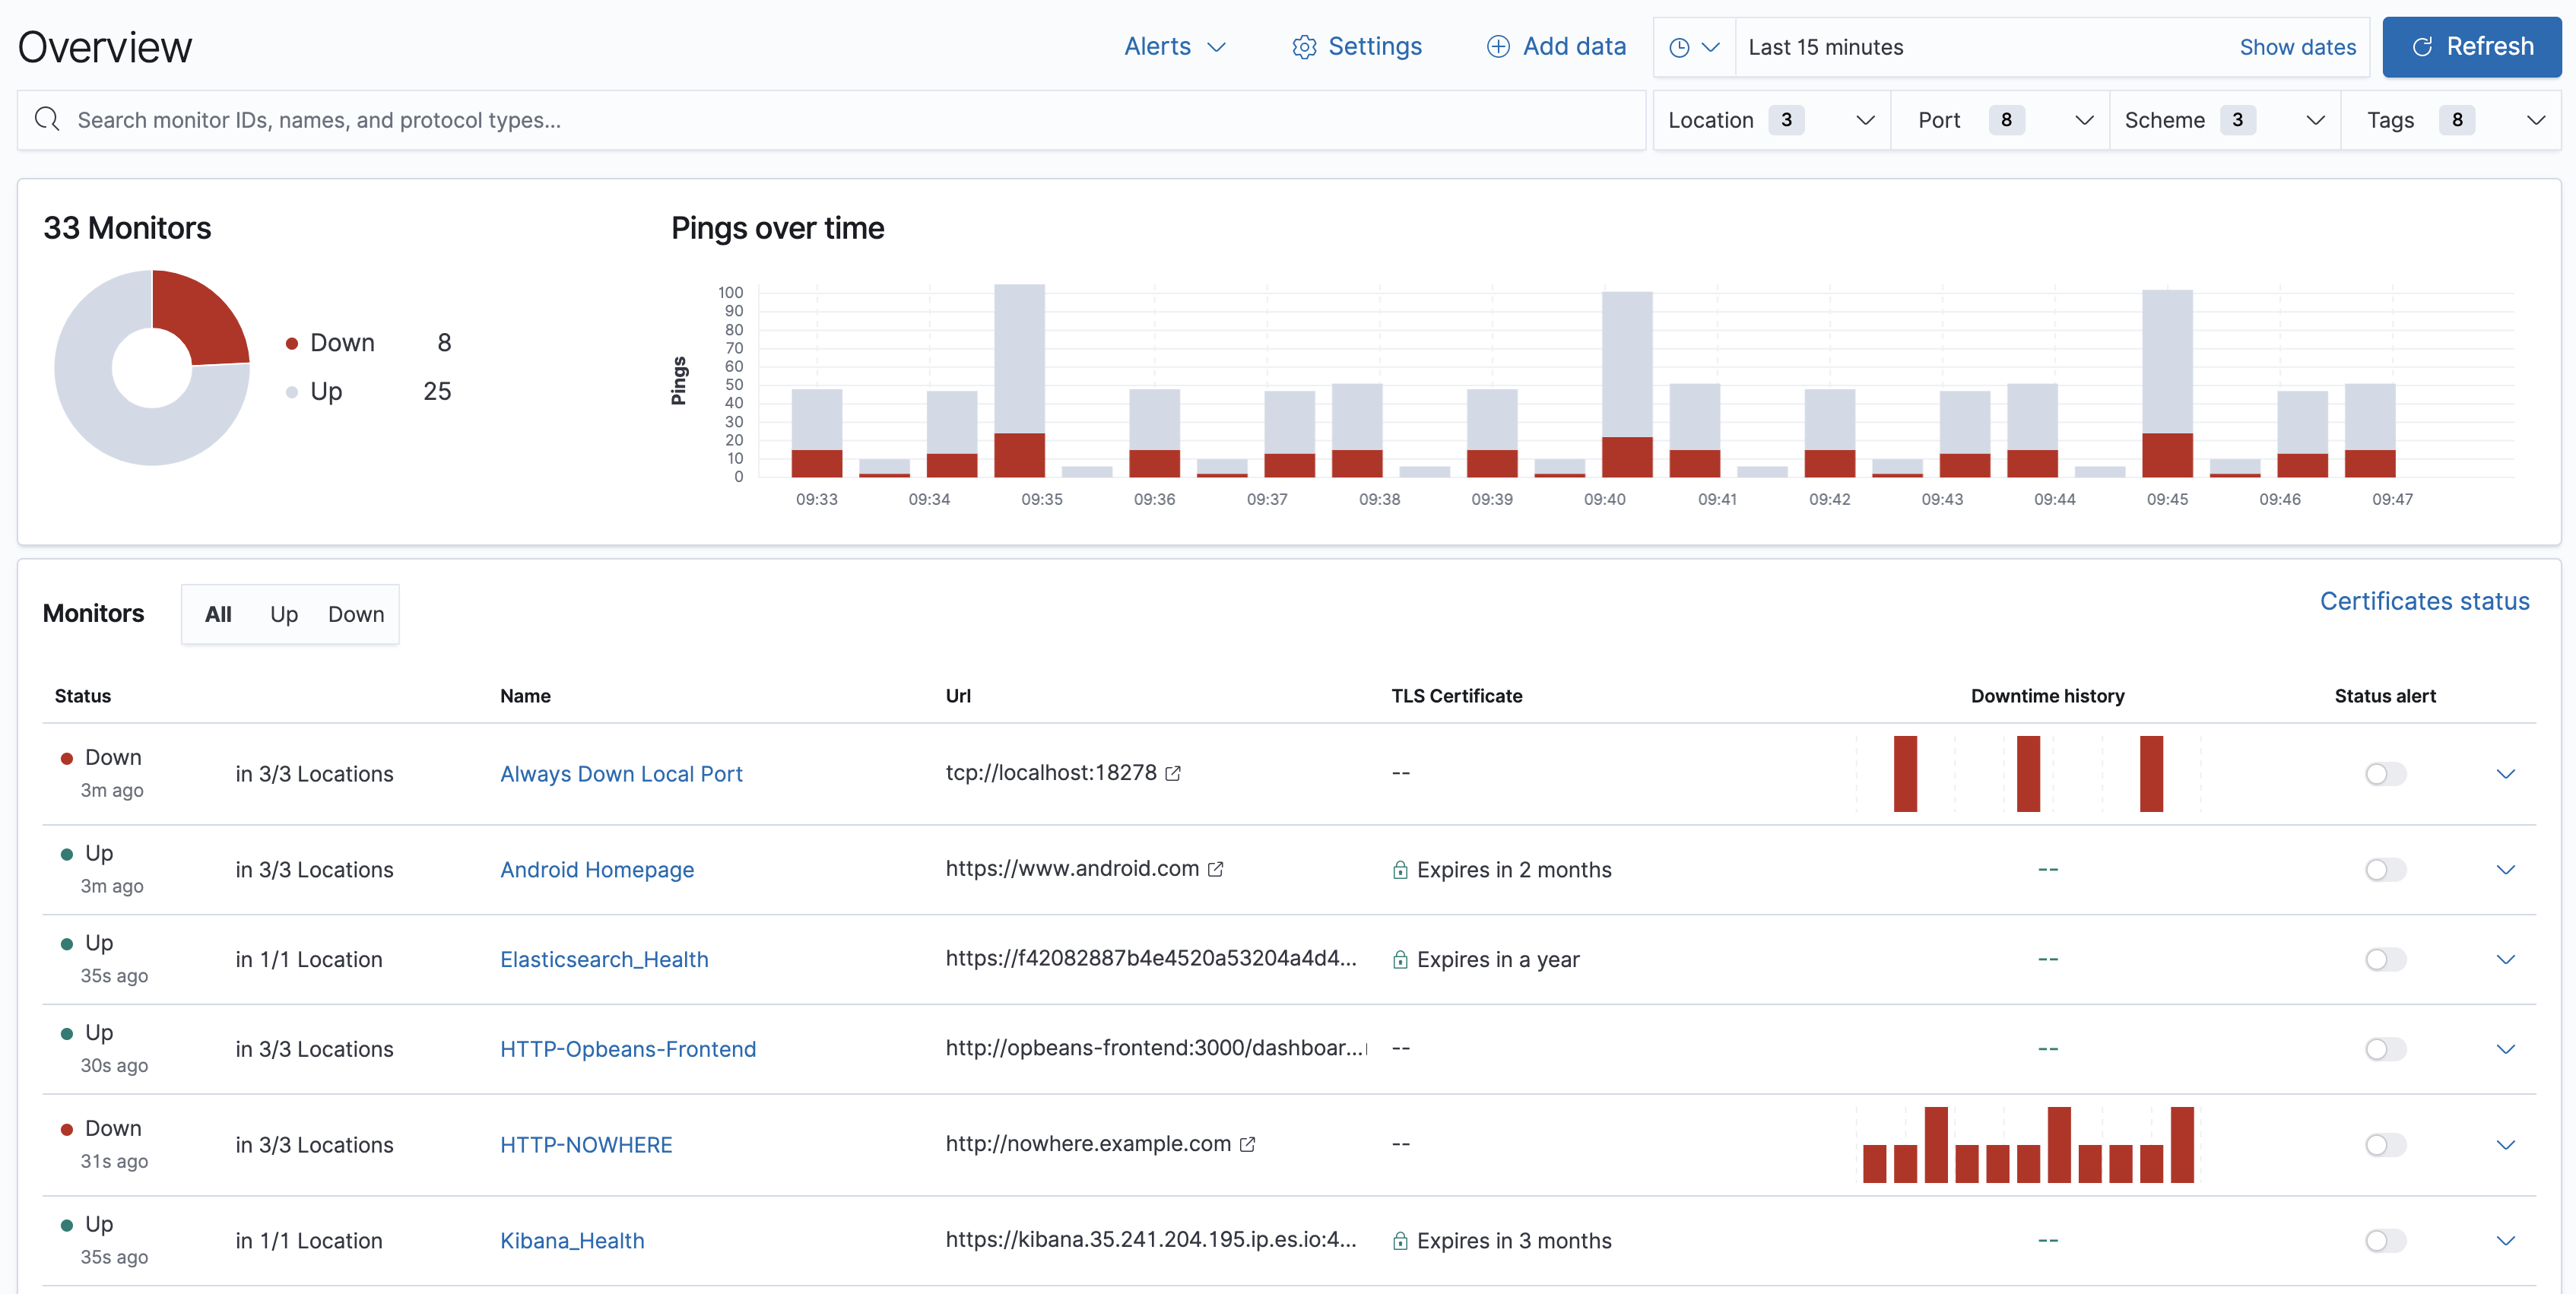
Uptime
editThe Uptime app in Kibana enables you to monitor the availability and response times of applications and services in real time, and detect problems before they affect users. You can monitor the status of network endpoints via HTTP/S, TCP, and ICMP, explore endpoint status over time, drill down into specific monitors, and view a high-level snapshot of your environment at any point in time.
To get started with the Uptime app, see Ingest uptime data.
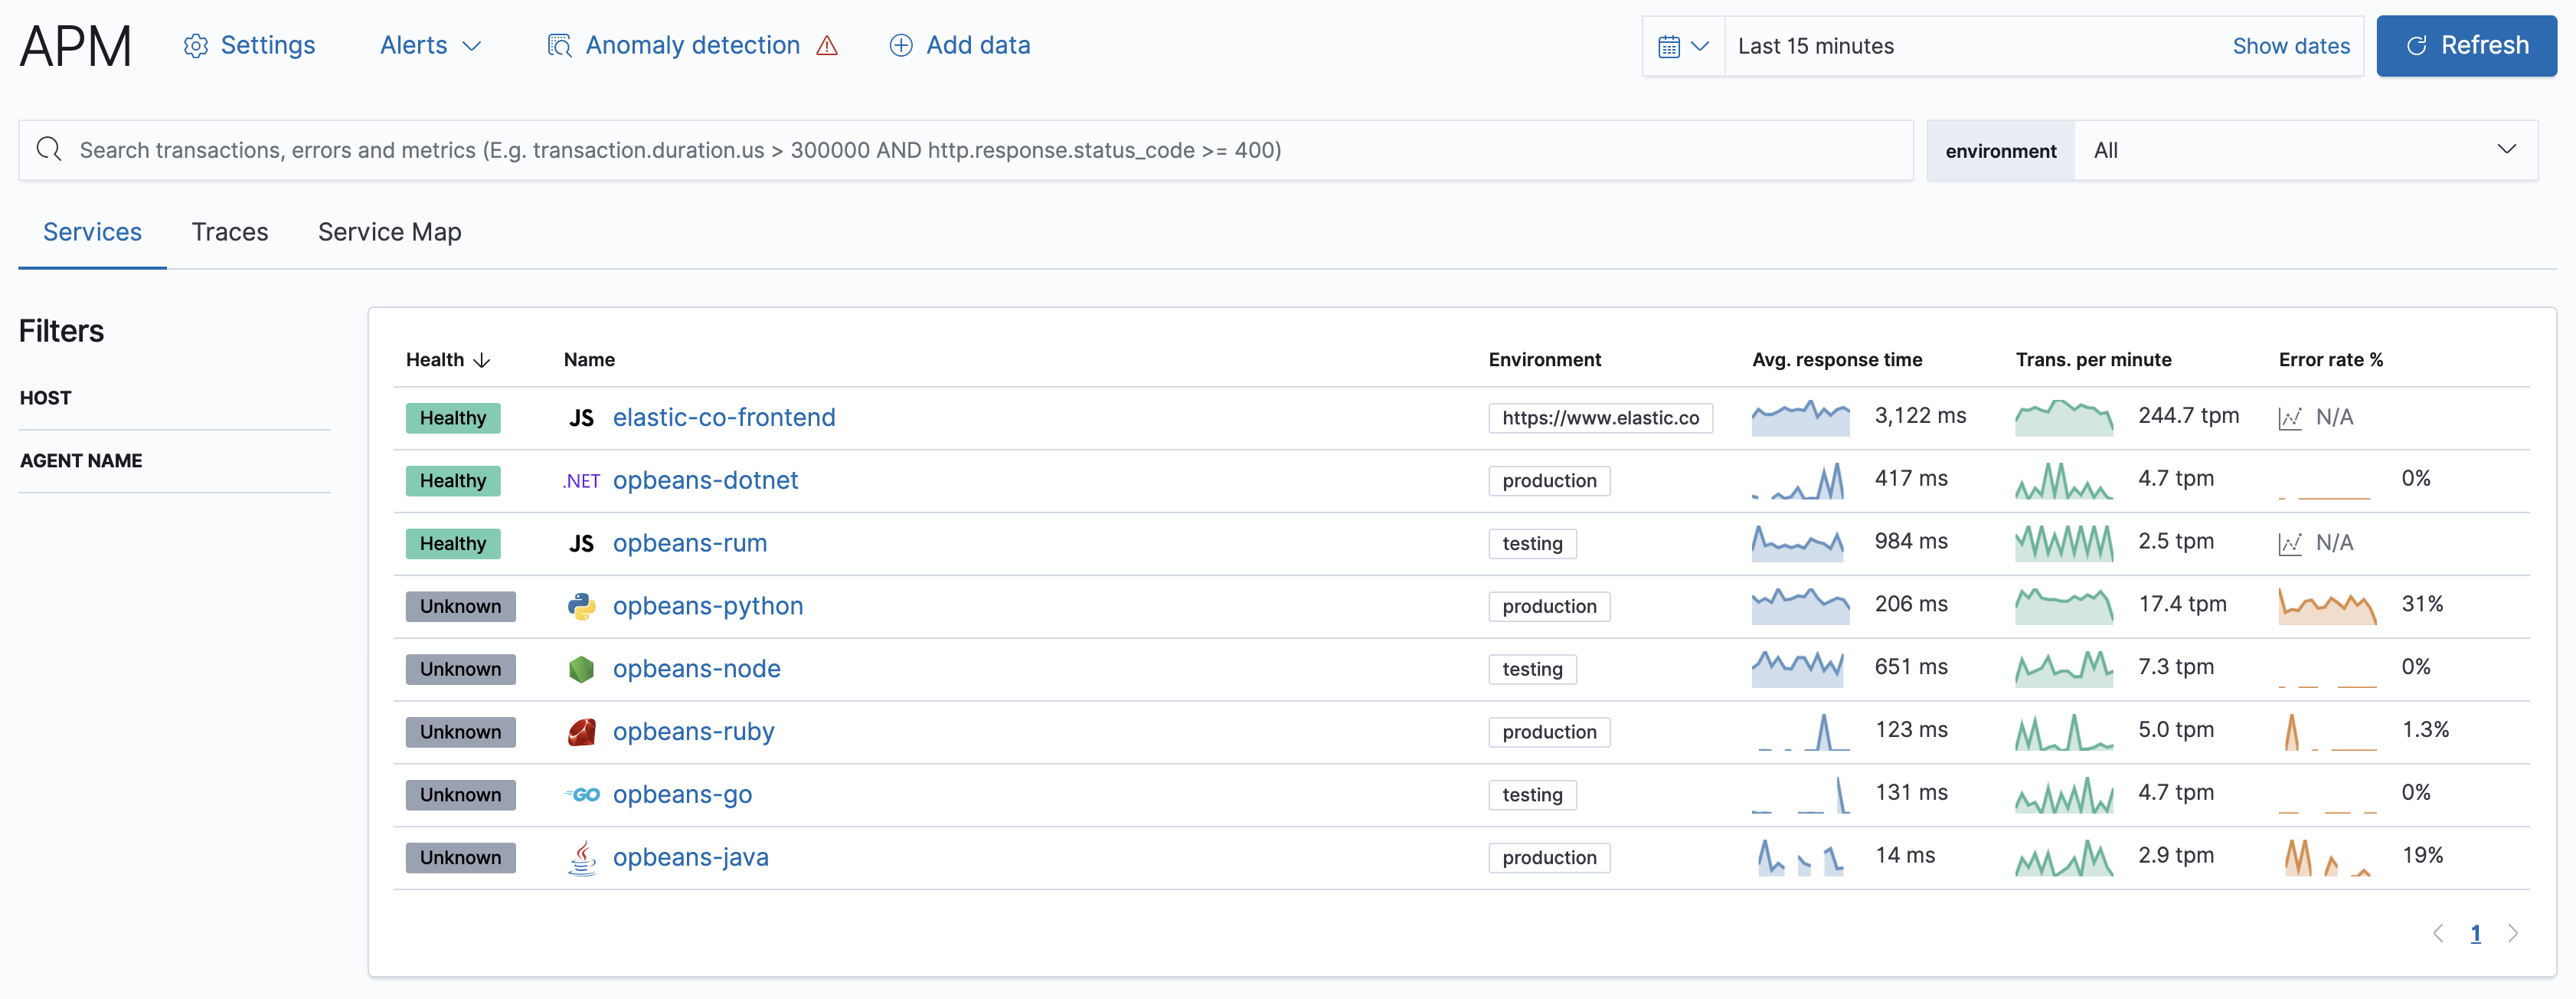
APM
editThe APM app in Kibana enables you to monitors software services and applications in real time, collect unhandled errors and exceptions, and automatically pick up basic host-level metrics and agent specific metrics.
To get started with the APM app, see Set up the APM app.