- Kibana Guide: other versions:
- What is Kibana?
- What’s new in 7.12
- Kibana concepts
- Quick start
- Set up
- Install Kibana
- Configure Kibana
- Alerting and action settings
- APM settings
- Banners settings
- Development tools settings
- Graph settings
- Fleet settings
- i18n settings
- Logs settings
- Metrics settings
- Machine learning settings
- Monitoring settings
- Reporting settings
- Secure settings
- Search sessions settings
- Security settings
- Spaces settings
- Task Manager settings
- Telemetry settings
- Start and stop Kibana
- Access Kibana
- Securing access to Kibana
- Add data
- Upgrade Kibana
- Embed Kibana content in a web page
- Configure monitoring
- Configure security
- Production considerations
- Discover
- Dashboard
- Canvas
- Maps
- Machine learning
- Graph
- Observability
- APM
- Elastic Security
- Dev Tools
- Stack Monitoring
- Stack Management
- Fleet
- Reporting
- Alerting and Actions
- REST API
- Kibana plugins
- Accessibility
- Release notes
- Developer guide
IMPORTANT: No additional bug fixes or documentation updates
will be released for this version. For the latest information, see the
current release documentation.
Services
editServices
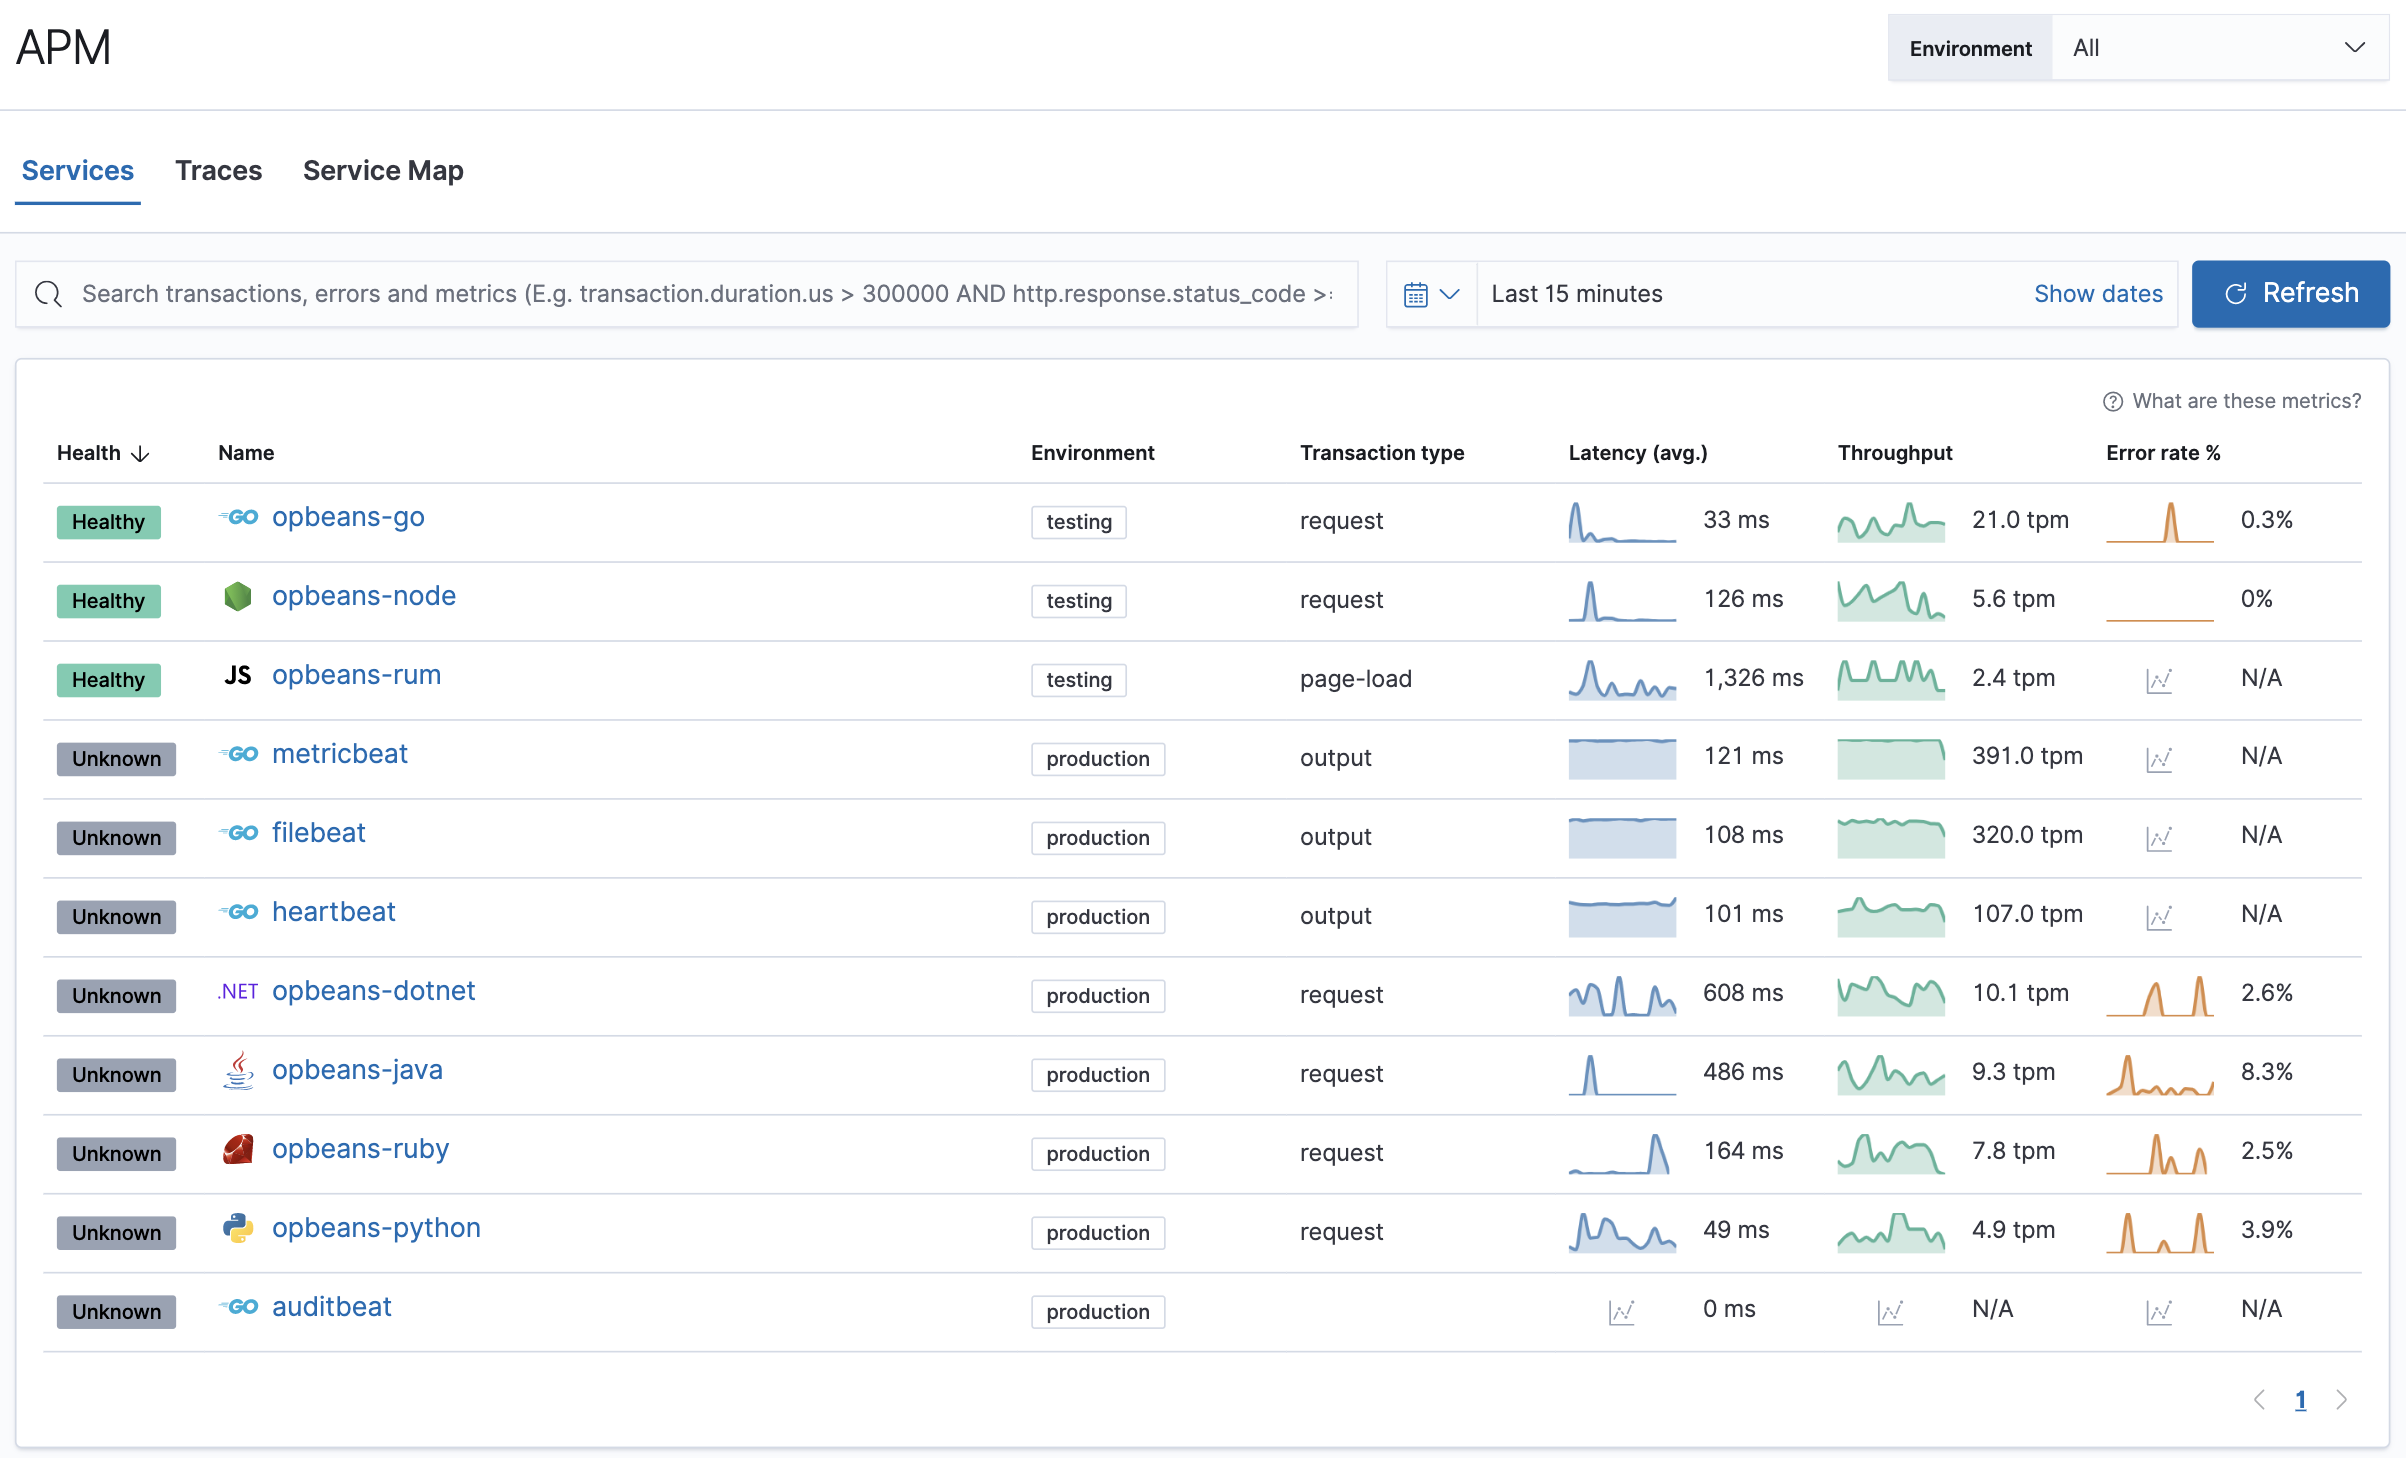
editService inventory provides a quick, high-level overview of the health and general performance of all instrumented services.
To help surface potential issues, services are sorted by their health status: critical > warning > healthy > unknown. Health status is powered by machine learning and requires anomaly detection to be enabled.
Was this helpful?
Thank you for your feedback.