Dashboards
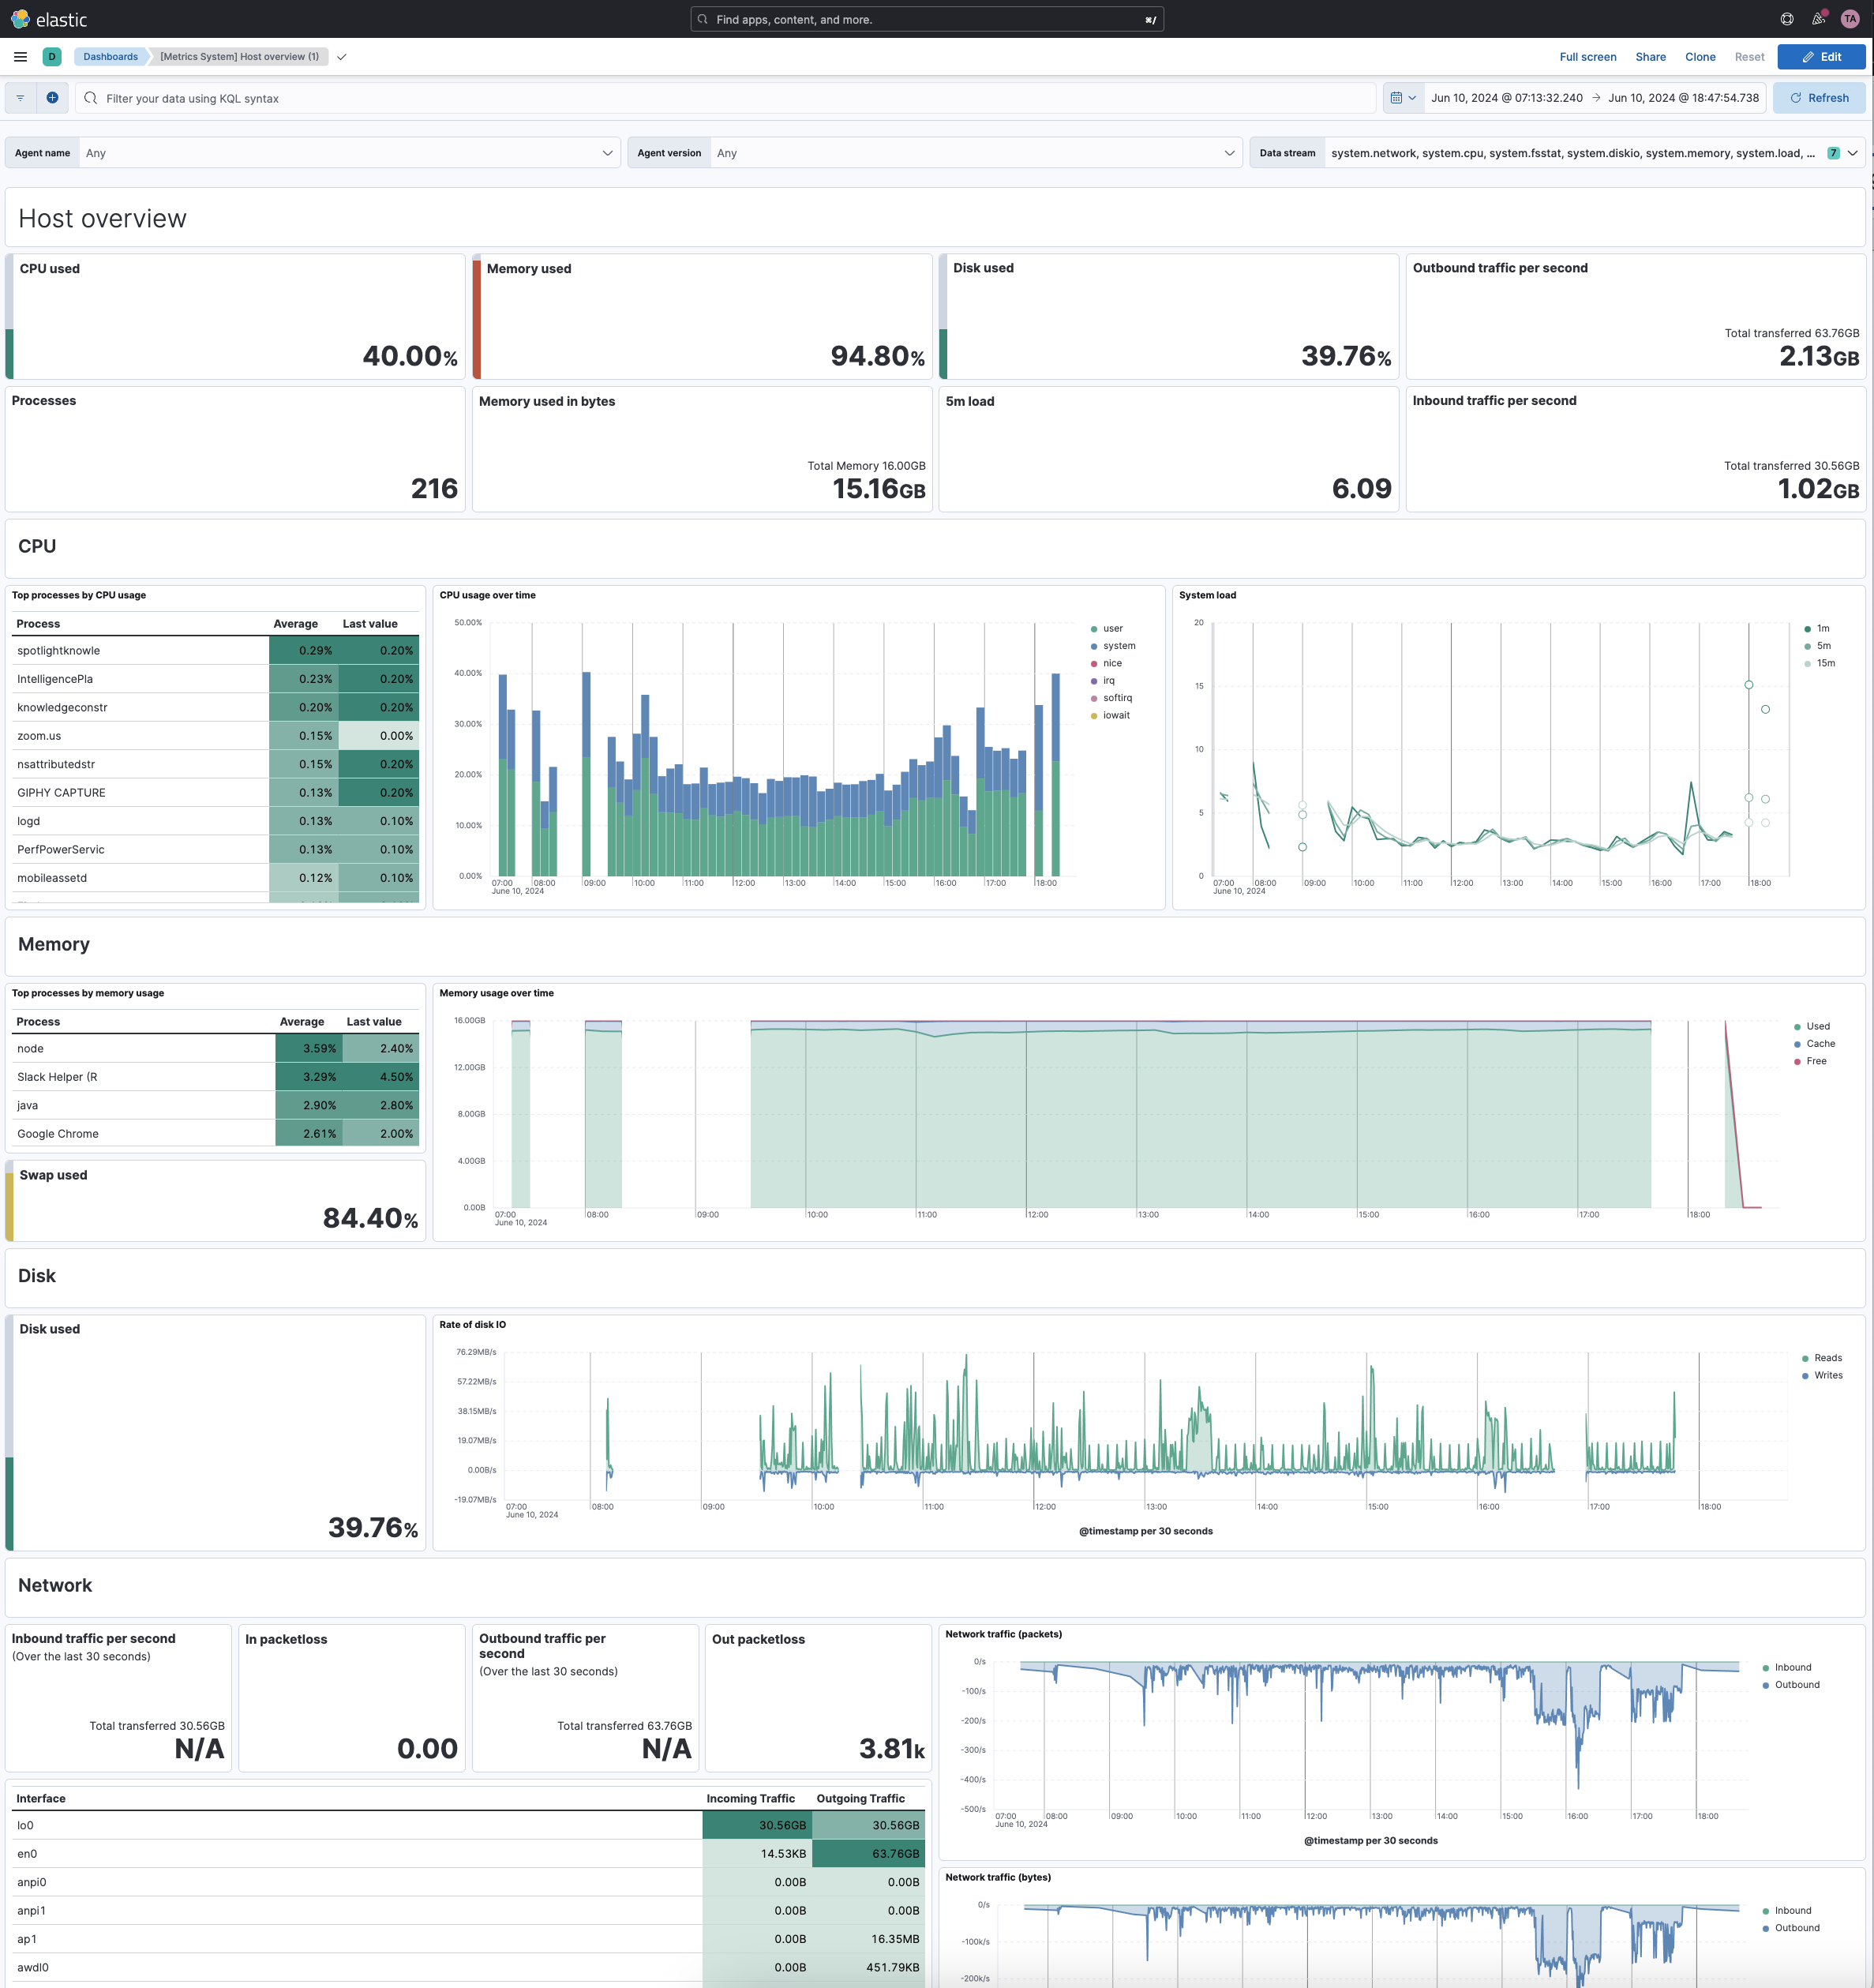
Dashboards provide the primary way to visualize and share insights from your Elasticsearch data. They allow you to build interactive displays that combine multiple visualizations, metrics, and controls into a single view that helps you and your team monitor trends, investigate issues, and make data-driven decisions.
A dashboard is composed of one or more panels that you arrange to tell your data story. Each panel can display visualizations such as charts, tables, metrics, and maps, static annotations like text or images, or specialized views for machine learning or Observability data.

New to dashboards? Start with these hands-on tutorials that walk you through creating your first dashboards using sample data:
- Create a simple dashboard to monitor website logs: Build a dashboard with charts, metrics, and filters to analyze web traffic patterns.
- Create a dashboard with time series charts: Learn to visualize sales trends and patterns over time using eCommerce data.
Once you understand the basics, explore these common tasks:
Explore and interact
- Explore dashboards: Filter data, adjust time ranges, and interact with panels to uncover insights.
Build and customize dashboards
- Build dashboards: Learn the fundamentals of creating and configuring dashboards.
- Create a dashboard: Start with an empty dashboard and add your content.
- Add filter controls: Enable interactive filtering with options lists, range sliders, and time sliders.
- Add drilldowns: Create interactive navigation between dashboards or to external URLs.
- Organize dashboard panels: Arrange panels using collapsible sections, resizing, and positioning.
Manage and share
- Manage dashboards: Browse, search, organize, and track usage of your dashboards.
- Share dashboards: Share with your team using links, embeds, or file exports.
- Duplicate a dashboard: Create customizable copies of existing dashboards.
- Import a dashboard: Bring dashboards from other environments.
Some dashboards are created and managed by the system, and are identified as managed in your list of dashboards. This generally happens when you set up an integration to add data. You can't edit managed dashboards directly, but you can duplicate them and edit the duplicates.