- Kibana Guide: other versions:
- What is Kibana?
- What’s new in 8.9
- Kibana concepts
- Quick start
- Set up
- Install Kibana
- Configure Kibana
- Alerting and action settings
- APM settings
- Banners settings
- Cases settings
- Enterprise Search settings
- Fleet settings
- i18n settings
- Logging settings
- Logs settings
- Metrics settings
- Monitoring settings
- Reporting settings
- Search sessions settings
- Secure settings
- Security settings
- Spaces settings
- Task Manager settings
- Telemetry settings
- URL drilldown settings
- Start and stop Kibana
- Access Kibana
- Securing access to Kibana
- Add data
- Upgrade Kibana
- Configure security
- Configure reporting
- Configure logging
- Configure monitoring
- Command line tools
- Production considerations
- Discover
- Dashboard and visualizations
- Canvas
- Maps
- Build a map to compare metrics by country or region
- Track, visualize, and alert on assets in real time
- Map custom regions with reverse geocoding
- Heat map layer
- Tile layer
- Vector layer
- Plot big data
- Search geographic data
- Configure map settings
- Connect to Elastic Maps Service
- Import geospatial data
- Troubleshoot
- Reporting and sharing
- Machine learning
- Graph
- Alerting
- Observability
- APM
- Set up
- Get started
- How-to guides
- Configure APM agents with central config
- Control access to APM data
- Create an alert
- Create custom links
- Filter data
- Find transaction latency and failure correlations
- Identify deployment details for APM agents
- Integrate with machine learning
- Observe Lambda functions
- Query your data
- Storage Explorer
- Track deployments with annotations
- Users and privileges
- Settings
- REST API
- Troubleshooting
- Security
- Dev Tools
- Fleet
- Osquery
- Stack Monitoring
- Stack Management
- REST API
- Get features API
- Kibana spaces APIs
- Kibana role management APIs
- User session management APIs
- Saved objects APIs
- Data views API
- Index patterns APIs
- Alerting APIs
- Action and connector APIs
- Cases APIs
- Add comment
- Create case
- Delete cases
- Delete comments
- Find case activity
- Find cases
- Find connectors
- Get alerts
- Get case activity
- Get case
- Get case status
- Get cases by alert
- Get comments
- Get configuration
- Get reporters
- Get tags
- Push case
- Set configuration
- Update cases
- Update comment
- Update configuration
- Import and export dashboard APIs
- Logstash configuration management APIs
- Machine learning APIs
- Osquery manager API
- Short URLs APIs
- Get Task Manager health
- Upgrade assistant APIs
- Kibana plugins
- Troubleshooting
- Accessibility
- Release notes
- Kibana 8.9.2
- Kibana 8.9.1
- Kibana 8.9.0
- Kibana 8.8.2
- Kibana 8.8.1
- Kibana 8.8.0
- Kibana 8.7.1
- Kibana 8.7.0
- Kibana 8.6.1
- Kibana 8.6.0
- Kibana 8.5.2
- Kibana 8.5.1
- Kibana 8.5.0
- Kibana 8.4.3
- Kibana 8.4.2
- Kibana 8.4.1
- Kibana 8.4.0
- Kibana 8.3.3
- Kibana 8.3.2
- Kibana 8.3.1
- Kibana 8.3.0
- Kibana 8.2.3
- Kibana 8.2.2
- Kibana 8.2.1
- Kibana 8.2.0
- Kibana 8.1.3
- Kibana 8.1.2
- Kibana 8.1.1
- Kibana 8.1.0
- Kibana 8.0.0
- Kibana 8.0.0-rc2
- Kibana 8.0.0-rc1
- Kibana 8.0.0-beta1
- Kibana 8.0.0-alpha2
- Kibana 8.0.0-alpha1
- Developer guide
Run a pattern analysis on your log data
editRun a pattern analysis on your log data
editThis functionality is in technical preview, requires a Platinum subscription, and may be changed or removed in a future release. Elastic will apply best effort to fix any issues, but features in technical preview are not subject to the support SLA of official GA features.
Log pattern analysis helps you to find patterns in unstructured log messages and makes it easier to examine your data. It performs categorization analysis on a selected field of a data view, creates categories based on the data and displays them together with a chart that shows the distribution of each category and an example document that matches the category.
Log pattern analysis works on every text field.
This example uses the sample web logs data, or you can use your own data.
- Open the main menu, and click Discover.
- Expand the data view dropdown, and select Kibana Sample Data Logs.
- If you don’t see any results, expand the time range, for example, to Last 15 days.
-
Click the
messagefield in the Available fields list sidebar and click Run pattern analysis.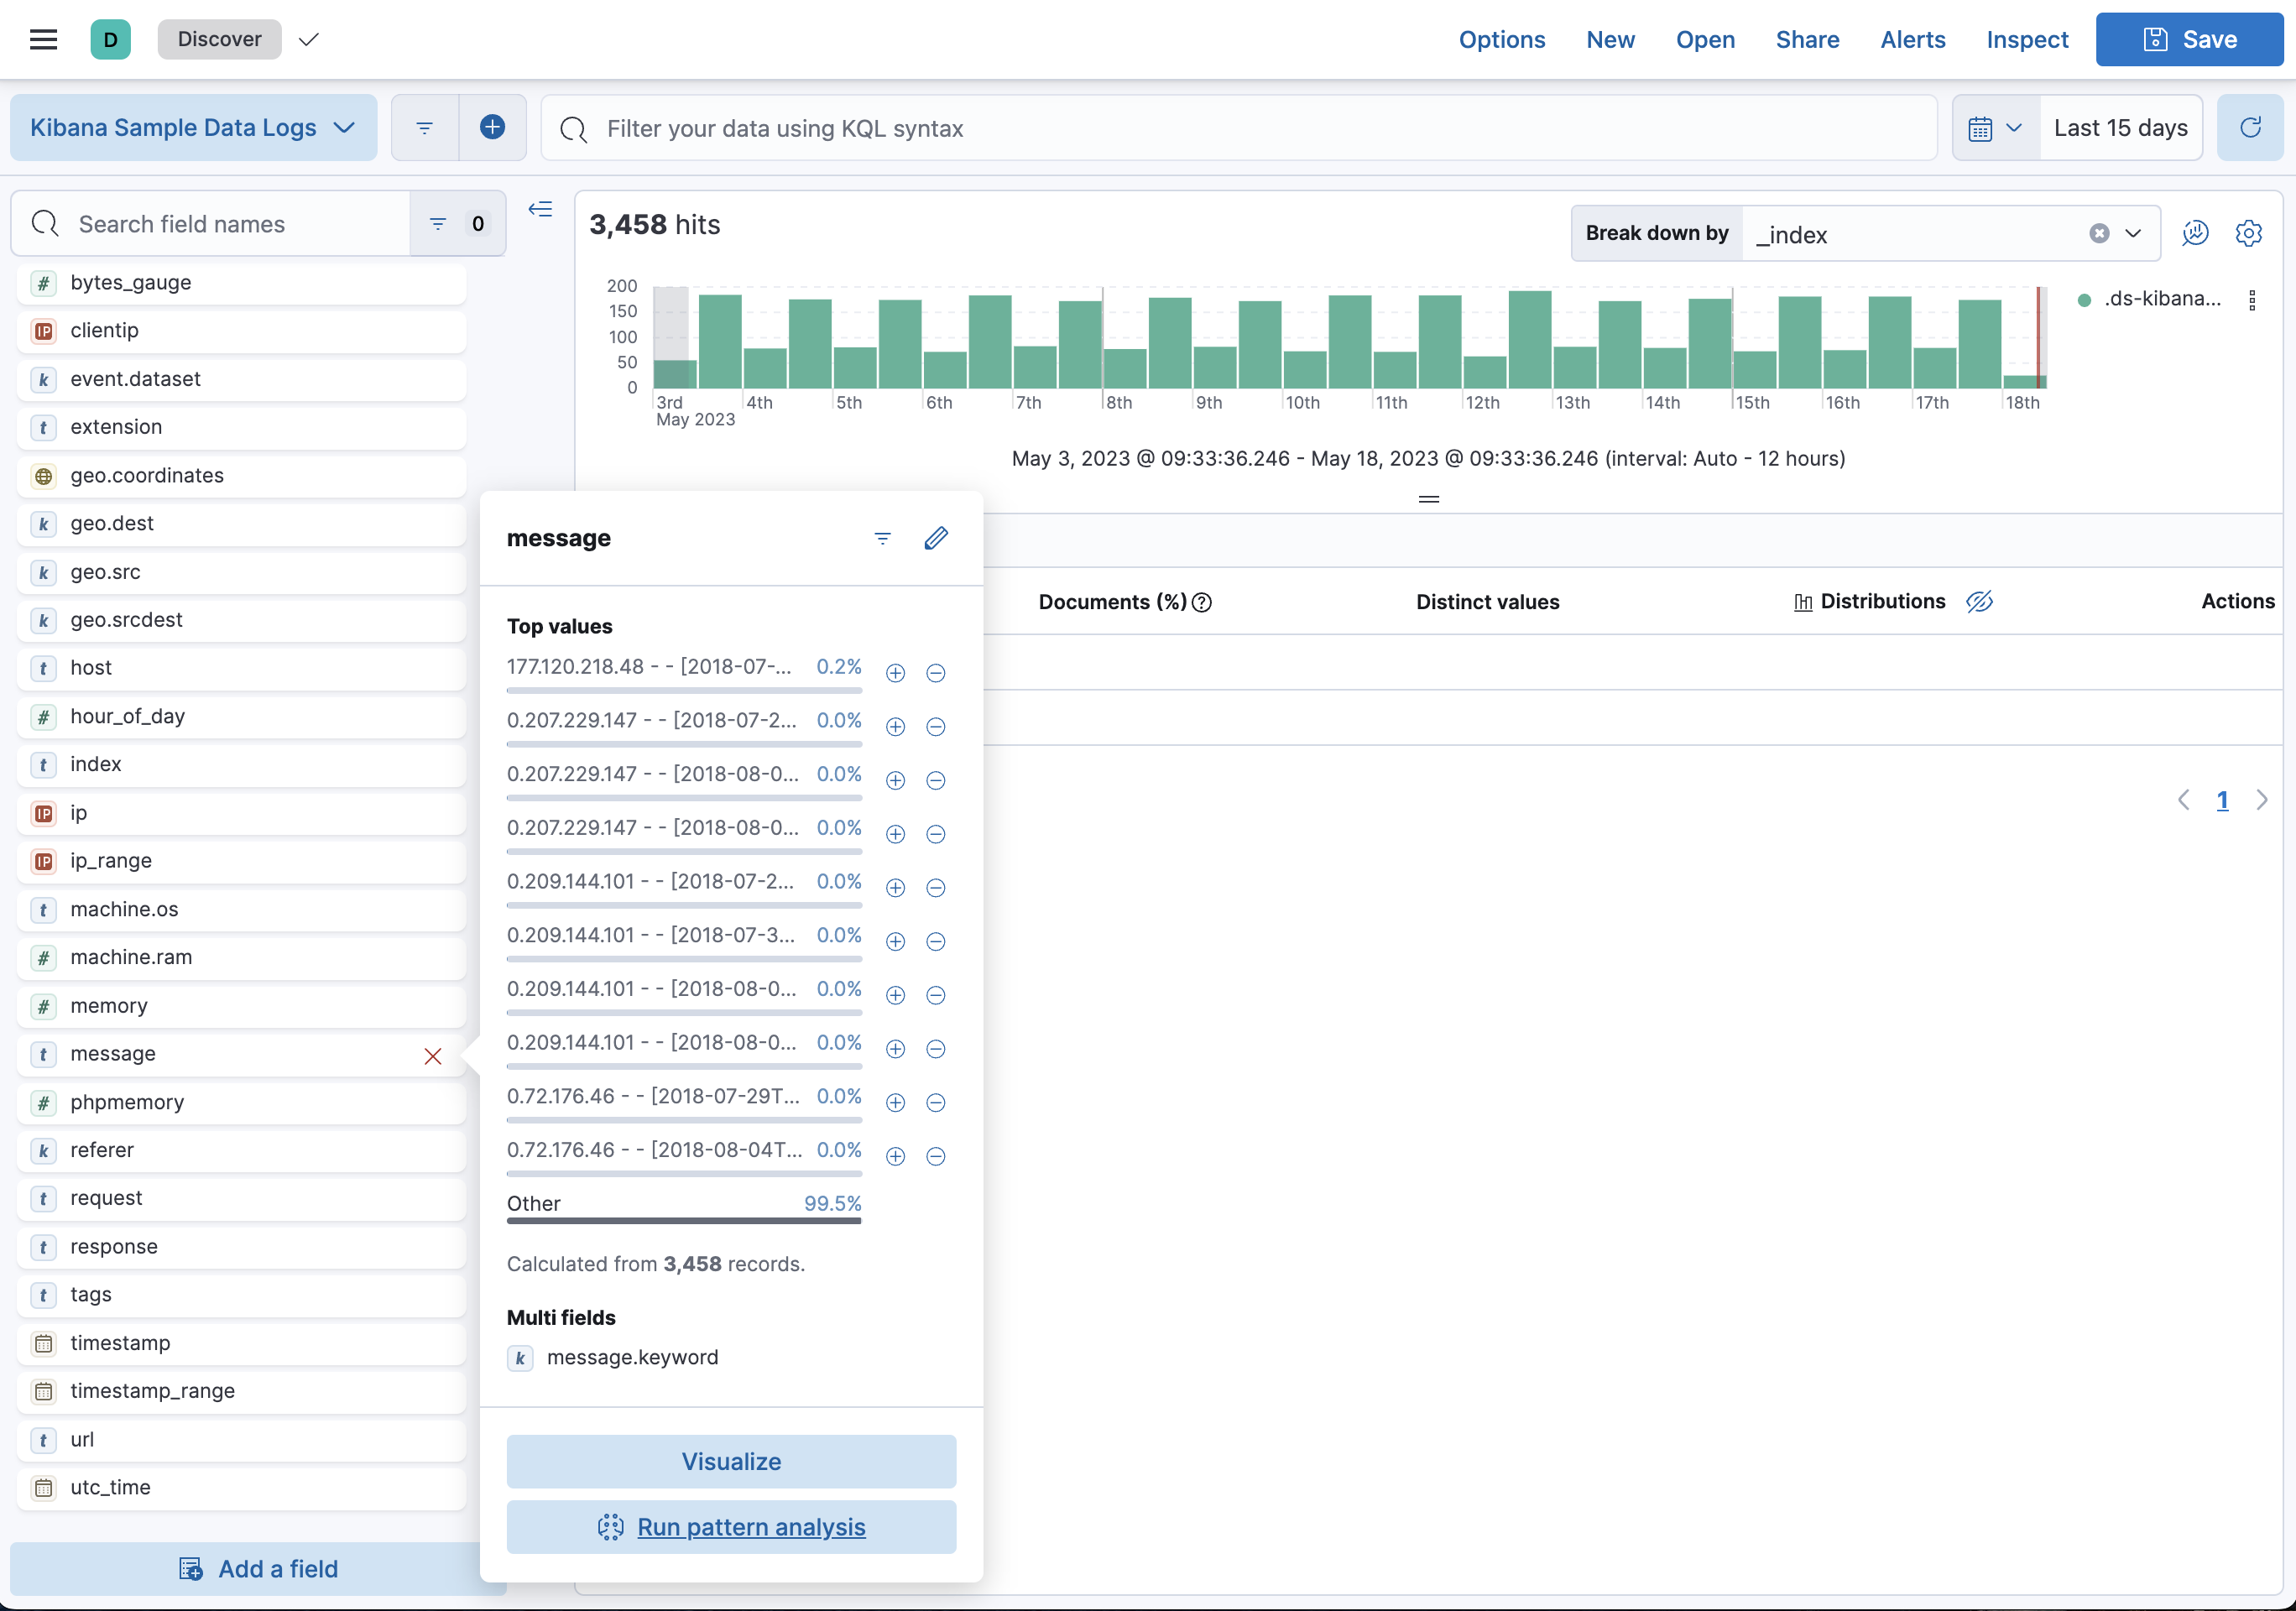
The pattern analysis starts. The results are displayed in a flyout when the analysis is complete.
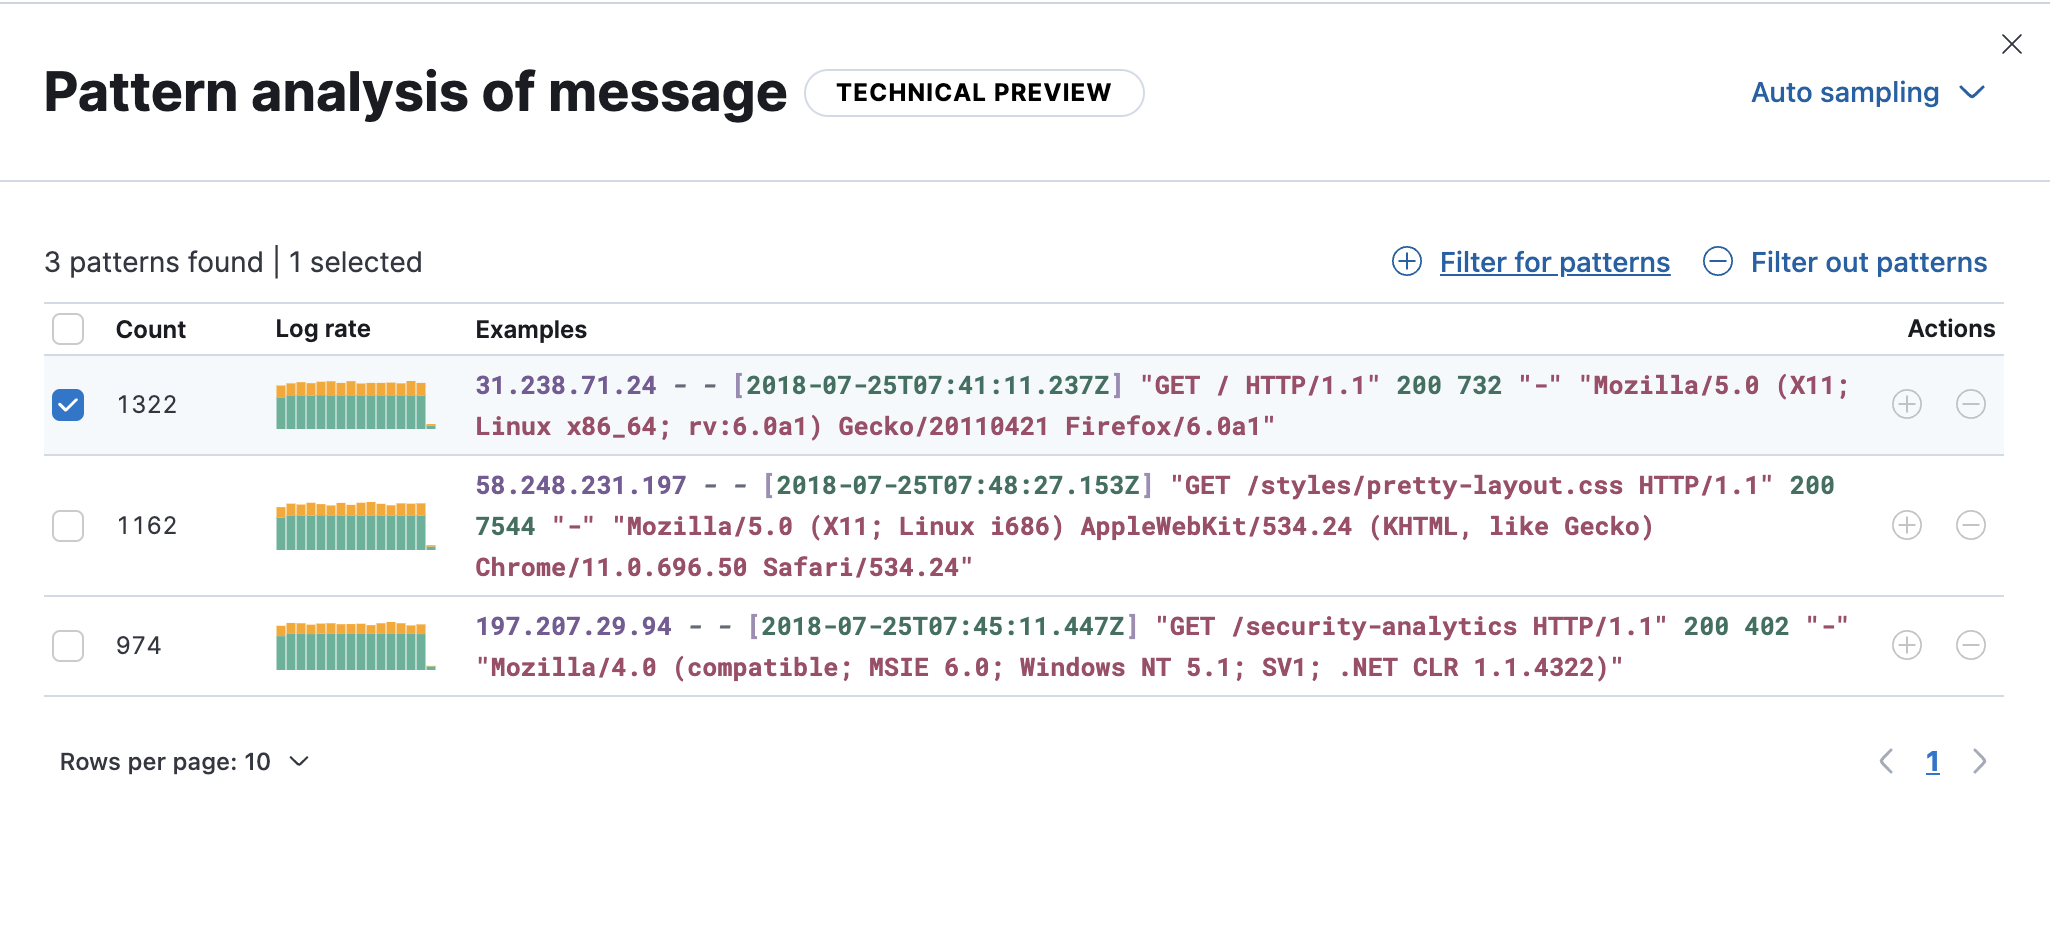
- (optional) Apply filters to one or more patterns. Discover only displays documents that match the selected patterns. Additionally, you can remove selected patterns from Discover, resulting in the display of only those documents that don’t match the selected pattern. These options enable you to remove unimportant messages and focus on the more important, actionable data during troubleshooting.