Open and manage cases
editOpen and manage cases
editThis functionality is in technical preview and may be changed or removed in a future release. Elastic will work to fix any issues, but features in technical preview are not subject to the support SLA of official GA features.
Open a new case
editOpen a new case to keep track of issues and share their details with colleagues.
- Go to Management > Stack Management > Cases, then click Create case.
-
Give the case a name, severity, and description.
In the
Descriptionarea, you can use Markdown syntax to create formatted text. - Optionally, add a category, assignees, and tags. You can add users only if they meet the necessary prerequisites.
- For External incident management system, select a connector. For more information, refer to Add connectors.
- After you’ve completed all of the required fields, click Create case.
Add files
editAfter you create a case, you can upload and manage files on the Files tab:
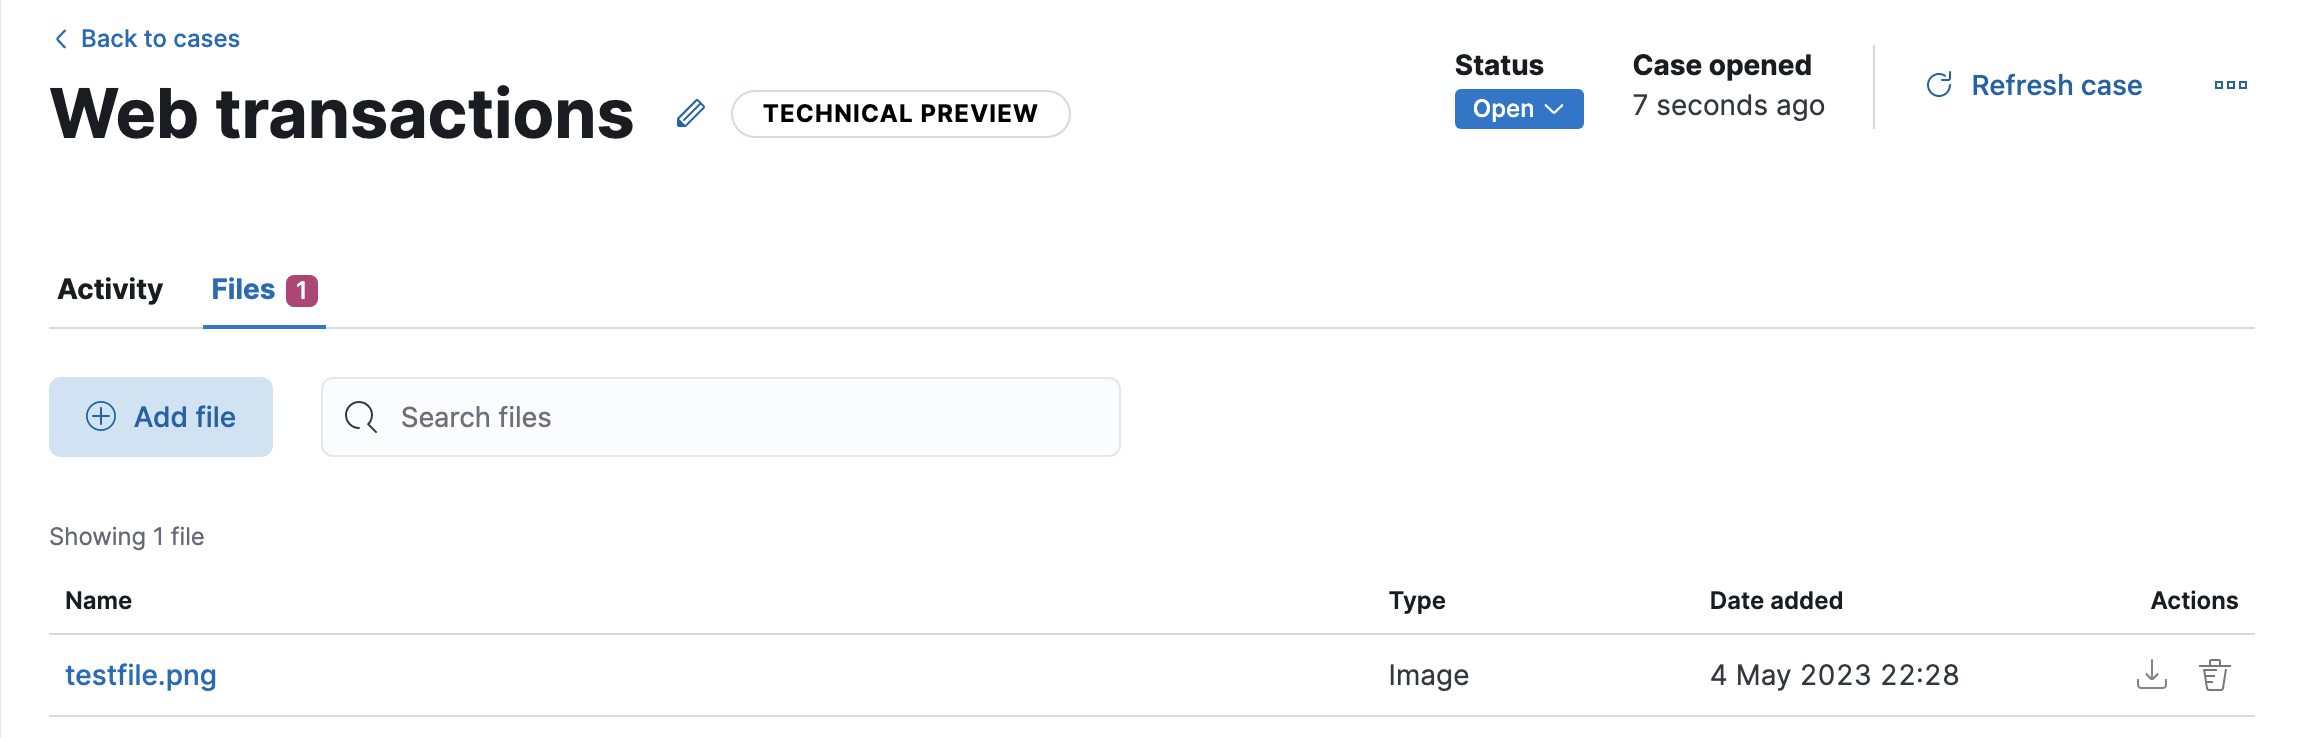
The acceptable file types and sizes are affected by your case settings.
When you upload a file, a comment is added to the case activity log. To view images, click their name in the activity or file list.
Uploaded files are also accessible in Stack Management > Files. When you export cases as saved objects, the case files are not exported.
Add a visualization
editYou can also optionally add visualizations. For example, you can portray event and alert data through charts and graphs.
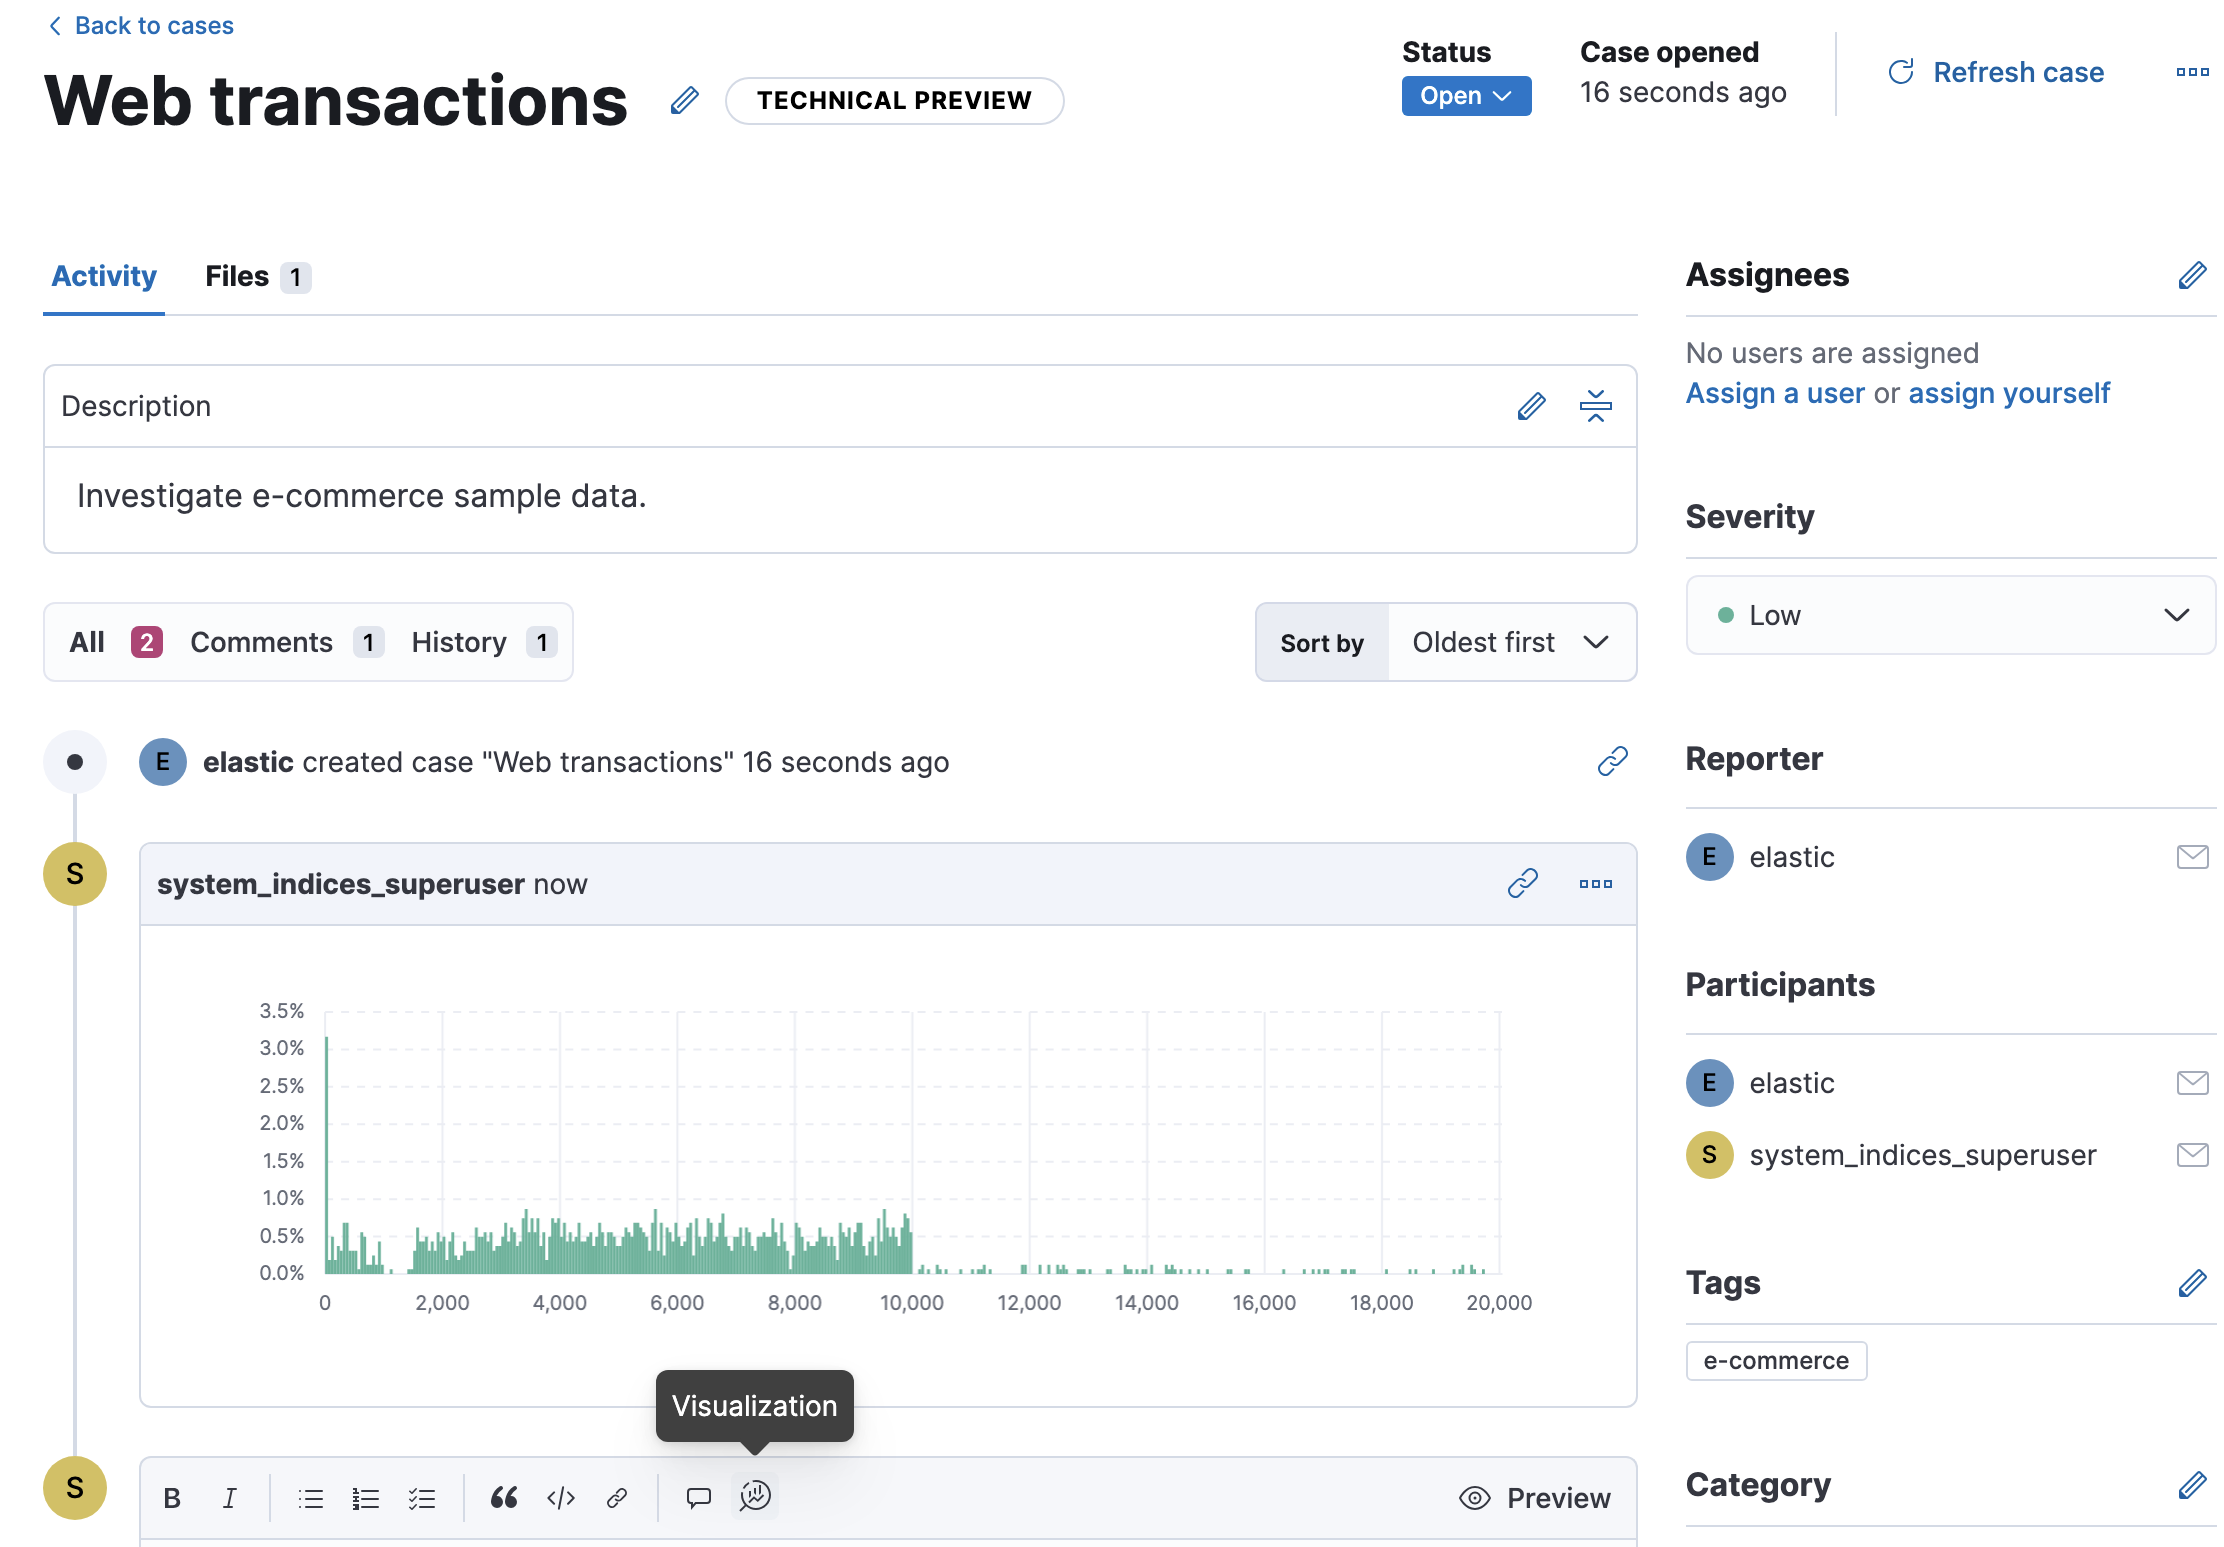
To add a visualization to a comment within your case:
- Click the Visualization button. The Add visualization dialog appears.
-
Select an existing visualization from your Visualize Library or create a new visualization.
Set an absolute time range for your visualization. This ensures your visualization doesn’t change over time after you save it to your case and provides important context for viewers.
- After you’ve finished creating your visualization, click Save and return to go back to your case.
- Click Preview to see how the visualization will appear in the case comment.
- Click Add Comment to add the visualization to your case.
Alternatively, while viewing a dashboard you can open a panel’s menu then click More > Add to existing case or More > Add to new case.
After a visualization has been added to a case, you can modify or interact with it by clicking the Open Visualization option in the case’s comment menu.
Add email notifications
editYou can configure email notifications that occur when users are assigned to cases.
For hosted Kibana on Elasticsearch Service:
-
Add the email addresses to the monitoring email allowlist. Follow the steps in Send alerts by email.
You do not need to take any more steps to configure an email connector or update Kibana user settings, since the preconfigured Elastic-Cloud-SMTP connector is used by default.
For self-managed Kibana:
-
Create a preconfigured email connector.
At this time, email notifications support only preconfigured connectors, which are defined in the
kibana.ymlfile. For examples, refer to Preconfigured email connector and Configuring email connectors for well-known services. -
Set the
notifications.connectors.default.emailKibana setting to the name of your email connector. - If you want the email notifications to contain links back to the case, you must configure the server.publicBaseUrl setting.
When you subsequently add assignees to cases, they receive an email.
Manage cases
editIn Management > Stack Management > Cases, you can search cases and filter them by attributes such as assignees, categories, severity, status, and tags. You can also select multiple cases and use bulk actions to delete cases or change their attributes.
To view a case, click on its name. You can then:
- Add a new comment.
- Edit existing comments and the description.
- Add or remove assignees.
- Add a connector.
- Send updates to external systems (if external connections are configured).
- Edit the category and tags.
- Refresh the case to retrieve the latest updates.
- Change the status.
- Change the severity.
- Close or delete the case.
- Reopen a closed case.