- Kibana Guide: other versions:
- What is Kibana?
- What’s new in 8.9
- Kibana concepts
- Quick start
- Set up
- Install Kibana
- Configure Kibana
- Alerting and action settings
- APM settings
- Banners settings
- Cases settings
- Enterprise Search settings
- Fleet settings
- i18n settings
- Logging settings
- Logs settings
- Metrics settings
- Monitoring settings
- Reporting settings
- Search sessions settings
- Secure settings
- Security settings
- Spaces settings
- Task Manager settings
- Telemetry settings
- URL drilldown settings
- Start and stop Kibana
- Access Kibana
- Securing access to Kibana
- Add data
- Upgrade Kibana
- Configure security
- Configure reporting
- Configure logging
- Configure monitoring
- Command line tools
- Production considerations
- Discover
- Dashboard and visualizations
- Canvas
- Maps
- Build a map to compare metrics by country or region
- Track, visualize, and alert on assets in real time
- Map custom regions with reverse geocoding
- Heat map layer
- Tile layer
- Vector layer
- Plot big data
- Search geographic data
- Configure map settings
- Connect to Elastic Maps Service
- Import geospatial data
- Troubleshoot
- Reporting and sharing
- Machine learning
- Graph
- Alerting
- Observability
- APM
- Set up
- Get started
- How-to guides
- Configure APM agents with central config
- Control access to APM data
- Create an alert
- Create custom links
- Filter data
- Find transaction latency and failure correlations
- Identify deployment details for APM agents
- Integrate with machine learning
- Observe Lambda functions
- Query your data
- Storage Explorer
- Track deployments with annotations
- Users and privileges
- Settings
- REST API
- Troubleshooting
- Security
- Dev Tools
- Fleet
- Osquery
- Stack Monitoring
- Stack Management
- REST API
- Get features API
- Kibana spaces APIs
- Kibana role management APIs
- User session management APIs
- Saved objects APIs
- Data views API
- Index patterns APIs
- Alerting APIs
- Action and connector APIs
- Cases APIs
- Add comment
- Create case
- Delete cases
- Delete comments
- Find case activity
- Find cases
- Find connectors
- Get alerts
- Get case activity
- Get case
- Get case status
- Get cases by alert
- Get comments
- Get configuration
- Get reporters
- Get tags
- Push case
- Set configuration
- Update cases
- Update comment
- Update configuration
- Import and export dashboard APIs
- Logstash configuration management APIs
- Machine learning APIs
- Osquery manager API
- Short URLs APIs
- Get Task Manager health
- Upgrade assistant APIs
- Kibana plugins
- Troubleshooting
- Accessibility
- Release notes
- Kibana 8.9.2
- Kibana 8.9.1
- Kibana 8.9.0
- Kibana 8.8.2
- Kibana 8.8.1
- Kibana 8.8.0
- Kibana 8.7.1
- Kibana 8.7.0
- Kibana 8.6.1
- Kibana 8.6.0
- Kibana 8.5.2
- Kibana 8.5.1
- Kibana 8.5.0
- Kibana 8.4.3
- Kibana 8.4.2
- Kibana 8.4.1
- Kibana 8.4.0
- Kibana 8.3.3
- Kibana 8.3.2
- Kibana 8.3.1
- Kibana 8.3.0
- Kibana 8.2.3
- Kibana 8.2.2
- Kibana 8.2.1
- Kibana 8.2.0
- Kibana 8.1.3
- Kibana 8.1.2
- Kibana 8.1.1
- Kibana 8.1.0
- Kibana 8.0.0
- Kibana 8.0.0-rc2
- Kibana 8.0.0-rc1
- Kibana 8.0.0-beta1
- Kibana 8.0.0-alpha2
- Kibana 8.0.0-alpha1
- Developer guide
Filter dashboard data with controls
editFilter dashboard data with controls
editControls are interactive panels you add to your dashboards to filter and display only the data you want to explore.
There are three types of controls:
-
Options list — Adds a dropdown that allows you to filter the data with one or more options that you select.
For example, if you are using the [Logs] Web Traffic dashboard from the sample web logs data, you can add an options list for the
machine.os.keywordfield that allows you to display only the logs generated fromosxandiosoperating systems.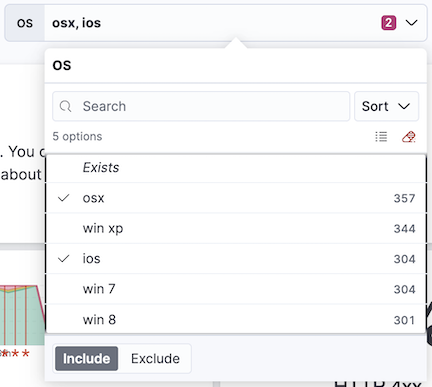
-
Range slider — Adds a slider that allows you to filter the data within a specified range of values.
For example, if you are using the [Logs] Web Traffic dashboard from the sample web logs data, you can add a range slider for the
hour_of_dayfield that allows you to display only the log data from 9:00AM to 5:00PM.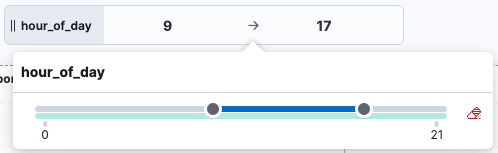
-
Time slider — Adds a time range slider that allows you to filter the data within a specified range of time, advance the time range backward and forward, and animate your change in data over the specified time range.
For example, you are using the [Logs] Web Traffic dashboard from the sample web logs data, and the global time filter is Last 7 days. When you add the time slider, you can click the previous and next buttons to advance the time range backward or forward, and click the play button to watch how the data changes over the last 7 days.
Create and add Options list and Range slider controls
editTo add interactive Options list and Range slider controls, create the controls, then add them to your dashboard.
-
Open or create a new dashboard.
- If you are adding a Control to an existing dashboard, click Edit, click Controls in the dashboard toolbar, then select Add control.
- If you are adding a Control to a new dashboard, click Controls in the dashboard toolbar, then select Add control.
- From the Data view dropdown, select the data view with the field you want to appear in the Control.
-
In the Field list, select the field with the documents you want to filter.
The Control type is automatically applied for the field you selected.
- In the Label field, enter a clear and self-explanatory label.
-
Select the control width:
- To specify the control size, select the Minimum width.
- To expand the width of the control to fit the available space on the dashboard, select Expand width to fit available space.
-
If you are creating an Options list, specify the additional settings:
- To allow multiple options to be selected in the dropdown, select Allow multiple selections in dropdown.
- To populate the entire list of options, even when the list takes longer to populate than expected, select Ignore timeout for results.
- Click Save and close.
Add time slider controls
editTo add interactive time slider controls, create the control, then add it to your dashboard.
- Open or create a new dashboard.
- In the dashboard toolbar, click Controls, then select Add time slider control.
- The time slider control uses the time range from the global time filter. To change the time range in the time slider control, change the global time filter.
- Save the dashboard.
Filter the data with Options list controls
editFilter the data with one or more options that you select.
- Open the Options list dropdown.
-
Select the available options.
The Exists query returns all documents that contain an indexed value for the field.
-
Select how to filter the options.
- To display only the data for the options you selected, click Include.
- To exclude the data for the options you selected, click Exclude.
-
To clear the selections, click
 .
.
-
To display only the options you selected in the dropdown, click
 .
.
Filter the data with Range slider controls
editFilter the data within a specified range of values.
- On the Range slider, click a value.
-
Move the sliders to specify the values you want to display.
The dashboard displays only the data for the range of values you specified.
-
To clear the specified values, click .
Filter the data with time slider controls
editFilter the data within a specified range of time.
- To view a different time range, click the time slider, then move the sliders to specify the time range you want to display.
-
To advance the time range forward, click
 .
.
-
To advance the time range backward, click
 .
.
-
To animate the data changes over time, click
 .
.
-
To clear the specified values, click .
Configure the controls settings
edit- In the dashboard toolbar, click Controls, then select Settings.
-
On the Control settings flyout, configure the settings:
- Label position — Specifies where the label appears on the control.
- Validate user selections — When selected, any selected option that results in no data is ignored.
- Chain controls — When selected, any selected options in one control narrows the available options in the next control.
- To remove all controls from the dashboard, click Delete all.
- Click Save and close.
Edit Options list and Range slider control settings
editChange the settings for the Options list and Range slider controls.
-
Hover over the control you want to edit, then click
 .
.
- On the Edit control flyout, change the options, then click Save and close.
Remove controls
editRemove controls from your dashboard.
-
Hover over the control you want to remove, then click
 .
.
- On the Delete control? window, click Delete.
On this page