- Introducing Elasticsearch Service
- Adding data to Elasticsearch
- Migrating data
- Ingesting data from your application
- Ingest data with Node.js on Elasticsearch Service
- Ingest data with Python on Elasticsearch Service
- Ingest data from Beats to Elasticsearch Service with Logstash as a proxy
- Ingest data from a relational database into Elasticsearch Service
- Ingest logs from a Python application using Filebeat
- Ingest logs from a Node.js web application using Filebeat
- Configure Beats and Logstash with Cloud ID
- Best practices for managing your data
- Configure index management
- Enable cross-cluster search and cross-cluster replication
- Access other deployments of the same Elasticsearch Service organization
- Access deployments of another Elasticsearch Service organization
- Access deployments of an Elastic Cloud Enterprise environment
- Access clusters of a self-managed environment
- Enabling CCS/R between Elasticsearch Service and ECK
- Edit or remove a trusted environment
- Migrate the cross-cluster search deployment template
- Manage data from the command line
- Preparing a deployment for production
- Securing your deployment
- Monitoring your deployment
- Monitor with AutoOps
- Configure Stack monitoring alerts
- Access performance metrics
- Keep track of deployment activity
- Diagnose and resolve issues
- Diagnose unavailable nodes
- Why are my shards unavailable?
- Why is performance degrading over time?
- Is my cluster really highly available?
- How does high memory pressure affect performance?
- Why are my cluster response times suddenly so much worse?
- How do I resolve deployment health warnings?
- How do I resolve node bootlooping?
- Why did my node move to a different host?
- Snapshot and restore
- Managing your organization
- Your account and billing
- Billing Dimensions
- Billing models
- Using Elastic Consumption Units for billing
- Edit user account settings
- Monitor and analyze your account usage
- Check your subscription overview
- Add your billing details
- Choose a subscription level
- Check your billing history
- Update billing and operational contacts
- Stop charges for a deployment
- Billing FAQ
- Elasticsearch Service hardware
- Elasticsearch Service GCP instance configurations
- Elasticsearch Service GCP default provider instance configurations
- Elasticsearch Service AWS instance configurations
- Elasticsearch Service AWS default provider instance configurations
- Elasticsearch Service Azure instance configurations
- Elasticsearch Service Azure default provider instance configurations
- Change hardware for a specific resource
- Elasticsearch Service regions
- About Elasticsearch Service
- RESTful API
- Release notes
- March 25, 2025
- Enhancements and bug fixes - March 2025
- Enhancements and bug fixes - February 2025
- Enhancements and bug fixes - January 2025
- Enhancements and bug fixes - December 2024
- Enhancements and bug fixes - November 2024
- Enhancements and bug fixes - Late October 2024
- Enhancements and bug fixes - Early October 2024
- Enhancements and bug fixes - September 2024
- Enhancements and bug fixes - Late August 2024
- Enhancements and bug fixes - Early August 2024
- Enhancements and bug fixes - July 2024
- Enhancements and bug fixes - Late June 2024
- Enhancements and bug fixes - Early June 2024
- Enhancements and bug fixes - Early May 2024
- Bring your own key, and more
- AWS region EU Central 2 (Zurich) now available
- GCP region Middle East West 1 (Tel Aviv) now available
- Enhancements and bug fixes - March 2024
- Enhancements and bug fixes - January 2024
- Enhancements and bug fixes
- Enhancements and bug fixes
- Enhancements and bug fixes
- Enhancements and bug fixes
- AWS region EU North 1 (Stockholm) now available
- GCP regions Asia Southeast 2 (Indonesia) and Europe West 9 (Paris)
- Enhancements and bug fixes
- Enhancements and bug fixes
- Bug fixes
- Enhancements and bug fixes
- Role-based access control, and more
- Newly released deployment templates for Integrations Server, Master, and Coordinating
- Enhancements and bug fixes
- Enhancements and bug fixes
- Enhancements and bug fixes
- Enhancements and bug fixes
- Enhancements and bug fixes
- Enhancements and bug fixes
- Enhancements and bug fixes
- Enhancements and bug fixes
- Enhancements and bug fixes
- Enhancements and bug fixes
- Cross environment search and replication, and more
- Enhancements and bug fixes
- Enhancements and bug fixes
- Azure region Canada Central (Toronto) now available
- Azure region Brazil South (São Paulo) now available
- Azure region South Africa North (Johannesburg) now available
- Azure region Central India (Pune) now available
- Enhancements and bug fixes
- Azure new virtual machine types available
- Billing Costs Analysis API, and more
- Organization and billing API updates, and more
- Integrations Server, and more
- Trust across organizations, and more
- Organizations, and more
- Elastic Consumption Units, and more
- AWS region Africa (Cape Town) available
- AWS region Europe (Milan) available
- AWS region Middle East (Bahrain) available
- Enhancements and bug fixes
- Enhancements and bug fixes
- GCP Private Link, and more
- Enhancements and bug fixes
- GCP region Asia Northeast 3 (Seoul) available
- Enhancements and bug fixes
- Enhancements and bug fixes
- Native Azure integration, and more
- Frozen data tier and more
- Enhancements and bug fixes
- Azure region Southcentral US (Texas) available
- Azure region East US (Virginia) available
- Custom endpoint aliases, and more
- Autoscaling, and more
- Cross-region and cross-provider support, warm and cold data tiers, and more
- Better feature usage tracking, new cost and usage analysis page, and more
- New features, enhancements, and bug fixes
- AWS region Asia Pacific (Hong Kong)
- Enterprise subscription self service, log in with Microsoft, bug fixes, and more
- SSO for Enterprise Search, support for more settings
- Azure region Australia East (New South Wales)
- New logging features, better GCP marketplace self service
- Azure region US Central (Iowa)
- AWS region Asia Pacific (Mumbai)
- Elastic solutions and Microsoft Azure Marketplace integration
- AWS region Pacific (Seoul)
- AWS region EU West 3 (Paris)
- Traffic management and improved network security
- AWS region Canada (Central)
- Enterprise Search
- New security setting, in-place configuration changes, new hardware support, and signup with Google
- Azure region France Central (Paris)
- Regions AWS US East 2 (Ohio) and Azure North Europe (Ireland)
- Our Elasticsearch Service API is generally available
- GCP regions Asia East 1 (Taiwan), Europe North 1 (Finland), and Europe West 4 (Netherlands)
- Azure region UK South (London)
- GCP region US East 1 (South Carolina)
- GCP regions Asia Southeast 1 (Singapore) and South America East 1 (Sao Paulo)
- Snapshot lifecycle management, index lifecycle management migration, and more
- Azure region Japan East (Tokyo)
- App Search
- GCP region Asia Pacific South 1 (Mumbai)
- GCP region North America Northeast 1 (Montreal)
- New Elastic Cloud home page and other improvements
- Azure regions US West 2 (Washington) and Southeast Asia (Singapore)
- GCP regions US East 4 (N. Virginia) and Europe West 2 (London)
- Better plugin and bundle support, improved pricing calculator, bug fixes, and more
- GCP region Asia Pacific Southeast 1 (Sydney)
- Elasticsearch Service on Microsoft Azure
- Cross-cluster search, OIDC and Kerberos authentication
- AWS region EU (London)
- GCP region Asia Pacific Northeast 1 (Tokyo)
- Usability improvements and Kibana bug fix
- GCS support and private subscription
- Elastic Stack 6.8 and 7.1
- ILM and hot-warm architecture
- Elasticsearch keystore and more
- Trial capacity and more
- APM Servers and more
- Snapshot retention period and more
- Improvements and snapshot intervals
- SAML and multi-factor authentication
- Next generation of Elasticsearch Service
- Branding update
- Minor Console updates
- New Cloud Console and bug fixes
- What’s new with the Elastic Stack
Diagnose unavailable nodes
editDiagnose unavailable nodes
editThis section provides a list of common symptoms and possible actions that you can take to resolve issues when one or more nodes become unhealthy or unavailable. This guide is particularly useful if you are not shipping your logs and metrics to a dedicated monitoring cluster.
What are the symptoms?
What is the impact?
- Only some search results are successful
- Ingesting, updating, and deleting data do not work
- Most Elasticsearch API requests fail
Some actions described here, such as stopping indexing or Machine Learning jobs, are temporary remediations intended to get your cluster into a state where you can make configuration changes to resolve the issue.
For production deployments, we recommend setting up a dedicated monitoring cluster to collect metrics and logs, troubleshooting views, and cluster alerts.
If your issue is not addressed here, then contact Elastic support for help.
Full disk on single-node deployment
editHealth check
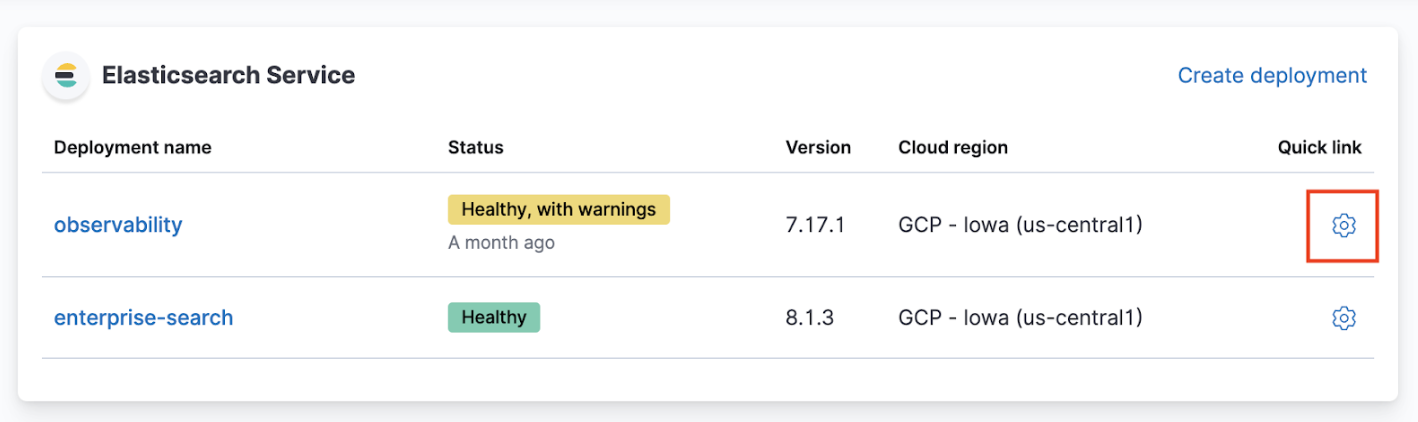
- Log in to the Elasticsearch Service Console.
-
From the Elasticsearch Service panel, click the Quick link icon corresponding to the deployment that you want to manage.
-
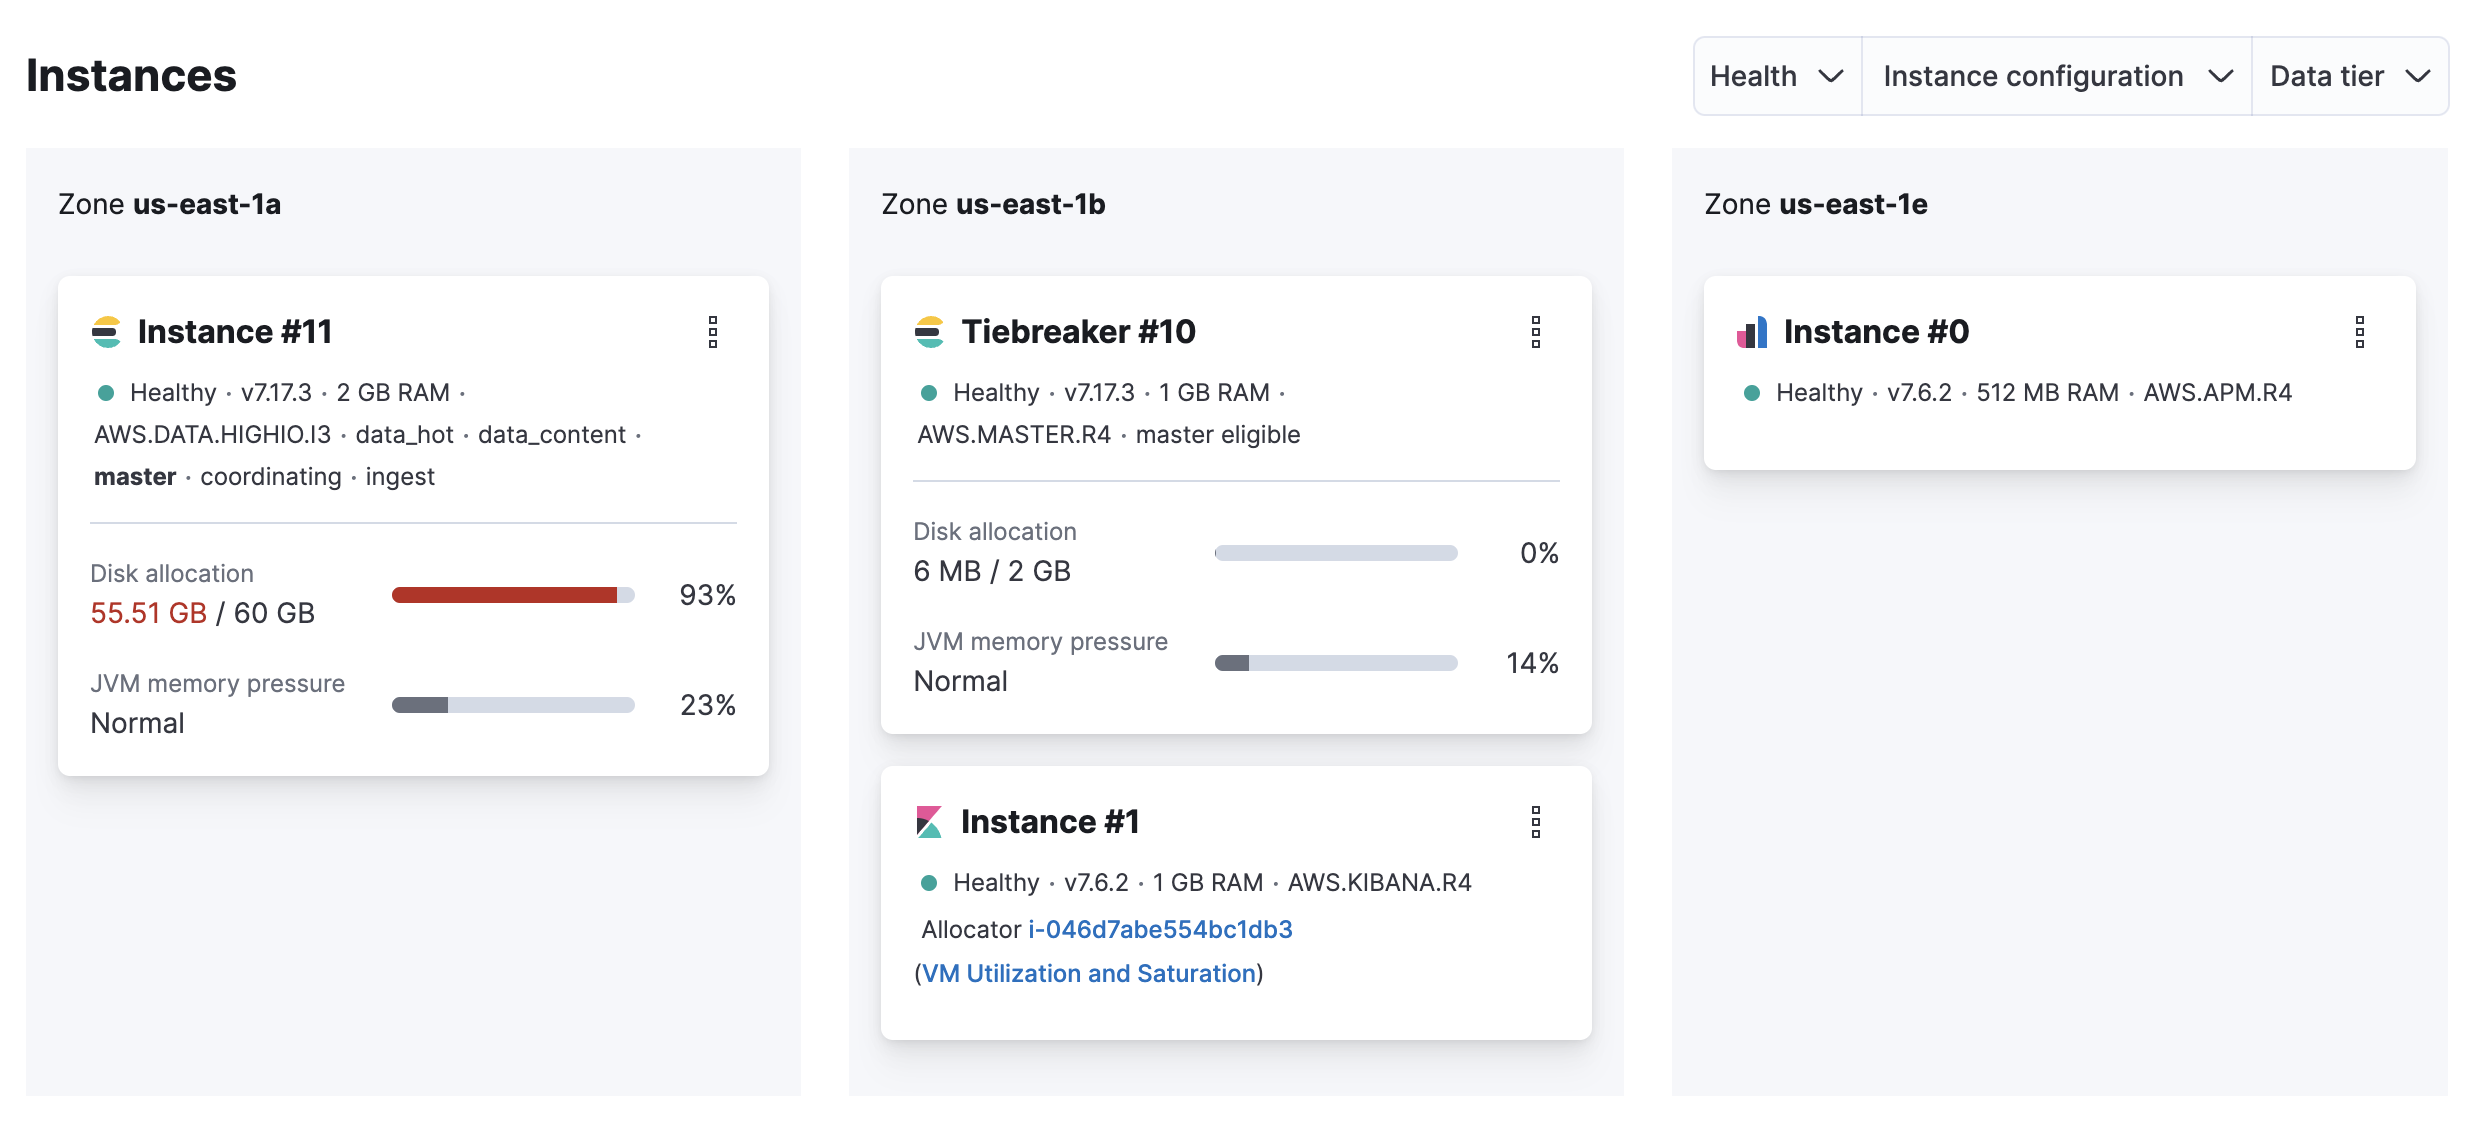
On your deployment page, scroll down to Instances and check if the disk allocation for your Elasticsearch instance is over 90%.
Possible cause
- The available storage is insufficient for the amount of ingested data.
Resolution
- Delete unused data.
- Increase the disk size on your Hot data and Content tier (scale up).
If your Elasticsearch cluster is unhealthy and reports a status of red, then increasing the disk size of your Hot data and Content tier may fail. You might need to delete some data so the configuration can be edited. If you want to increase your disk size without deleting data, then reach out to Elastic support and we will assist you with scaling up.
Preventions
-
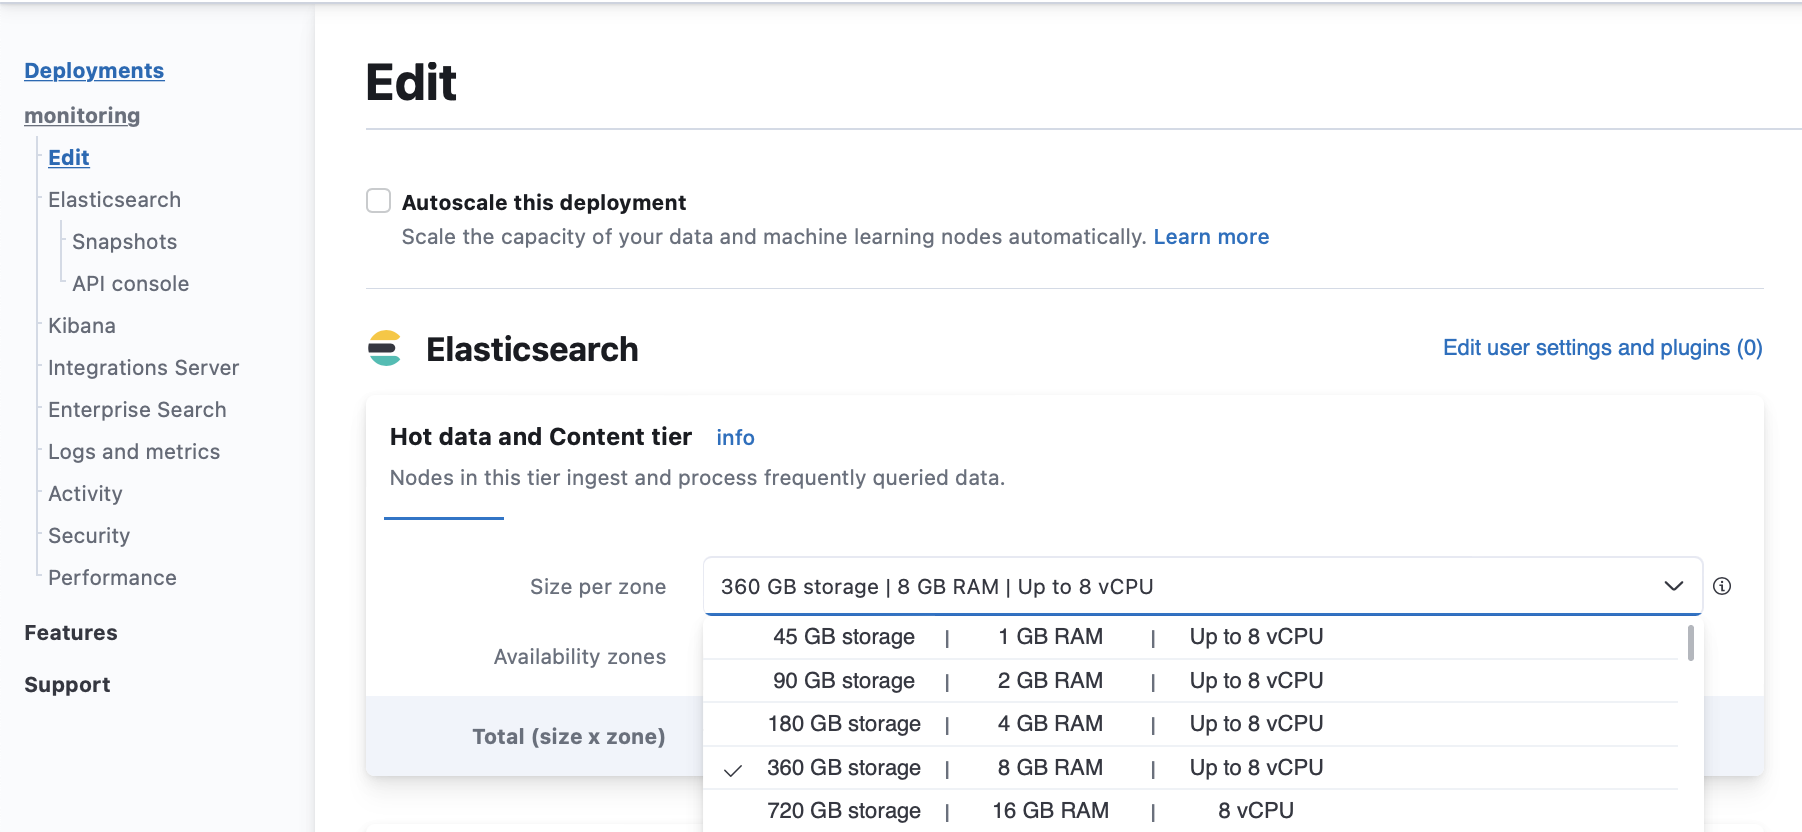
Increase the disk size on your Hot data and Content tier (scale up).
From your deployment menu, go to the Edit page and increase the Size per zone for your Hot data and Content tiers.
- Enable autoscaling to grow your cluster automatically when it runs out of space.
- Configure ILM policies to automatically delete unused data.
- Add nodes to your Elasticsearch cluster and enable data tiers to move older data that you don’t query often to more cost-effective storage.
Full disk on multiple-nodes deployment
editHealth check
- Log in to the Elasticsearch Service Console.
-
From the Elasticsearch Service panel, click the Quick link icon corresponding to the deployment that you want to manage.
-
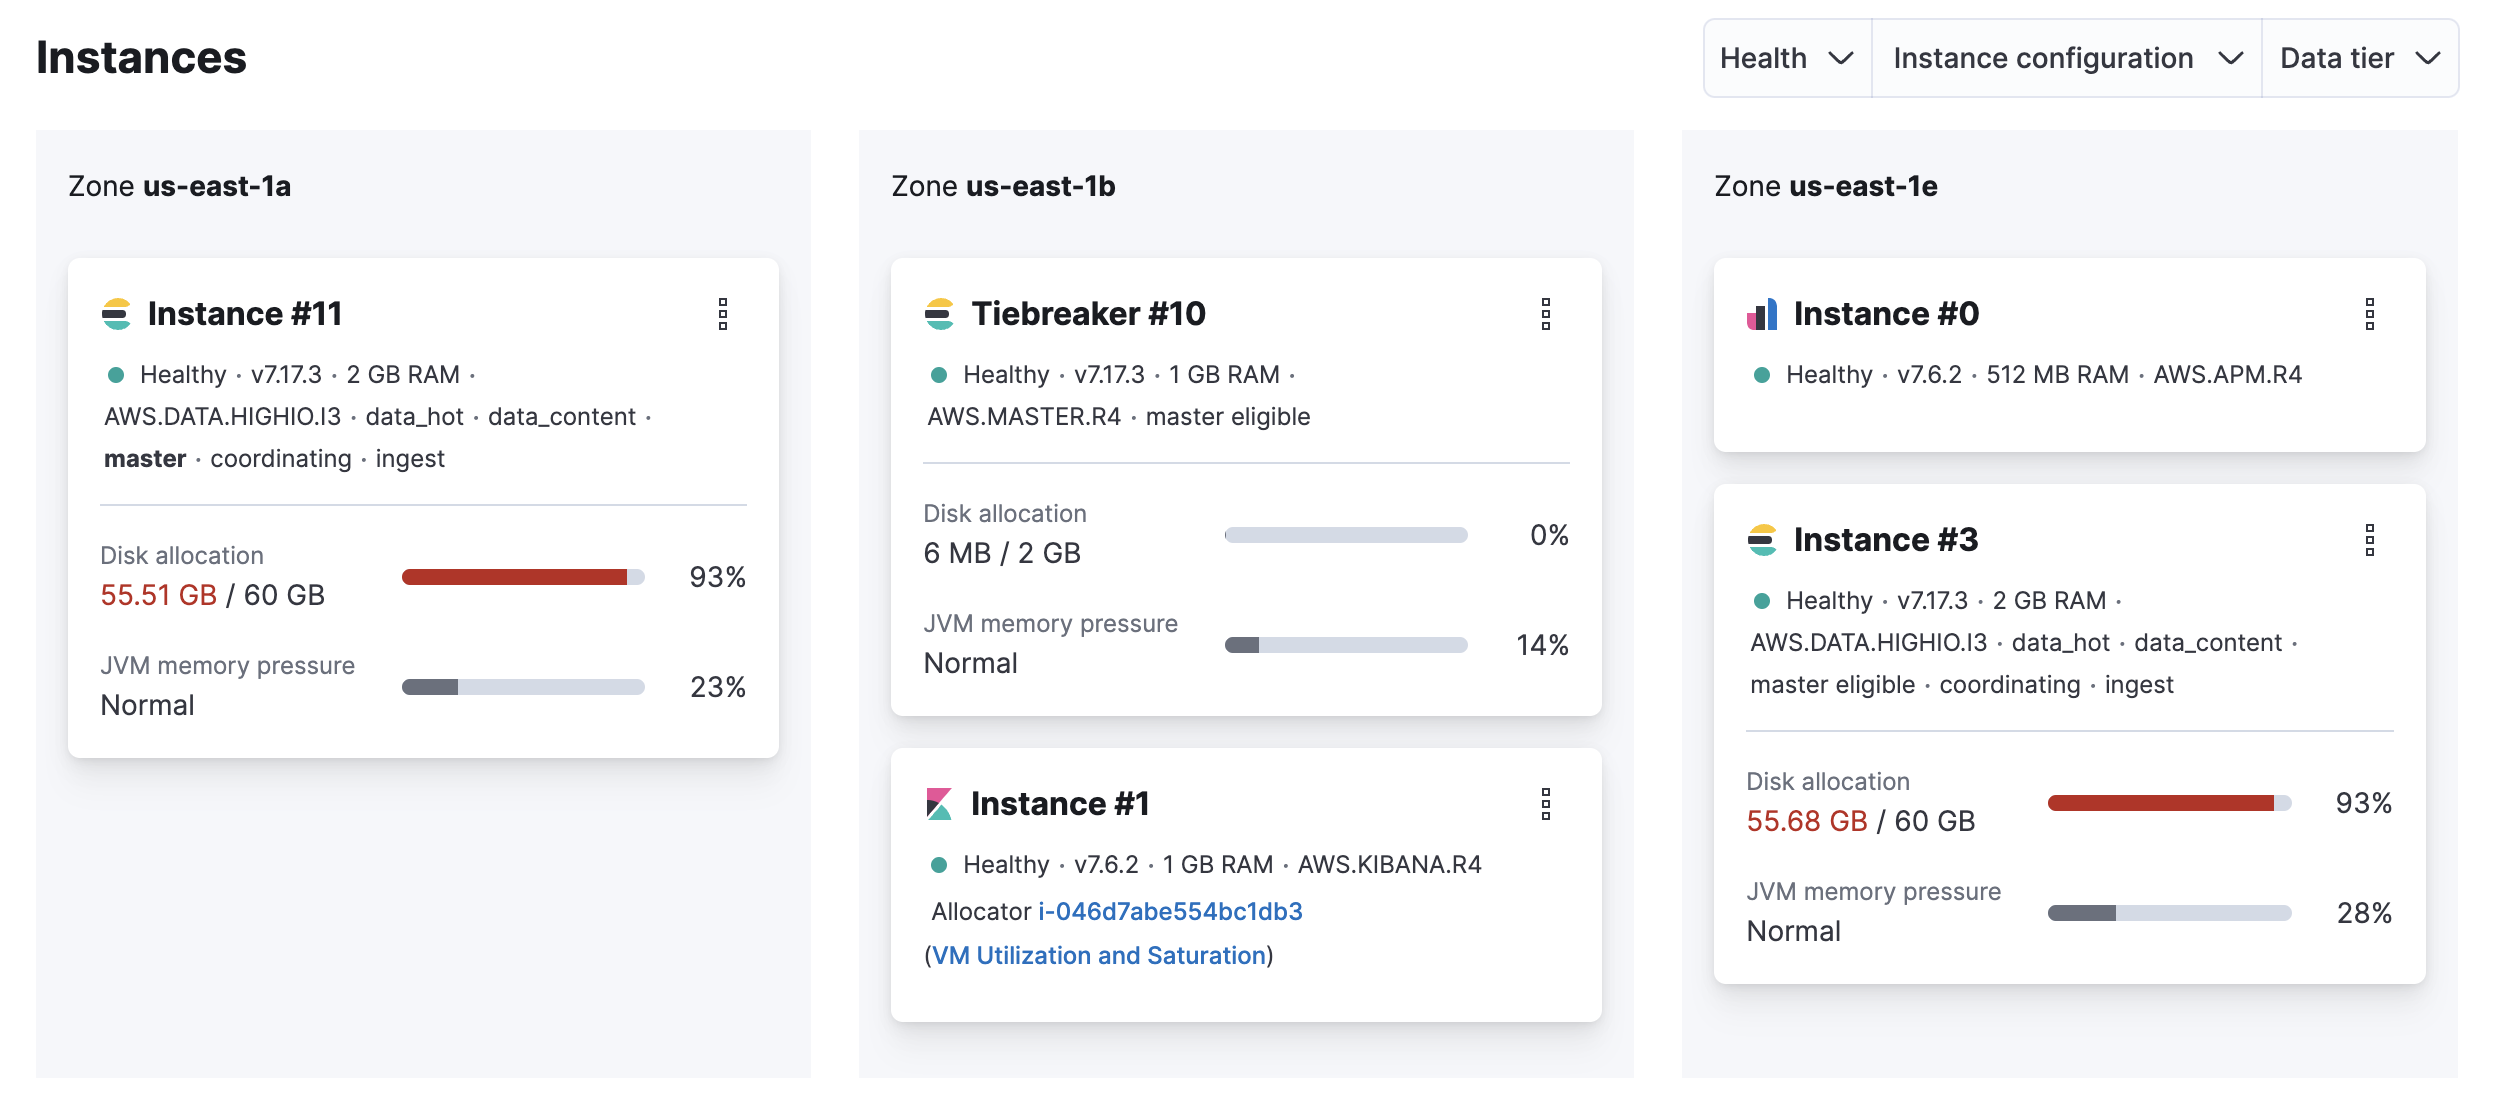
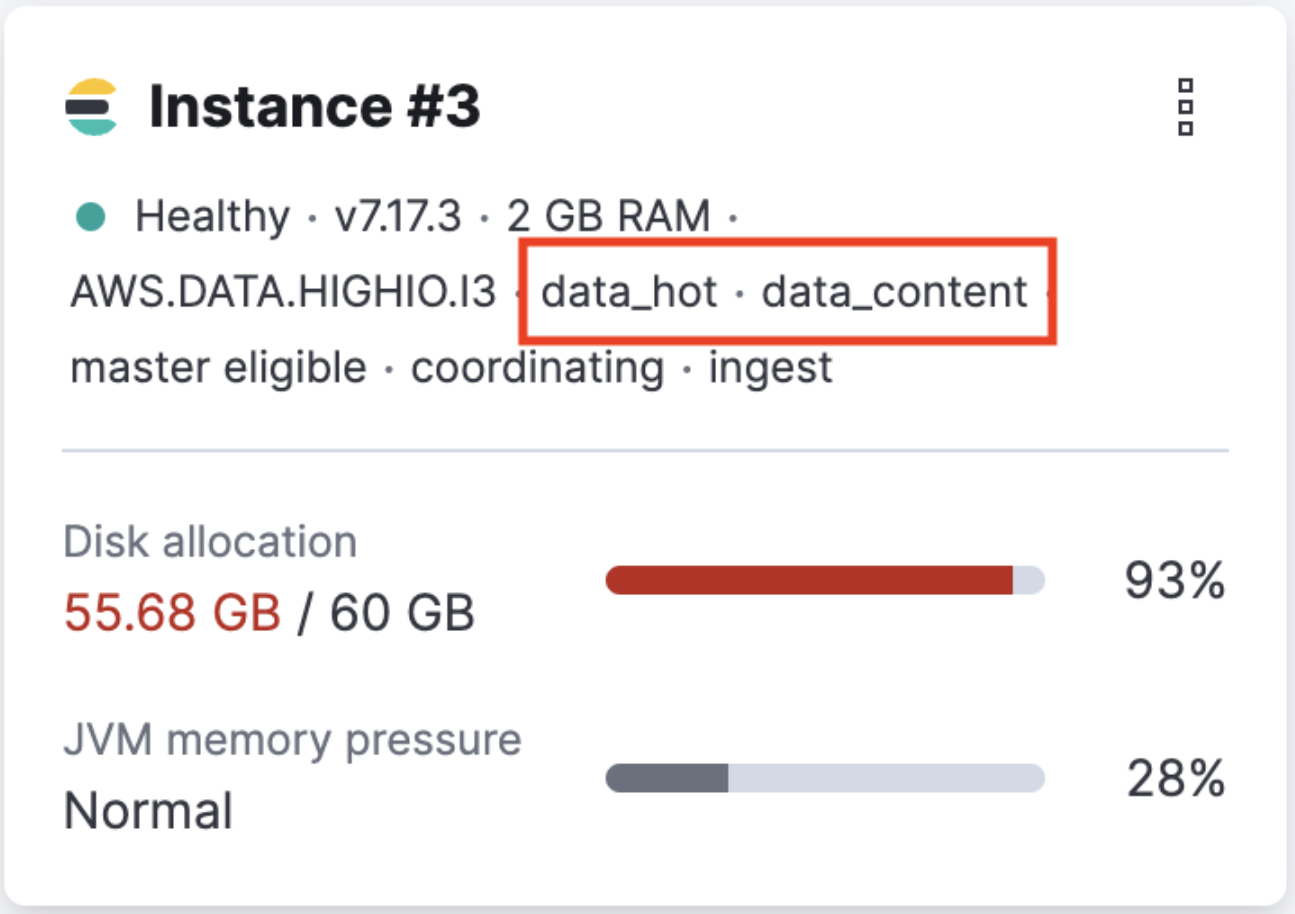
On your deployment page, scroll down to Instances and check if the disk allocation for any of your Elasticsearch instances is over 90%.
Possible cause
- The available storage is insufficient for the amount of ingested data.
Resolution
- Delete unused data.
- Increase the disk size (scale up).
If your Elasticsearch cluster is unhealthy and reports a status of red, the scale up configuration change to increasing disk size on the affected data tiers may fail. You might need to delete some data so the configuration can be edited. If you want to increase your disk size without deleting data, then reach out to Elastic support and we will assist you with scaling up.
Preventions
-
Increase the disk size (scale up).
-
On your deployment page, scroll down to Instances and identify the node attribute of the instances that are running out of disk space.
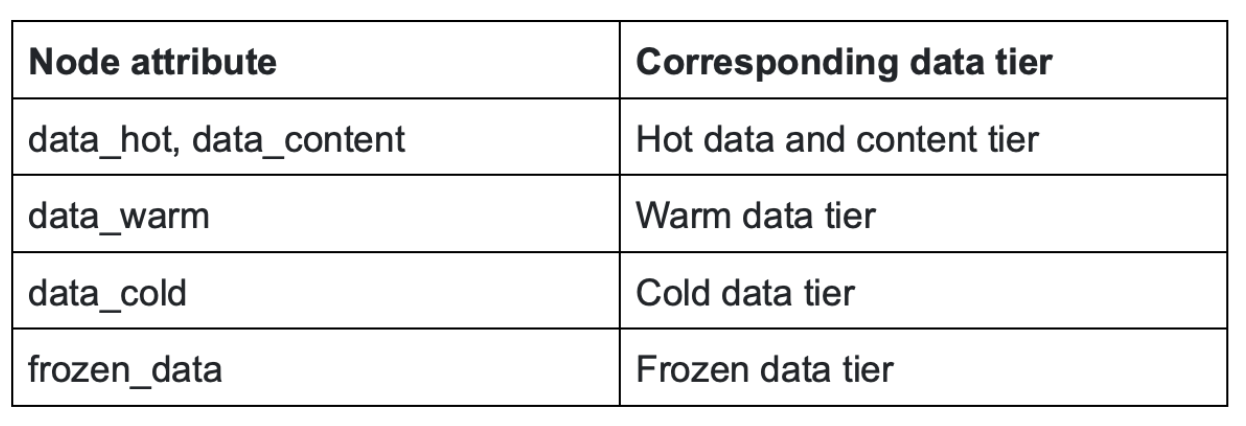
-
Use the node types identified at step 1 to find out the corresponding data tier.
-
From your deployment menu, go to the Edit page and increase the Size per zone for the data tiers identified at step 2.
-
- Enable autoscaling to grow your cluster automatically when it runs out of space.
- Configure ILM policies to automatically delete unused data.
- Enable data tiers to move older data that you don’t query often to more cost-effective storage.
JVM heap usage exceeds the allowed threshold on master nodes
editHealth check
- Log in to the Elasticsearch Service Console.
-
From the Elasticsearch Service panel, click the Quick link icon corresponding to the deployment that you want to manage.
-
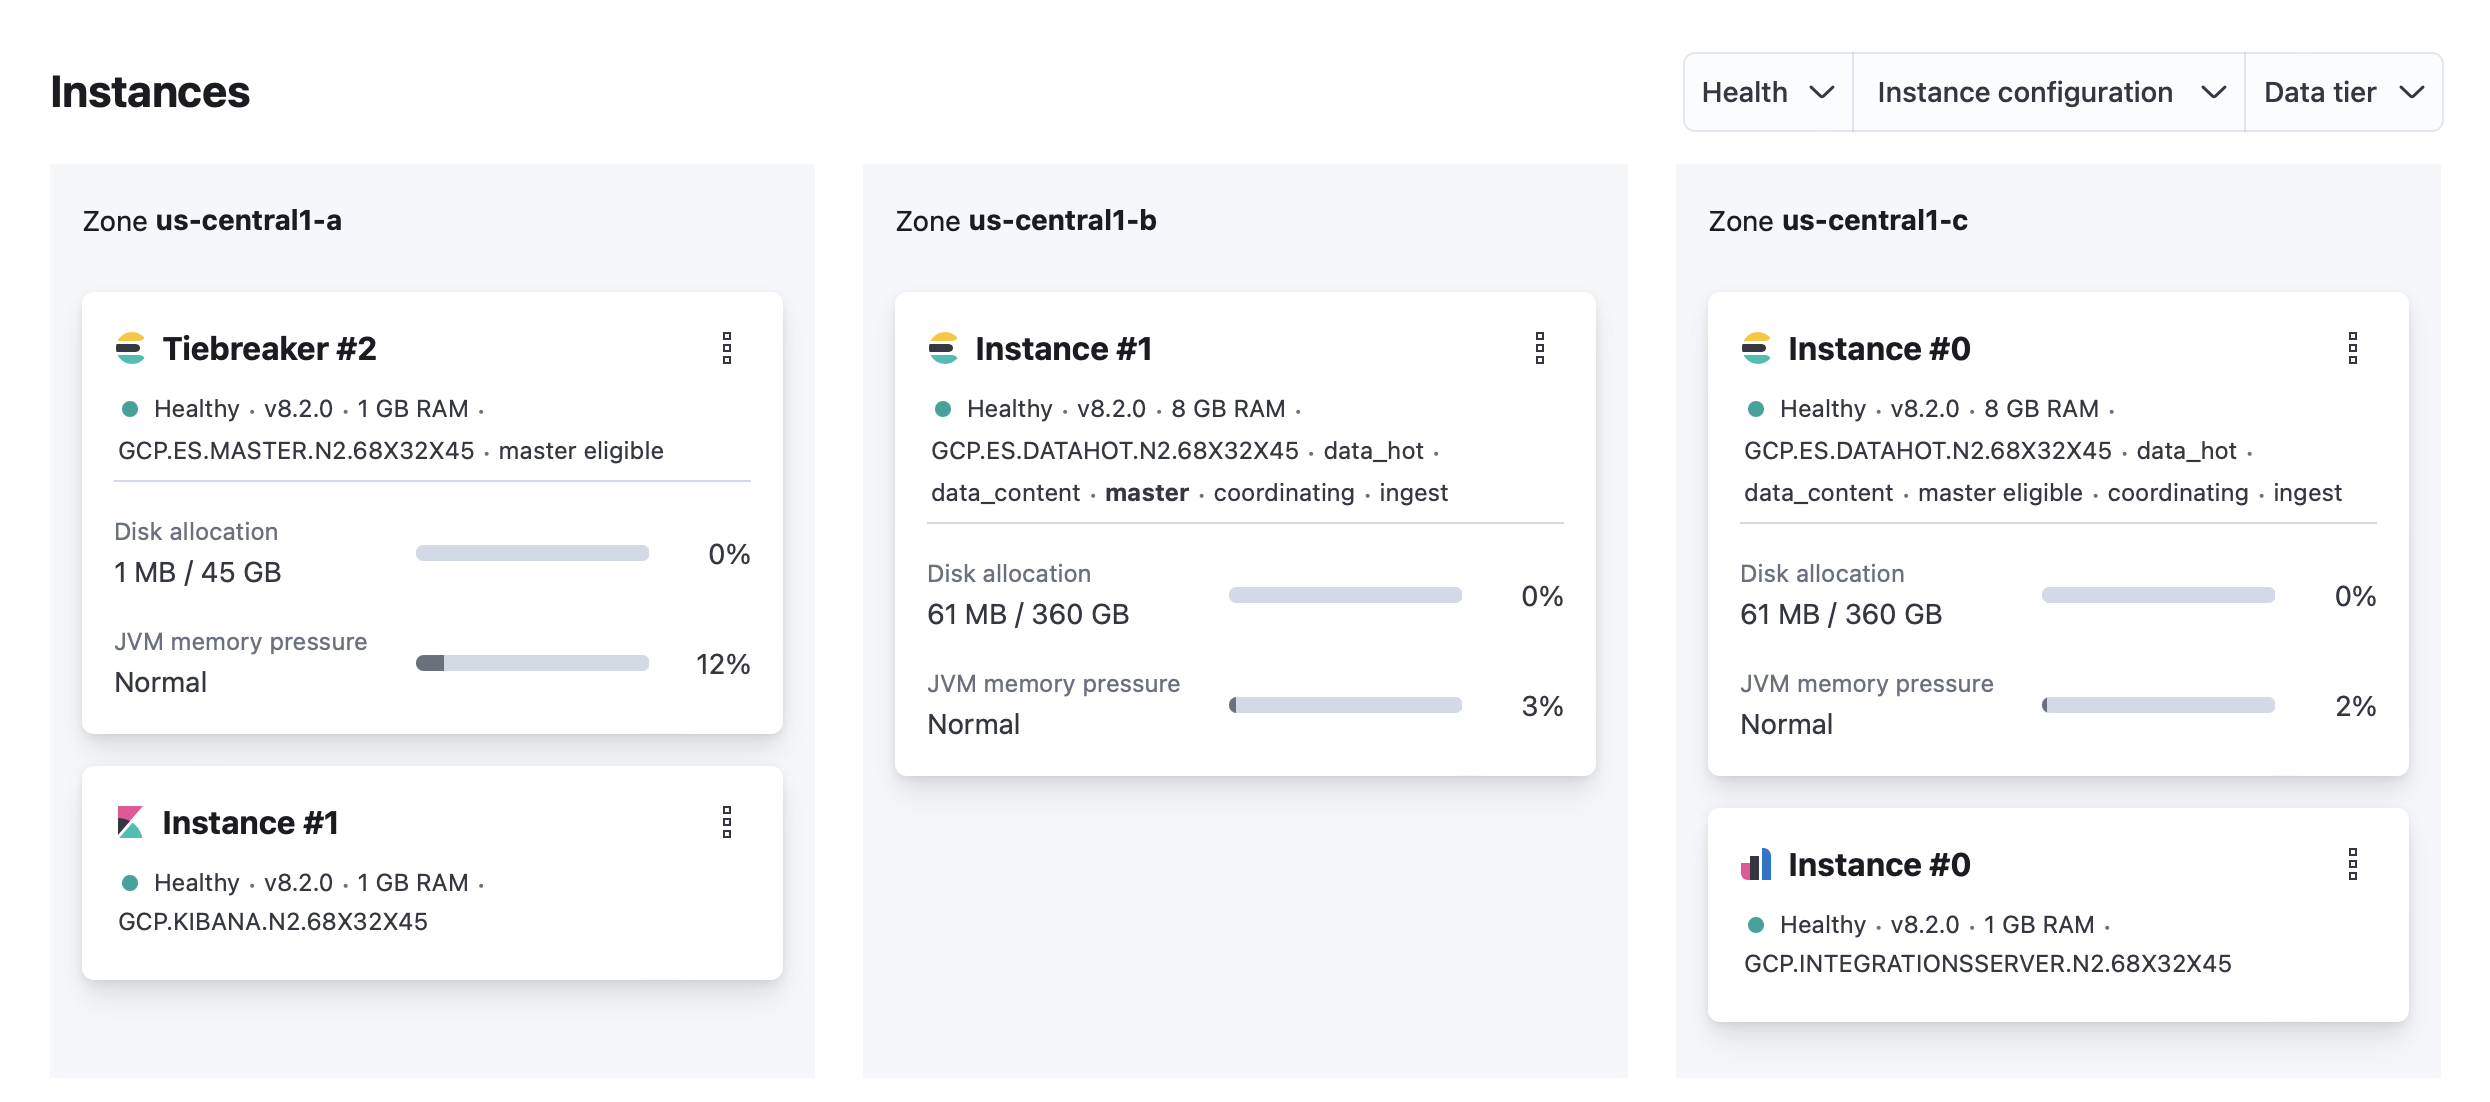
On your deployment page, scroll down to Instances and check if the JVM memory pressure for your Elasticsearch instances is high.
Possible causes
-
The master node is overwhelmed by a large number of snapshots or shards.
-
External tasks initiated by clients
- Index, search, update
- Frequent template updates due to the Beats configuration
-
Internal tasks initiated by users
- Machine Learning jobs, watches, monitoring, ingest pipeline
-
Internal tasks initiated by Elasticsearch
- Nodes joining and leaving due to hardware failures
- Shard allocation due to nodes joining and leaving
- Configuration of ILM policies.
-
Resolutions
-
If the master node is overwhelmed by external tasks initiated by clients:
Investigate which clients might be overwhelming the cluster and reduce the request rate or pause ingesting, searching, or updating from the client. If you are using Beats, temporarily stop the Beat that’s overwhelming the cluster to avoid frequent template updates.
-
If the master node is overwhelmed by internal tasks initiated by users:
- Check cluster-level pending tasks.
- Reduce the number of Machine Learning jobs or watches.
- Change the number of ingest pipelines or processors to use less memory.
-
If the master node is overwhelmed by internal tasks initiated by Elasticsearch:
- For nodes joining and leaving, this should resolve itself. If increasing the master nodes size doesn’t resolve the issue, contact support.
-
For shard allocation, inspect the progress of shards recovery.
-
Make sure
indices.recovery.max_concurrent_operationsis not aggressive, which could cause the master to be unavailable. -
Make sure
indices.recovery.max_bytes_per_secis set adequately to avoid impact on ingest and search workload.
-
Make sure
- Check ILM policies to avoid index rollover and relocate actions that are concurrent and aggressive.
- If the master node is overwhelmed by a large number of snapshots, reduce the number of snapshots in the repo.
- If the master node is overwhelmed by a large number of shards, delete unneeded indices and shrink read-only indices to fewer shards. For more information, check Reduce a cluster’s shard count.
CPU usage exceeds the allowed threshold on master nodes
editHealth check
By default, the allowed CPU usage threshold is set at 85%.
- Log in to the Elasticsearch Service Console.
-
From the Elasticsearch Service panel, click the Quick link icon corresponding to the deployment that you want to manage.
-
Identify the IDs of your master nodes. On your deployment page, scroll down to Instances and filter your instance configuration by master. The IDs of your master nodes are in the title. In this example, the IDs are 21, 26 and 27:
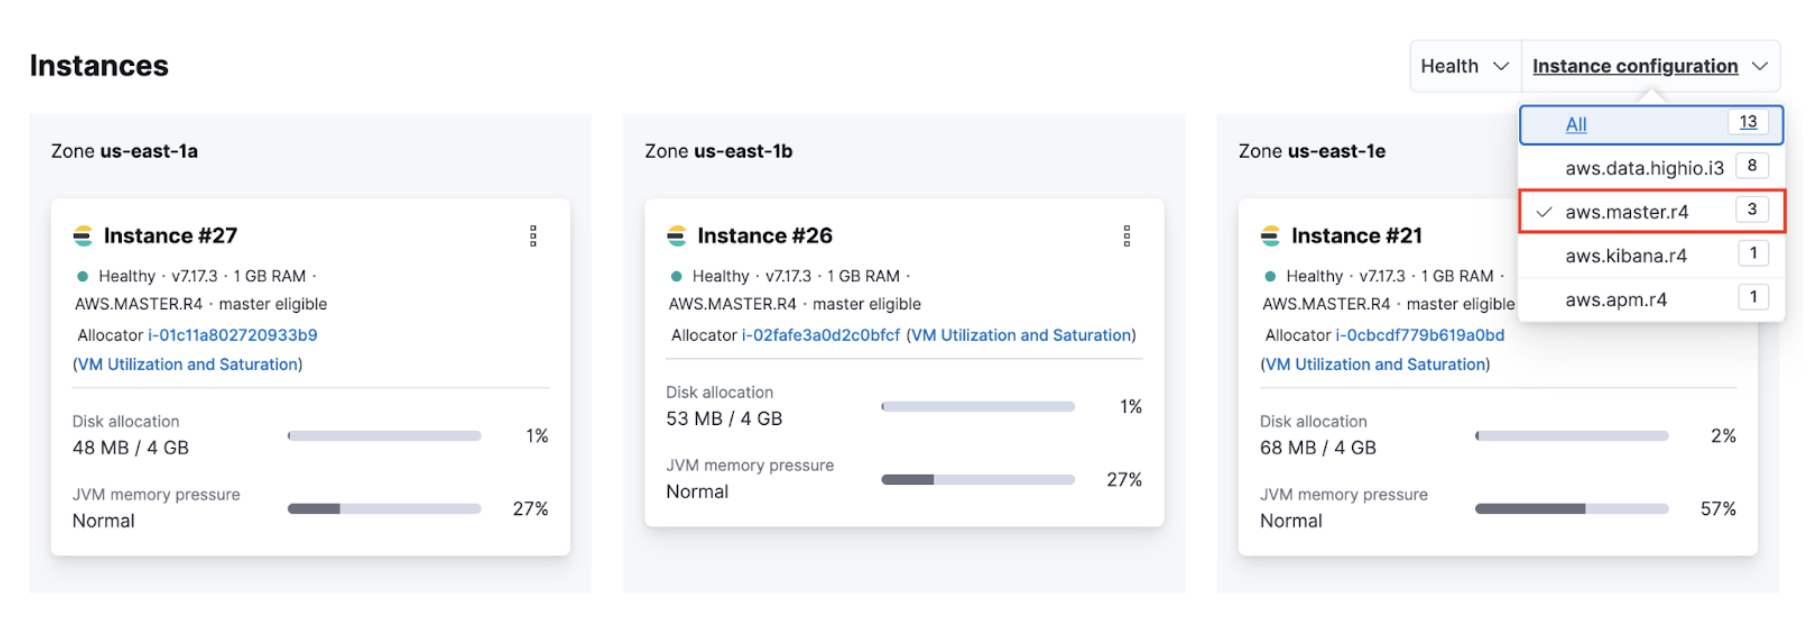
The name of the instance configuration might differ depending on the cloud provider.
-
Navigate to the Performance page of your deployment. Check if the CPU usage of your master nodes exceeds 85%. Your master node has the format
instance-<ID>`, where<ID>`is the ID of the master node.
If you use Stack Monitoring, open Kibana from your deployment page and select Stack Monitoring from the menu or the search bar.
Stack Monitoring comes with out-of-the-box rules, but you need to enable them when prompted.
Possible causes
- The master node is overwhelmed by a large number of snapshots or shards.
-
The memory available on the master node is overwhelmed by these tasks:
-
External tasks initiated by clients
- Index, search, update
- Frequent template updates due to the Beats configuration
-
Internal tasks initiated by users
- Machine Learning jobs, watches, monitoring, ingest pipelines
-
Internal tasks initiated by Elasticsearch
- Nodes joining and leaving due to hardware failures
- Shard allocation due to nodes joining and leaving
- Configuration of ILM policies.
-
Resolutions
- Navigate to the Edit page of your deployment and increase the master node size.
- Upgrade the cluster to the latest version.
-
If the master node is overwhelmed by external tasks initiated by clients:
- Reduce the request rate or pause ingesting, searching, or updating from the client.
- Enable ingest and search-based autoscaling.
- Stop Beats to avoid frequent template updates.
-
If the master node is overwhelmed by internal tasks initiated by users:
- Check cluster-level pending tasks.
- Reduce the number of Machine Learning jobs or watches.
- Change the number of ingest pipelines or processors to use less memory.
-
If the master node is overwhelmed by internal tasks initiated by Elasticsearch:
- For nodes joining and leaving, this should resolve itself. If increasing the master nodes size doesn’t resolve the issue, contact support.
-
For shard allocation, inspect the progress of shards recovery. If there’s no progress, contact support.
-
Make sure
indices.recovery.max_concurrent_operationsis not aggressive, which could cause the master to be unavailable. -
Make sure
indices.recovery.max_bytes_per_secis set adequately to avoid impact on ingest and search workload.
-
Make sure
- Check ILM policies to avoid index rollover and relocate actions that are concurrent and aggressive.
- If the master node is overwhelmed by a large number of snapshots, reduce the number of snapshots in the repo.
- If the master node is overwhelmed by a large number of shards, reduce the number of shards on the node. For more information, check Size your shards.
Some nodes are unavailable and are displayed as missing
editHealth check
- Use the Metrics inventory to identify unavailable or unhealthy nodes. If the number of minimum master nodes is down, Elasticsearch is not available.
Possible causes
- Hardware issue.
- Routing has stopped because of a previous ES configuration failure.
- Disk/memory/CPU are saturated.
- The network is saturated or disconnected.
- Nodes are unable to join.
Resolutions
- Hardware issue: Any unhealthy hardware detected by the platform is automatically vacated within the hour. If this doesn’t happen, contact support.
- Routing stopped: A failed Elasticsearch configuration might stop the nodes routing. Restart the routing manually to bring the node back to health.
-
Disk/memory/CPU saturated:
- Delete unused data.
- Increase disk size.
- Enable autoscaling.
- Configuration of ILM policies.
- Manage data tiers.
- Network saturated or disconnected: Contact support.
- Nodes unable to join: Fix the Elasticsearch configuration.
- Nodes unable to join: Contact support.
On this page