- Introducing Elasticsearch Service
- Adding data to Elasticsearch
- Migrating data
- Ingesting data from your application
- Ingest data with Node.js on Elasticsearch Service
- Ingest data with Python on Elasticsearch Service
- Ingest data from Beats to Elasticsearch Service with Logstash as a proxy
- Ingest data from a relational database into Elasticsearch Service
- Ingest logs from a Python application using Filebeat
- Ingest logs from a Node.js web application using Filebeat
- Configure Beats and Logstash with Cloud ID
- Best practices for managing your data
- Configure index management
- Enable cross-cluster search and cross-cluster replication
- Access other deployments of the same Elasticsearch Service organization
- Access deployments of another Elasticsearch Service organization
- Access deployments of an Elastic Cloud Enterprise environment
- Access clusters of a self-managed environment
- Enabling CCS/R between Elasticsearch Service and ECK
- Edit or remove a trusted environment
- Migrate the cross-cluster search deployment template
- Manage data from the command line
- Preparing a deployment for production
- Securing your deployment
- Monitoring your deployment
- Monitor with AutoOps
- Configure Stack monitoring alerts
- Access performance metrics
- Keep track of deployment activity
- Diagnose and resolve issues
- Diagnose unavailable nodes
- Why are my shards unavailable?
- Why is performance degrading over time?
- Is my cluster really highly available?
- How does high memory pressure affect performance?
- Why are my cluster response times suddenly so much worse?
- How do I resolve deployment health warnings?
- How do I resolve node bootlooping?
- Why did my node move to a different host?
- Snapshot and restore
- Managing your organization
- Your account and billing
- Billing Dimensions
- Billing models
- Using Elastic Consumption Units for billing
- Edit user account settings
- Monitor and analyze your account usage
- Check your subscription overview
- Add your billing details
- Choose a subscription level
- Check your billing history
- Update billing and operational contacts
- Stop charges for a deployment
- Billing FAQ
- Elasticsearch Service hardware
- Elasticsearch Service GCP instance configurations
- Elasticsearch Service GCP default provider instance configurations
- Elasticsearch Service AWS instance configurations
- Elasticsearch Service AWS default provider instance configurations
- Elasticsearch Service Azure instance configurations
- Elasticsearch Service Azure default provider instance configurations
- Change hardware for a specific resource
- Elasticsearch Service regions
- About Elasticsearch Service
- RESTful API
- Release notes
- March 25, 2025
- Enhancements and bug fixes - March 2025
- Enhancements and bug fixes - February 2025
- Enhancements and bug fixes - January 2025
- Enhancements and bug fixes - December 2024
- Enhancements and bug fixes - November 2024
- Enhancements and bug fixes - Late October 2024
- Enhancements and bug fixes - Early October 2024
- Enhancements and bug fixes - September 2024
- Enhancements and bug fixes - Late August 2024
- Enhancements and bug fixes - Early August 2024
- Enhancements and bug fixes - July 2024
- Enhancements and bug fixes - Late June 2024
- Enhancements and bug fixes - Early June 2024
- Enhancements and bug fixes - Early May 2024
- Bring your own key, and more
- AWS region EU Central 2 (Zurich) now available
- GCP region Middle East West 1 (Tel Aviv) now available
- Enhancements and bug fixes - March 2024
- Enhancements and bug fixes - January 2024
- Enhancements and bug fixes
- Enhancements and bug fixes
- Enhancements and bug fixes
- Enhancements and bug fixes
- AWS region EU North 1 (Stockholm) now available
- GCP regions Asia Southeast 2 (Indonesia) and Europe West 9 (Paris)
- Enhancements and bug fixes
- Enhancements and bug fixes
- Bug fixes
- Enhancements and bug fixes
- Role-based access control, and more
- Newly released deployment templates for Integrations Server, Master, and Coordinating
- Enhancements and bug fixes
- Enhancements and bug fixes
- Enhancements and bug fixes
- Enhancements and bug fixes
- Enhancements and bug fixes
- Enhancements and bug fixes
- Enhancements and bug fixes
- Enhancements and bug fixes
- Enhancements and bug fixes
- Enhancements and bug fixes
- Cross environment search and replication, and more
- Enhancements and bug fixes
- Enhancements and bug fixes
- Azure region Canada Central (Toronto) now available
- Azure region Brazil South (São Paulo) now available
- Azure region South Africa North (Johannesburg) now available
- Azure region Central India (Pune) now available
- Enhancements and bug fixes
- Azure new virtual machine types available
- Billing Costs Analysis API, and more
- Organization and billing API updates, and more
- Integrations Server, and more
- Trust across organizations, and more
- Organizations, and more
- Elastic Consumption Units, and more
- AWS region Africa (Cape Town) available
- AWS region Europe (Milan) available
- AWS region Middle East (Bahrain) available
- Enhancements and bug fixes
- Enhancements and bug fixes
- GCP Private Link, and more
- Enhancements and bug fixes
- GCP region Asia Northeast 3 (Seoul) available
- Enhancements and bug fixes
- Enhancements and bug fixes
- Native Azure integration, and more
- Frozen data tier and more
- Enhancements and bug fixes
- Azure region Southcentral US (Texas) available
- Azure region East US (Virginia) available
- Custom endpoint aliases, and more
- Autoscaling, and more
- Cross-region and cross-provider support, warm and cold data tiers, and more
- Better feature usage tracking, new cost and usage analysis page, and more
- New features, enhancements, and bug fixes
- AWS region Asia Pacific (Hong Kong)
- Enterprise subscription self service, log in with Microsoft, bug fixes, and more
- SSO for Enterprise Search, support for more settings
- Azure region Australia East (New South Wales)
- New logging features, better GCP marketplace self service
- Azure region US Central (Iowa)
- AWS region Asia Pacific (Mumbai)
- Elastic solutions and Microsoft Azure Marketplace integration
- AWS region Pacific (Seoul)
- AWS region EU West 3 (Paris)
- Traffic management and improved network security
- AWS region Canada (Central)
- Enterprise Search
- New security setting, in-place configuration changes, new hardware support, and signup with Google
- Azure region France Central (Paris)
- Regions AWS US East 2 (Ohio) and Azure North Europe (Ireland)
- Our Elasticsearch Service API is generally available
- GCP regions Asia East 1 (Taiwan), Europe North 1 (Finland), and Europe West 4 (Netherlands)
- Azure region UK South (London)
- GCP region US East 1 (South Carolina)
- GCP regions Asia Southeast 1 (Singapore) and South America East 1 (Sao Paulo)
- Snapshot lifecycle management, index lifecycle management migration, and more
- Azure region Japan East (Tokyo)
- App Search
- GCP region Asia Pacific South 1 (Mumbai)
- GCP region North America Northeast 1 (Montreal)
- New Elastic Cloud home page and other improvements
- Azure regions US West 2 (Washington) and Southeast Asia (Singapore)
- GCP regions US East 4 (N. Virginia) and Europe West 2 (London)
- Better plugin and bundle support, improved pricing calculator, bug fixes, and more
- GCP region Asia Pacific Southeast 1 (Sydney)
- Elasticsearch Service on Microsoft Azure
- Cross-cluster search, OIDC and Kerberos authentication
- AWS region EU (London)
- GCP region Asia Pacific Northeast 1 (Tokyo)
- Usability improvements and Kibana bug fix
- GCS support and private subscription
- Elastic Stack 6.8 and 7.1
- ILM and hot-warm architecture
- Elasticsearch keystore and more
- Trial capacity and more
- APM Servers and more
- Snapshot retention period and more
- Improvements and snapshot intervals
- SAML and multi-factor authentication
- Next generation of Elasticsearch Service
- Branding update
- Minor Console updates
- New Cloud Console and bug fixes
- What’s new with the Elastic Stack
Notifications settings
editNotifications settings
editAutoOps can notify you of new events opened or closed through various methods and operation management tools. With a customizable mechanism, you can specify which events you want to be notified about, how you wish to receive these notifications, and their frequency.
Only organization owners can configure these settings.
To set up notifications you have to:
- Set up connectors to specify where the notifications will be sent.
- Add notification filters to determine which events will be sent to each connector.
AutoOps connectors
editTo receive notifications for new events, the first step is to specify where the notifications should be sent. AutoOps provides a selection of built-in connectors to choose from. You can set up multiple connectors, even of the same type, based on your needs.
Set up a connector
edit- On the Notifications Settings page, navigate to the Connector Settings tab and click Add.
- From the drop-down list, choose the connector you want to set up and follow the instructions.
- Click Validate to send a test message.
- Save your settings.
Add notification filters
editA notification filter lets you choose which events to receive notifications for and how you want to be notified. You can create an unlimited number of filters, and the same connector can be used across multiple filters.
To set up a filter, follow these steps:
- On the Notification settings page, navigate to the Filter Setting tab and click Add.
- Choose a name that best describes the type of alert notification. This name will appear in other reports and dashboards.
- Select the deployments that the new created events will trigger the alert for.
- Select the connectors to receive the notification.
- Use the Delay field to set the period of time AutoOps will hold before sending the notification. If during this time all of the events listed in this filter are closed by AutoOps, no notification will be sent.
- Choose the type of events this filter applies to.
Built-in connectors
editThe following connectors are available with AutoOps:
PagerDuty integration
editThe PagerDuty integration consists of the following parts:
PagerDuty configuration
- Follow the steps described in the Events Integration Functionality section.
- Save the integration URL key as you will need it later.
AutoOps configuration
- Add a new PagerDuty endpoint using the PagerDuty configuration application key.
- To receive Slack notifications, add a notification filter. Scroll down the Notification page and click Add.
- Fill in the filter details.
- Select the events that should be sent to this output.
Slack integration
editTo set up a webhook to send AutoOps notifications to a Slack channel, go through the following steps.
- Go to https://api.slack.com/apps
- Click Create new App.
- Select From Scratch.
- Choose a name for your webhook and the workspace to create the app. Click Create App.
- From the left menu, select Incoming Webhooks.
- Toggle the Activate Incoming Webhooks to On.
- Click Request to Add New Webhook.
- Select a Slack channel from the list to receive the notifications and click Allow.
- Copy the webhook URL to set up the webhook notification endpoint in AutoOps.
- Add the webhook URL when creating the endpoint.
VictorOps integration
editThe VictorOps integration consists of the following parts:
VictorOps configuration
- Follow the steps described in the REST Endpoint Integration Guide.
- Save the integration URL key as you will need it later.
AutoOps configuration
- Add a new PagerDuty endpoint using the PagerDuty configuration application key.
- To receive Slack notifications, add a notification filter. Scroll down the Notification page and click Add.
- Fill in the filter details.
- Select the events that should be sent to this output.
Opsgenie integration
editThe Opsgenie integration consists of the following parts:
Opsgenie configuration
- Open the main page of your Opsgenie account and click the Teams tab (a team must be defined).
- Go to the Settings tab of your Opsgenie page, and select Integrations.
- Select your Team and click Integrations from the left menu.
- Click Add Integration. On the Integration List, search for API.
- Name your integration and click Save.
AutoOps configuration
- Open AutoOps and go to User Profile. Then, select Notifications.
- Click Add and select Opsgenie from the dropdown list.
- Name your endpoint and add Api Key from opsgenie API configuration. Click the validate button to make sure that your notification setting is working. Don’t forget to save your notification endpoint!
- To receive notifications on Opsgenie, you need to add a notification filter. Scroll down the Notification page and click Add.
- Fill in the filter details.
- Select events that should be sent to this output.
Microsoft Teams Configuration integration
editTo create an incoming webhook on your Microsoft Teams, follow these instructions.
Save the URL displayed during the creation of the incoming webhook, as you will use it during the AutoOps configuration.
AutoOps configuration
- Add a new MS team endpoint using the URL from Microsoft Teams.
- To receive notifications into Microsoft Teams, you need to add a notification filter. Scroll down the Notification page and click Add.
- Fill in the filter details.
- Select events that should be sent to this output.
Webhook integration
editA webhook enables an application to provide other applications with real-time information. A webhook is a user-defined HTTP callback (HTTP POST), which is triggered by specific events.
How to add a webhook notification
- Go to Settings → Notifications → Endpoint settings and click Add.
-
Select Webhook from the drop-dowon list and enter the following details:
- Name: It must be a unique name for this webhook.
- URL: This is the endpoint to which HTTP POST requests will be sent when events occur.
- Method: POST
- Header: Content-Type, application/Json
-
Review and update the message as it appears in the body section. AutoOps provides a set of optional fields to use in the message. Read your application documentation for the expected message schema.
- RESOURCE_ID – Customer Deployment ID
- RESOURCE_NAME – Customer Deployment name
- TITLE – The title of the event.
- DESCRIPTION – The description of the issue that was found.
- SEVERITY – One of the 3 severity levels (High, Medium and Low).
- STATUS – Indicate if the event is currently open or close.
- MESSAGE – The background and impact of the issue
- START_TIME – The time the event was open.
- END_TIME – The time the event was closed.
- ENDPOINT_TYPE – The type of the endpoint (Slack, PagerDuty, Webhook, Opsgenie, VictorOps and MS Teams).
- AFFECTED_NODES – List of node names.
- AFFECTED_INDICES – List of indices names.
- EVENT_LINK – Direct link to the event in AutoOps.
- Click Validate to check your settings and click Save.
- Optionally, you can test the webhook integration by using the webhook.site.
When the Endpoint settings have been completed, continue to set up the notification filter to define which events you’d like to be notified about.
Notifications report
editFrom the Notifications report, you can check all the notifications sent. The report lists all the events that were set up in the notification filters and provide their status.
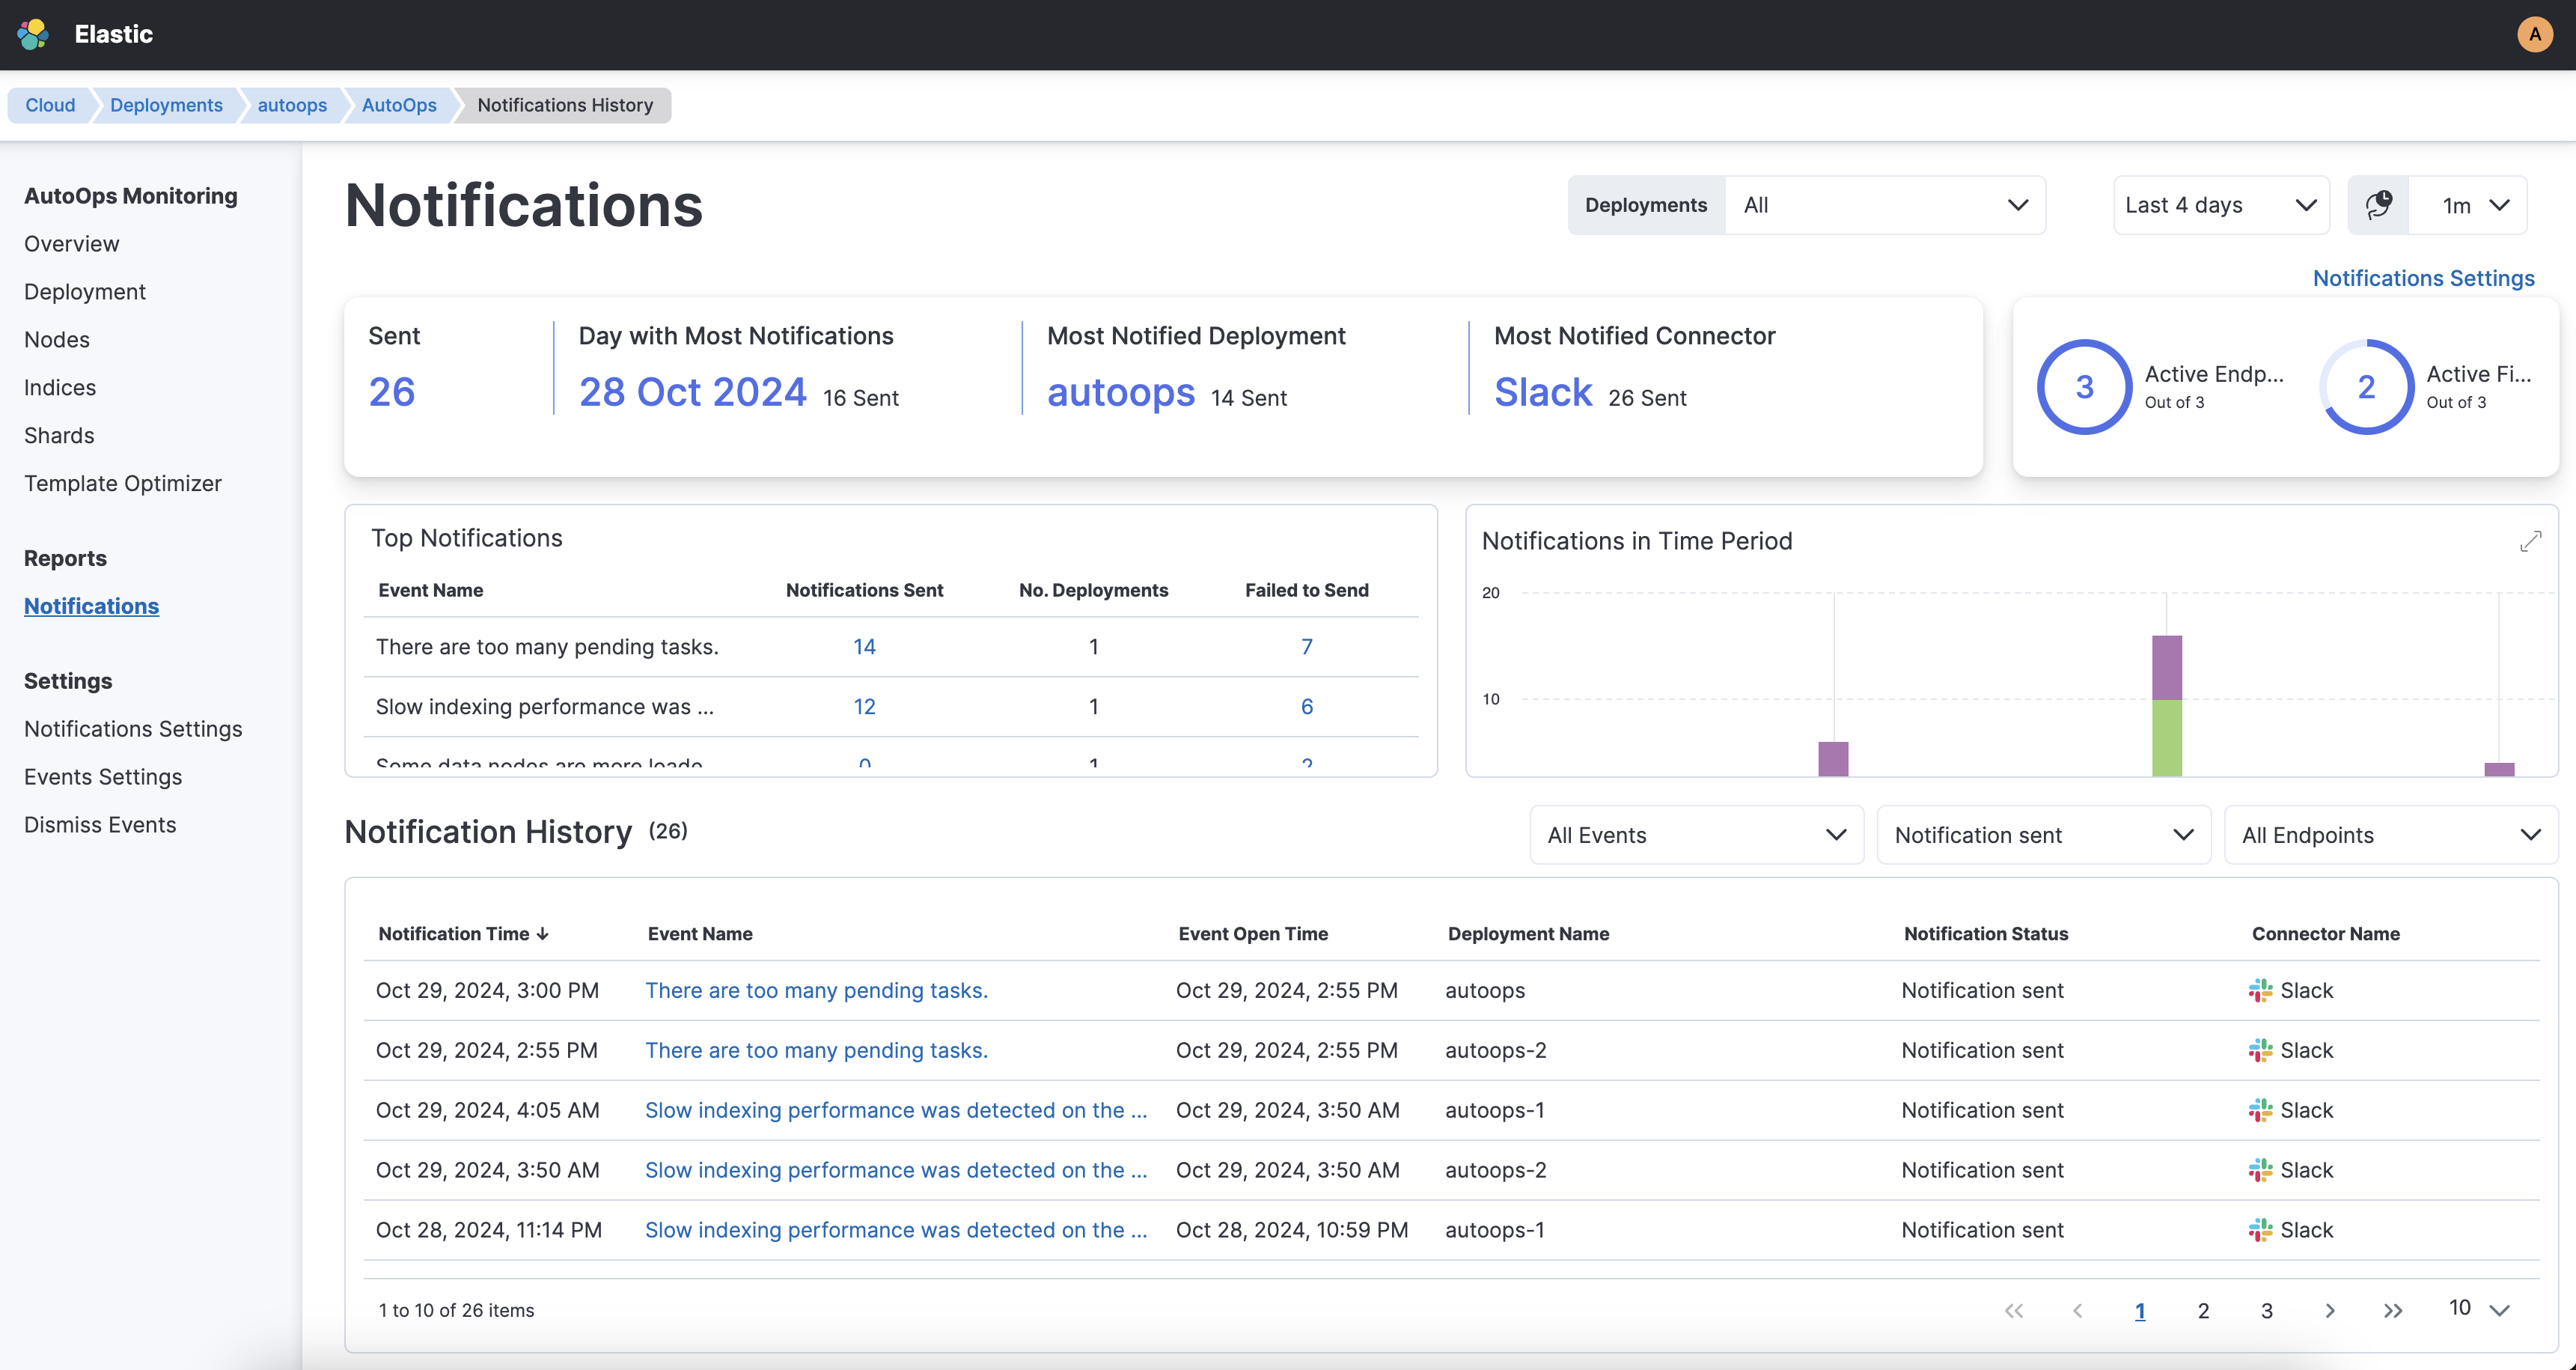
The notification can have one of the following statuses:
- Notification sent
- Connector not defined
- Notification muted
- Sending notification
- Notification failed to send
- Event closed before notification sent
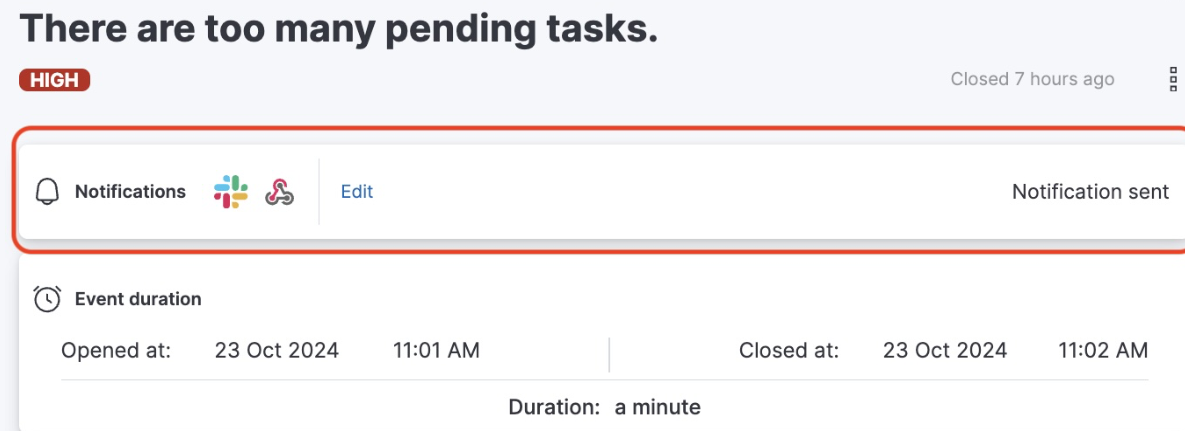
The notification status appears also in the event details window.
On this page