- Kibana Guide: other versions:
- What is Kibana?
- What’s new in 8.0
- Kibana concepts
- Quick start
- Set up
- Install Kibana
- Configure Kibana
- Alerting and action settings
- APM settings
- Banners settings
- Enterprise Search settings
- Fleet settings
- i18n settings
- Logging settings
- Logs settings
- Metrics settings
- Monitoring settings
- Reporting settings
- Search sessions settings
- Secure settings
- Security settings
- Spaces settings
- Task Manager settings
- Telemetry settings
- URL drilldown settings
- Start and stop Kibana
- Access Kibana
- Securing access to Kibana
- Add data
- Upgrade Kibana
- Configure security
- Configure reporting
- Configure logging
- Configure monitoring
- Command line tools
- Production considerations
- Discover
- Dashboard and visualizations
- Canvas
- Maps
- Build a map to compare metrics by country or region
- Track, visualize, and alert on assets in real time
- Map custom regions with reverse geocoding
- Heat map layer
- Tile layer
- Vector layer
- Plot big data
- Search geographic data
- Configure map settings
- Connect to Elastic Maps Service
- Import geospatial data
- Troubleshoot
- Reporting and sharing
- Machine learning
- Graph
- Alerting
- Observability
- APM
- Security
- Dev Tools
- Fleet
- Osquery
- Stack Monitoring
- Stack Management
- REST API
- Get features API
- Kibana spaces APIs
- Kibana role management APIs
- User session management APIs
- Saved objects APIs
- Data views API
- Index patterns APIs
- Alerting APIs
- Action and connector APIs
- Cases APIs
- Import and export dashboard APIs
- Logstash configuration management APIs
- Machine learning APIs
- Short URLs APIs
- Get Task Manager health
- Upgrade assistant APIs
- Kibana plugins
- Accessibility
- Release notes
- Developer guide
View a document
editView a document
editOnce you’ve found a document of interest in Discover, you have two more ways to view it: in a view by itself or in context with surrounding documents.
View a single document
editAccess a single document so you can bookmark it and share the link.
- In the document table, click the expand icon (>).
-
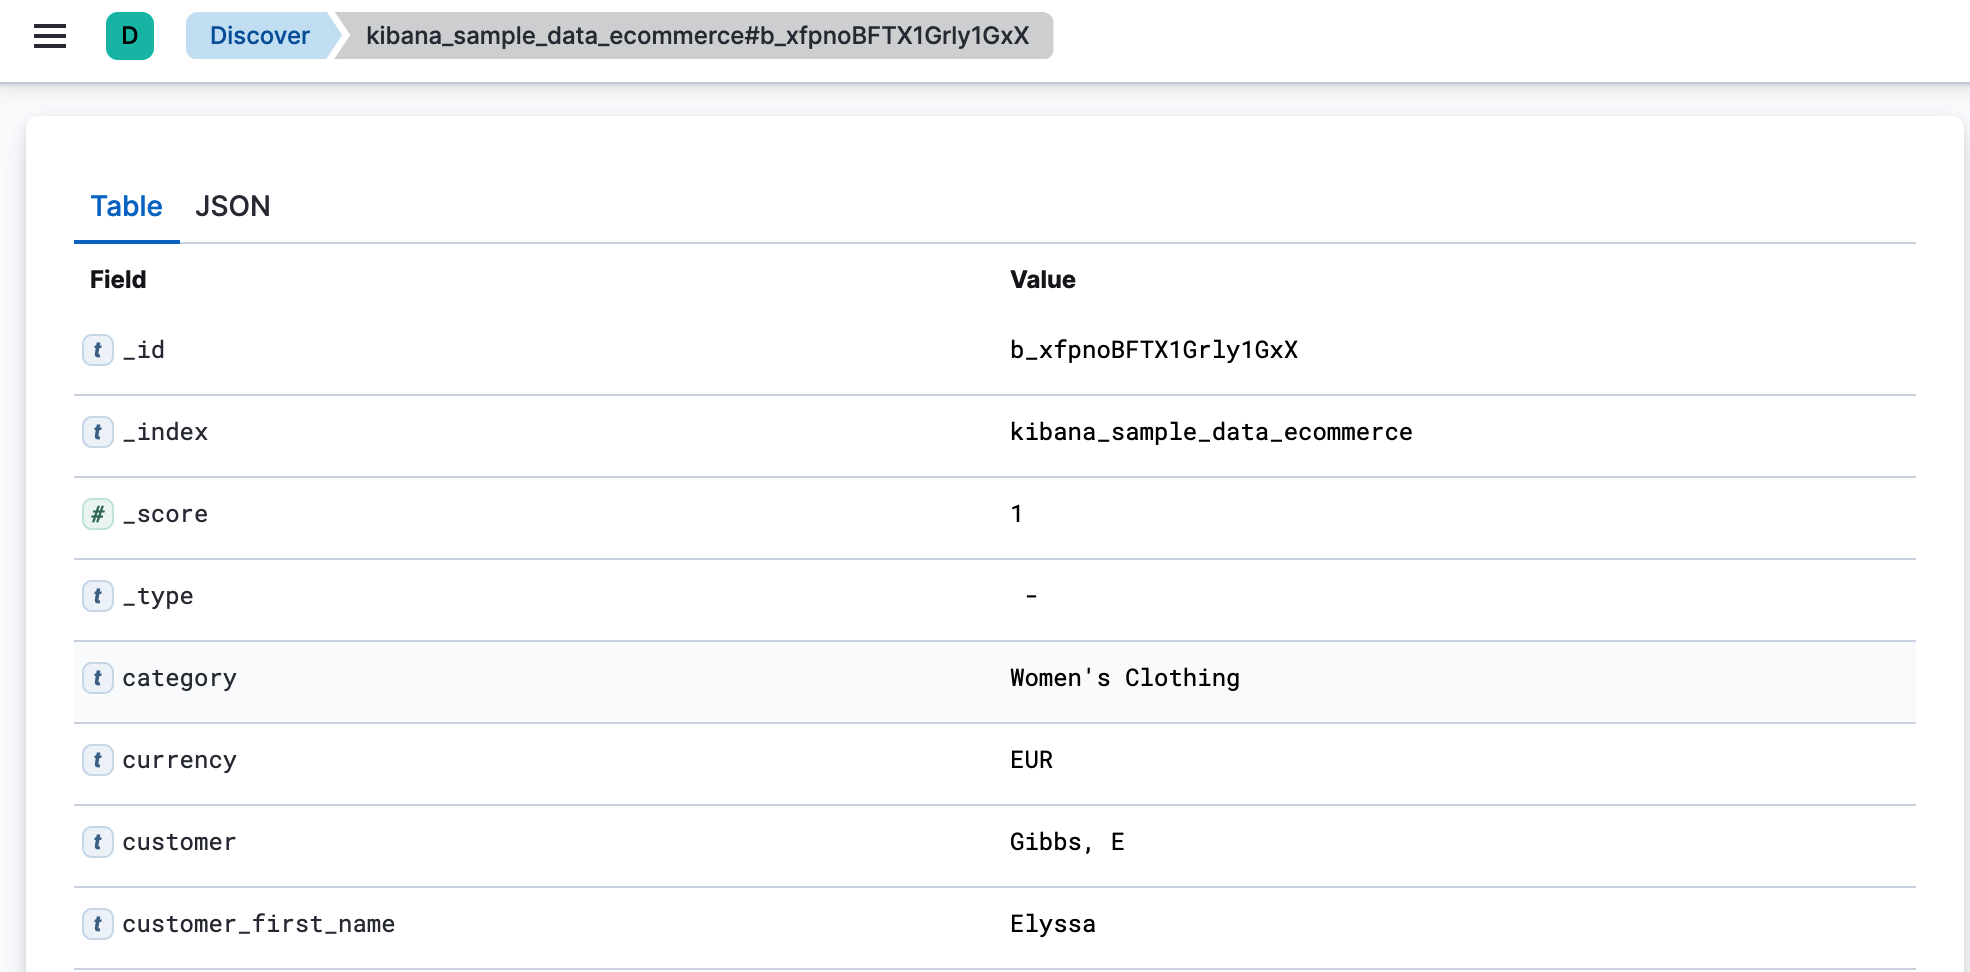
In the expanded view, click View single document.
You can view the document in two ways. The Table view displays the document fields row-by-row. The JSON (JavaScript Object Notation) view allows you to look at how Elasticsearch returns the document.
The link is valid for the time the document is available in Elasticsearch. To create a customized view of the document, you can create your own plugin.
View surrounding documents
editTo inspect the documents that occurred immediately before and after a document, your data view must contain time-based events.
- In the document table, click the expand icon (>).
-
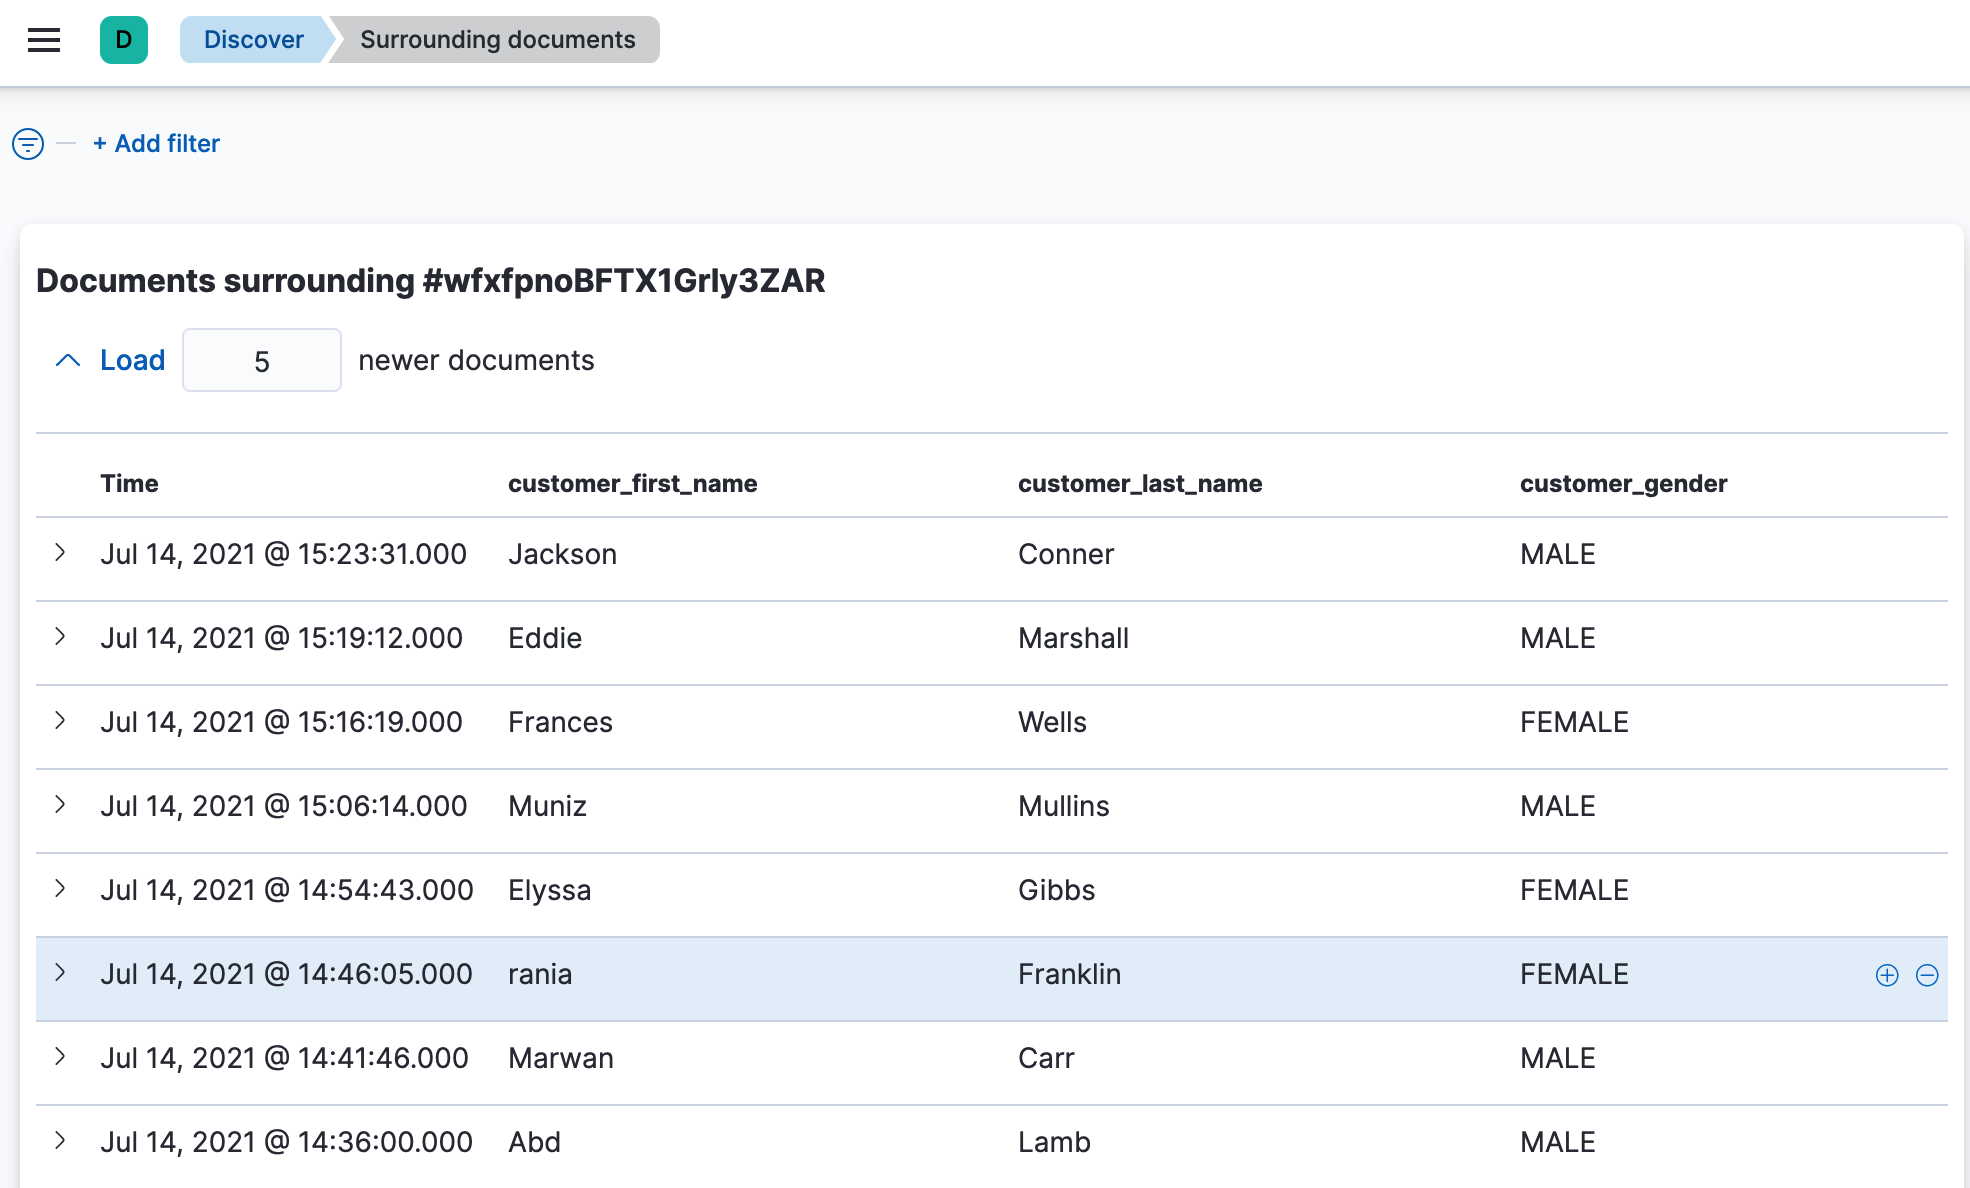
In the expanded view, click View surrounding documents.
Documents are displayed using the same set of columns as the Discover view from which the context was opened. The anchor document is highlighted in blue.
The filters you applied in Discover are carried over to the context view. Pinned filters remain active, while normal filters are copied in a disabled state.
- To find the documents of interest, add filters.
-
To increase the number of documents that surround the anchor document, click Load. By default, five documents are added with each click.
- To configure the number of documents to display and the number of documents to load with each button click, go to Stack Management > Advanced Settings and edit the context settings.
On this page