IMPORTANT: No additional bug fixes or documentation updates
will be released for this version. For the latest information, see the
current release documentation.
Region Maps
edit
IMPORTANT: This documentation is no longer updated. Refer to Elastic's version policy and the latest documentation.
Region Maps
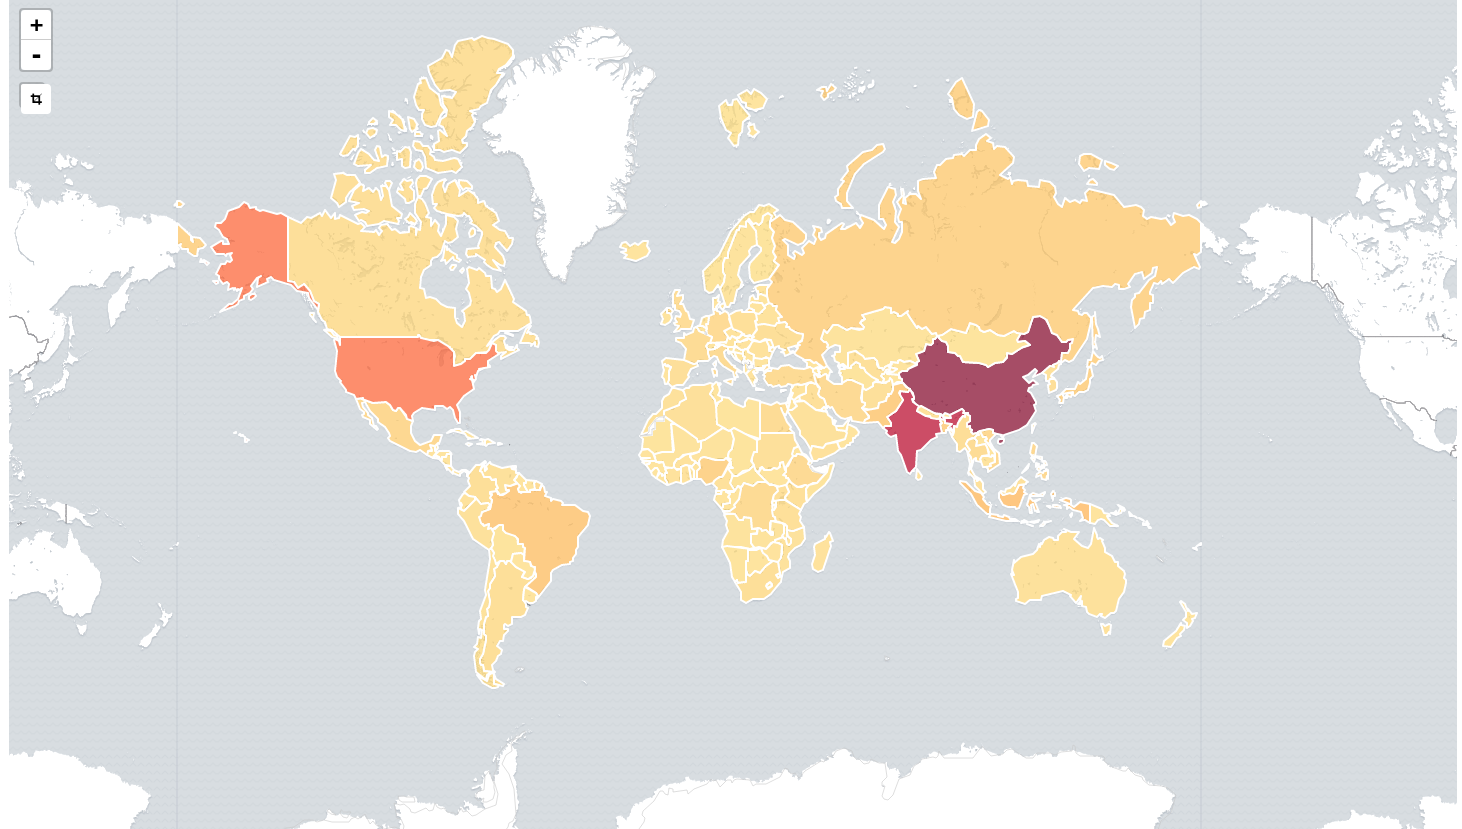
editRegion maps are thematic maps in which boundary vector shapes are colored using a gradient: higher intensity colors indicate larger values, and lower intensity colors indicate smaller values. These are also known as choropleth maps.
Configuration
editTo create a region map, you configure an inner join that joins the result of an Elasticsearch terms aggregation and a reference vector file based on a shared key.
Data
editMetrics
editSelect any of the supported Metric or Sibling Pipeline Aggregations.
Buckets
editConfigure a Terms aggregation. The term is the key that is used to join the results to the vector data on the map.
Options
editLayer Settings
edit- Vector map: select from a list of vector maps. This list includes the maps that are hosted by the © Elastic Maps Service, as well as your self-hosted layers that are configured in the config/kibana.yml file. To learn more about how to configure Kibana to make self-hosted layers available, see the regionmap settings documentation. You can also explore and preview vector layers available in Elastic Maps Service at https://maps.elastic.co.
-
Join field: this is the property from the selected vector map that will be used to join on the terms in your terms-aggregation.
When terms cannot be joined to any of the shapes in the vector layer because there is no exact match in the vector layer, Kibana will display a warning.
To turn of these warnings, go to Management/Kibana/Advanced Settings and set
visualization:regionmap:showWarningstofalse.
Style Settings
edit- Color Schema: the color range used to color the shapes.
Basic Settings
edit- Legend Position: the location on the screen where the legend should be rendered.
- Show Tooltip: indicates whether a tooltip should be displayed when hovering over a shape..