- Kibana Guide: other versions:
- Introduction
- Get started
- Set Up Kibana
- Discover
- Visualize
- Creating a Visualization
- Saving Visualizations
- Using rolled up data in a visualization
- Line, Area, and Bar charts
- Controls Visualization
- Data Table
- Markdown Widget
- Metric
- Goal and Gauge
- Pie Charts
- Coordinate Maps
- Region Maps
- Timelion
- TSVB
- Tag Clouds
- Heatmap Chart
- Vega Graphs
- Inspecting Visualizations
- Dashboard
- Canvas
- Graph data connections
- Machine learning
- Elastic Maps
- Code
- Infrastructure
- Logs
- APM
- Uptime
- SIEM
- Dev Tools
- Stack Monitoring
- Management
- Reporting from Kibana
- REST API
- Kibana plugins
- Limitations
- Release Highlights
- Breaking Changes
- Release Notes
- Developer guide
IMPORTANT: No additional bug fixes or documentation updates
will be released for this version. For the latest information, see the
current release documentation.
Services overview
editServices overview
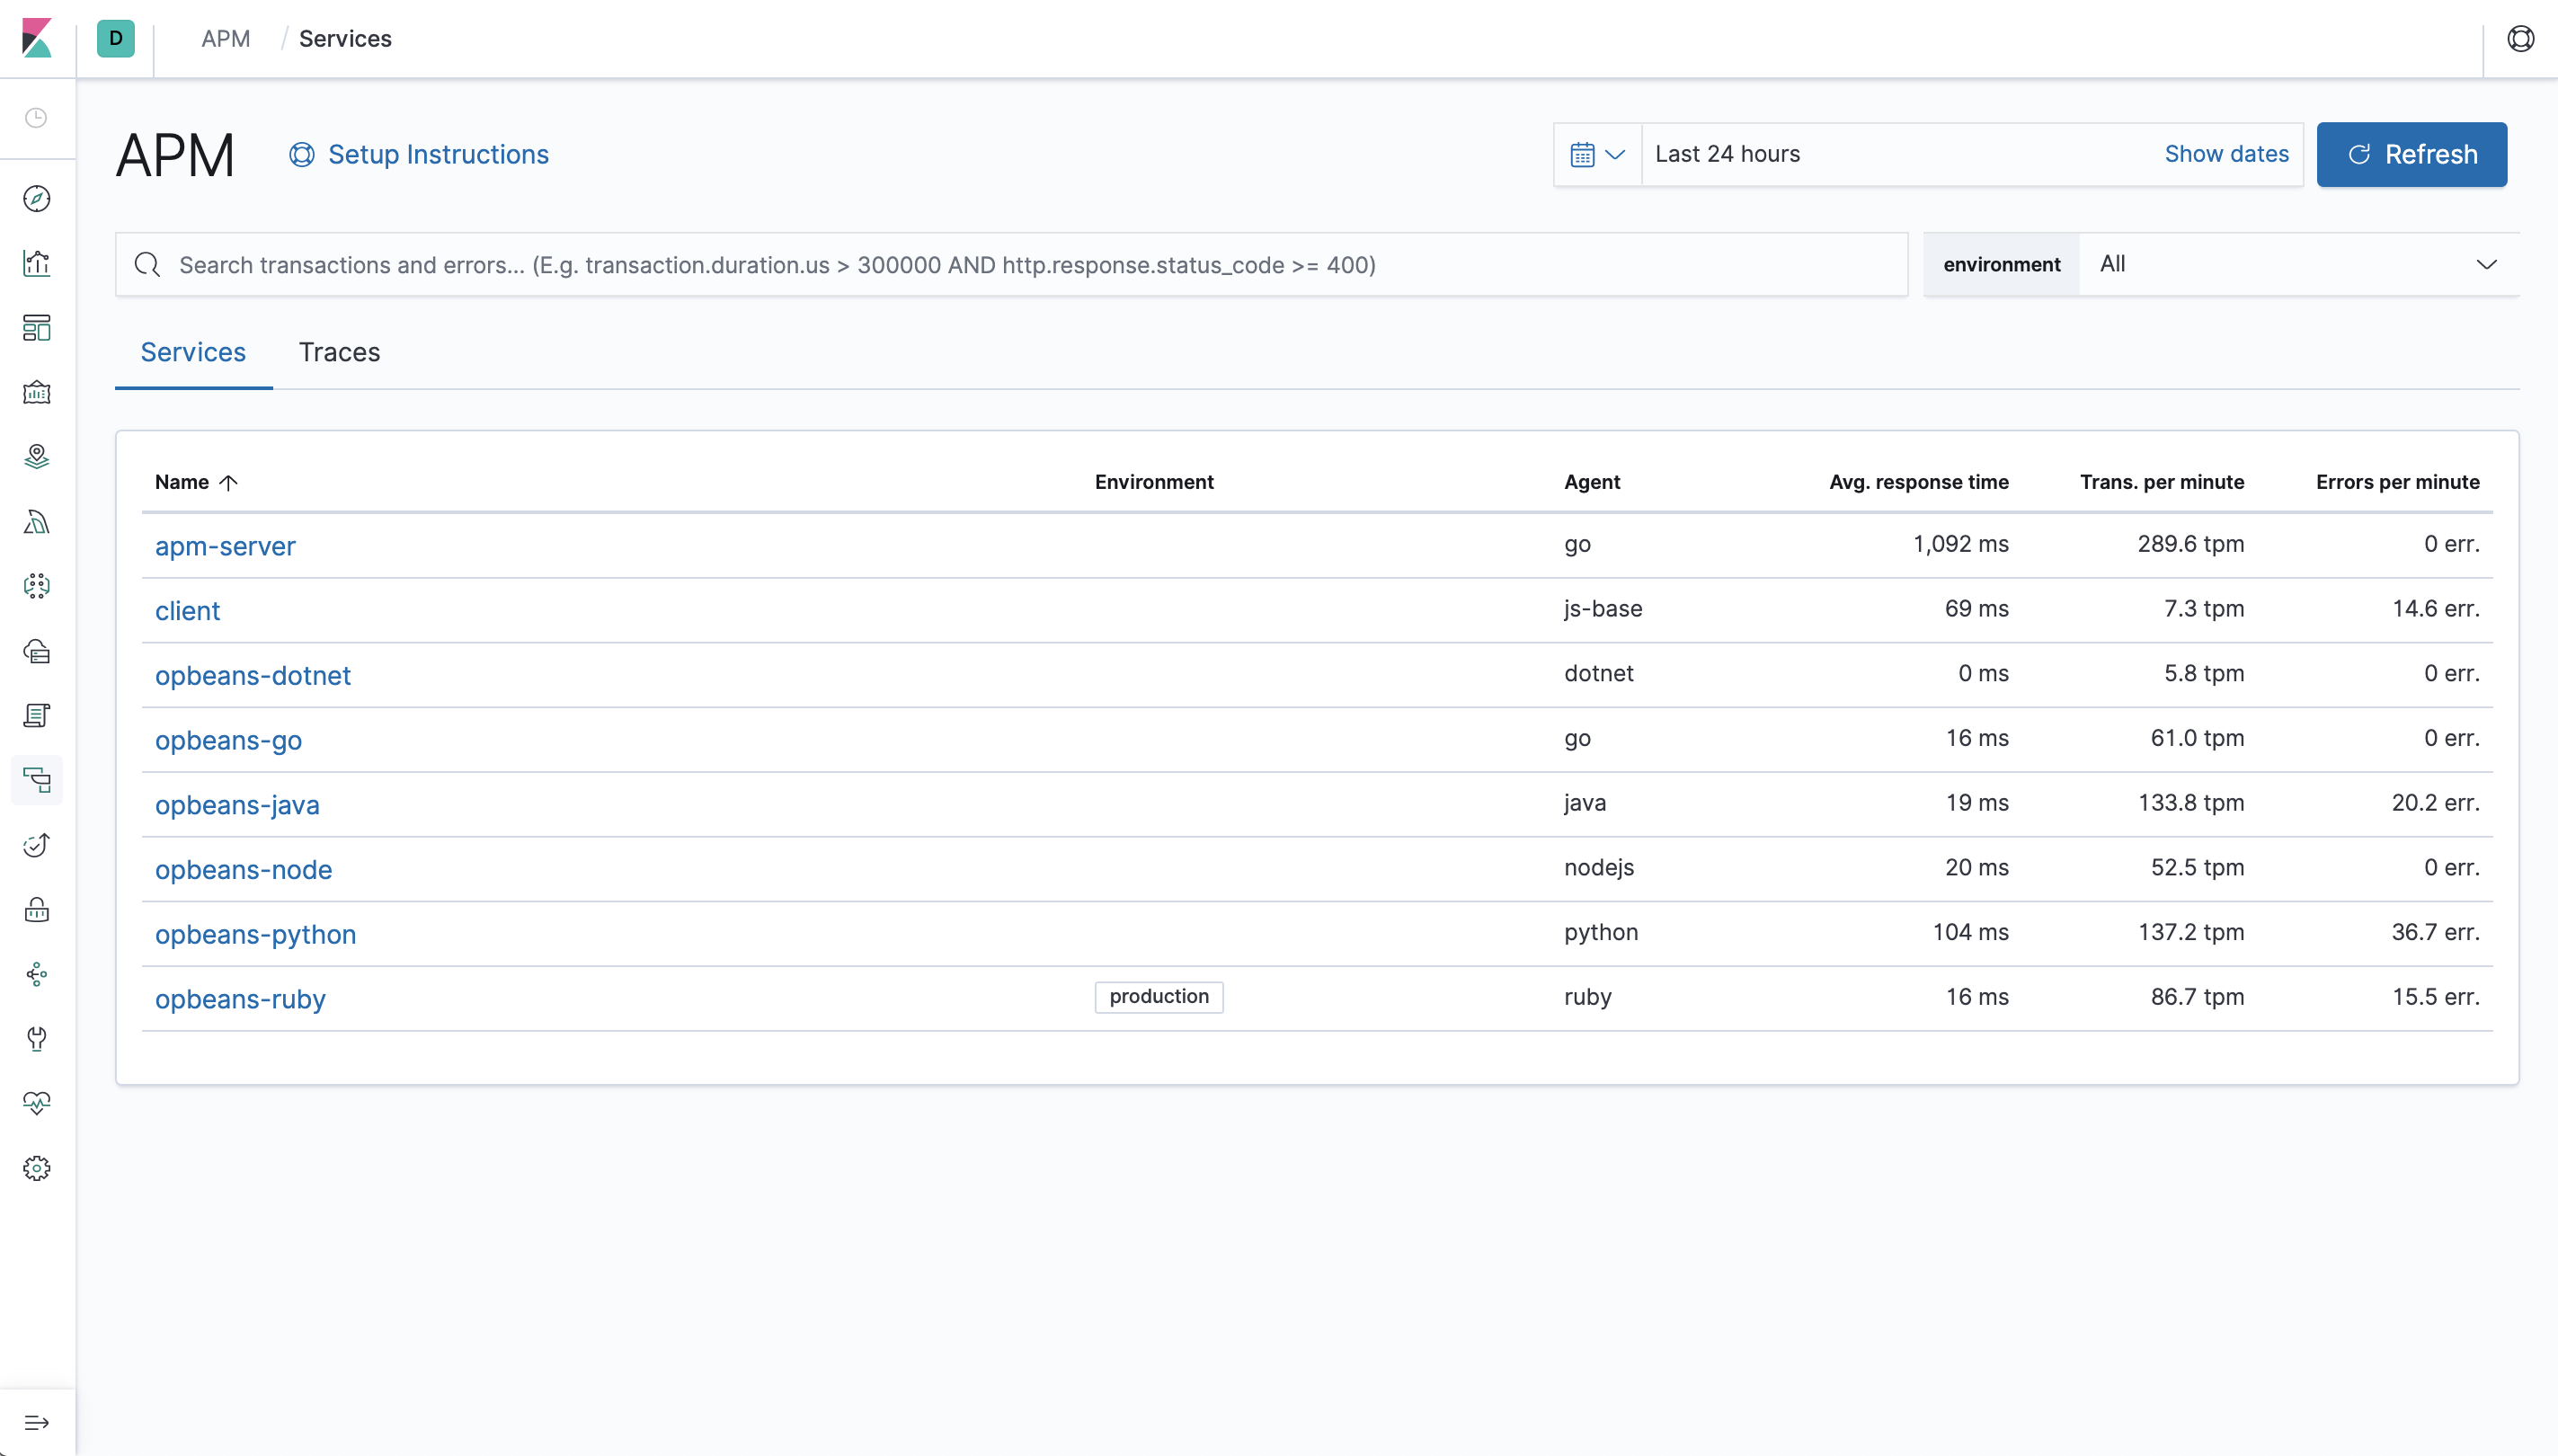
editThe Services overview gives you quick insights into the health and general performance of each service.
You can add services by setting the service.name
configuration in each of the APM agents you’re instrumenting.
Was this helpful?
Thank you for your feedback.