IMPORTANT: No additional bug fixes or documentation updates
will be released for this version. For the latest information, see the
current release documentation.
Metrics overview
edit
IMPORTANT: This documentation is no longer updated. Refer to Elastic's version policy and the latest documentation.
Metrics overview
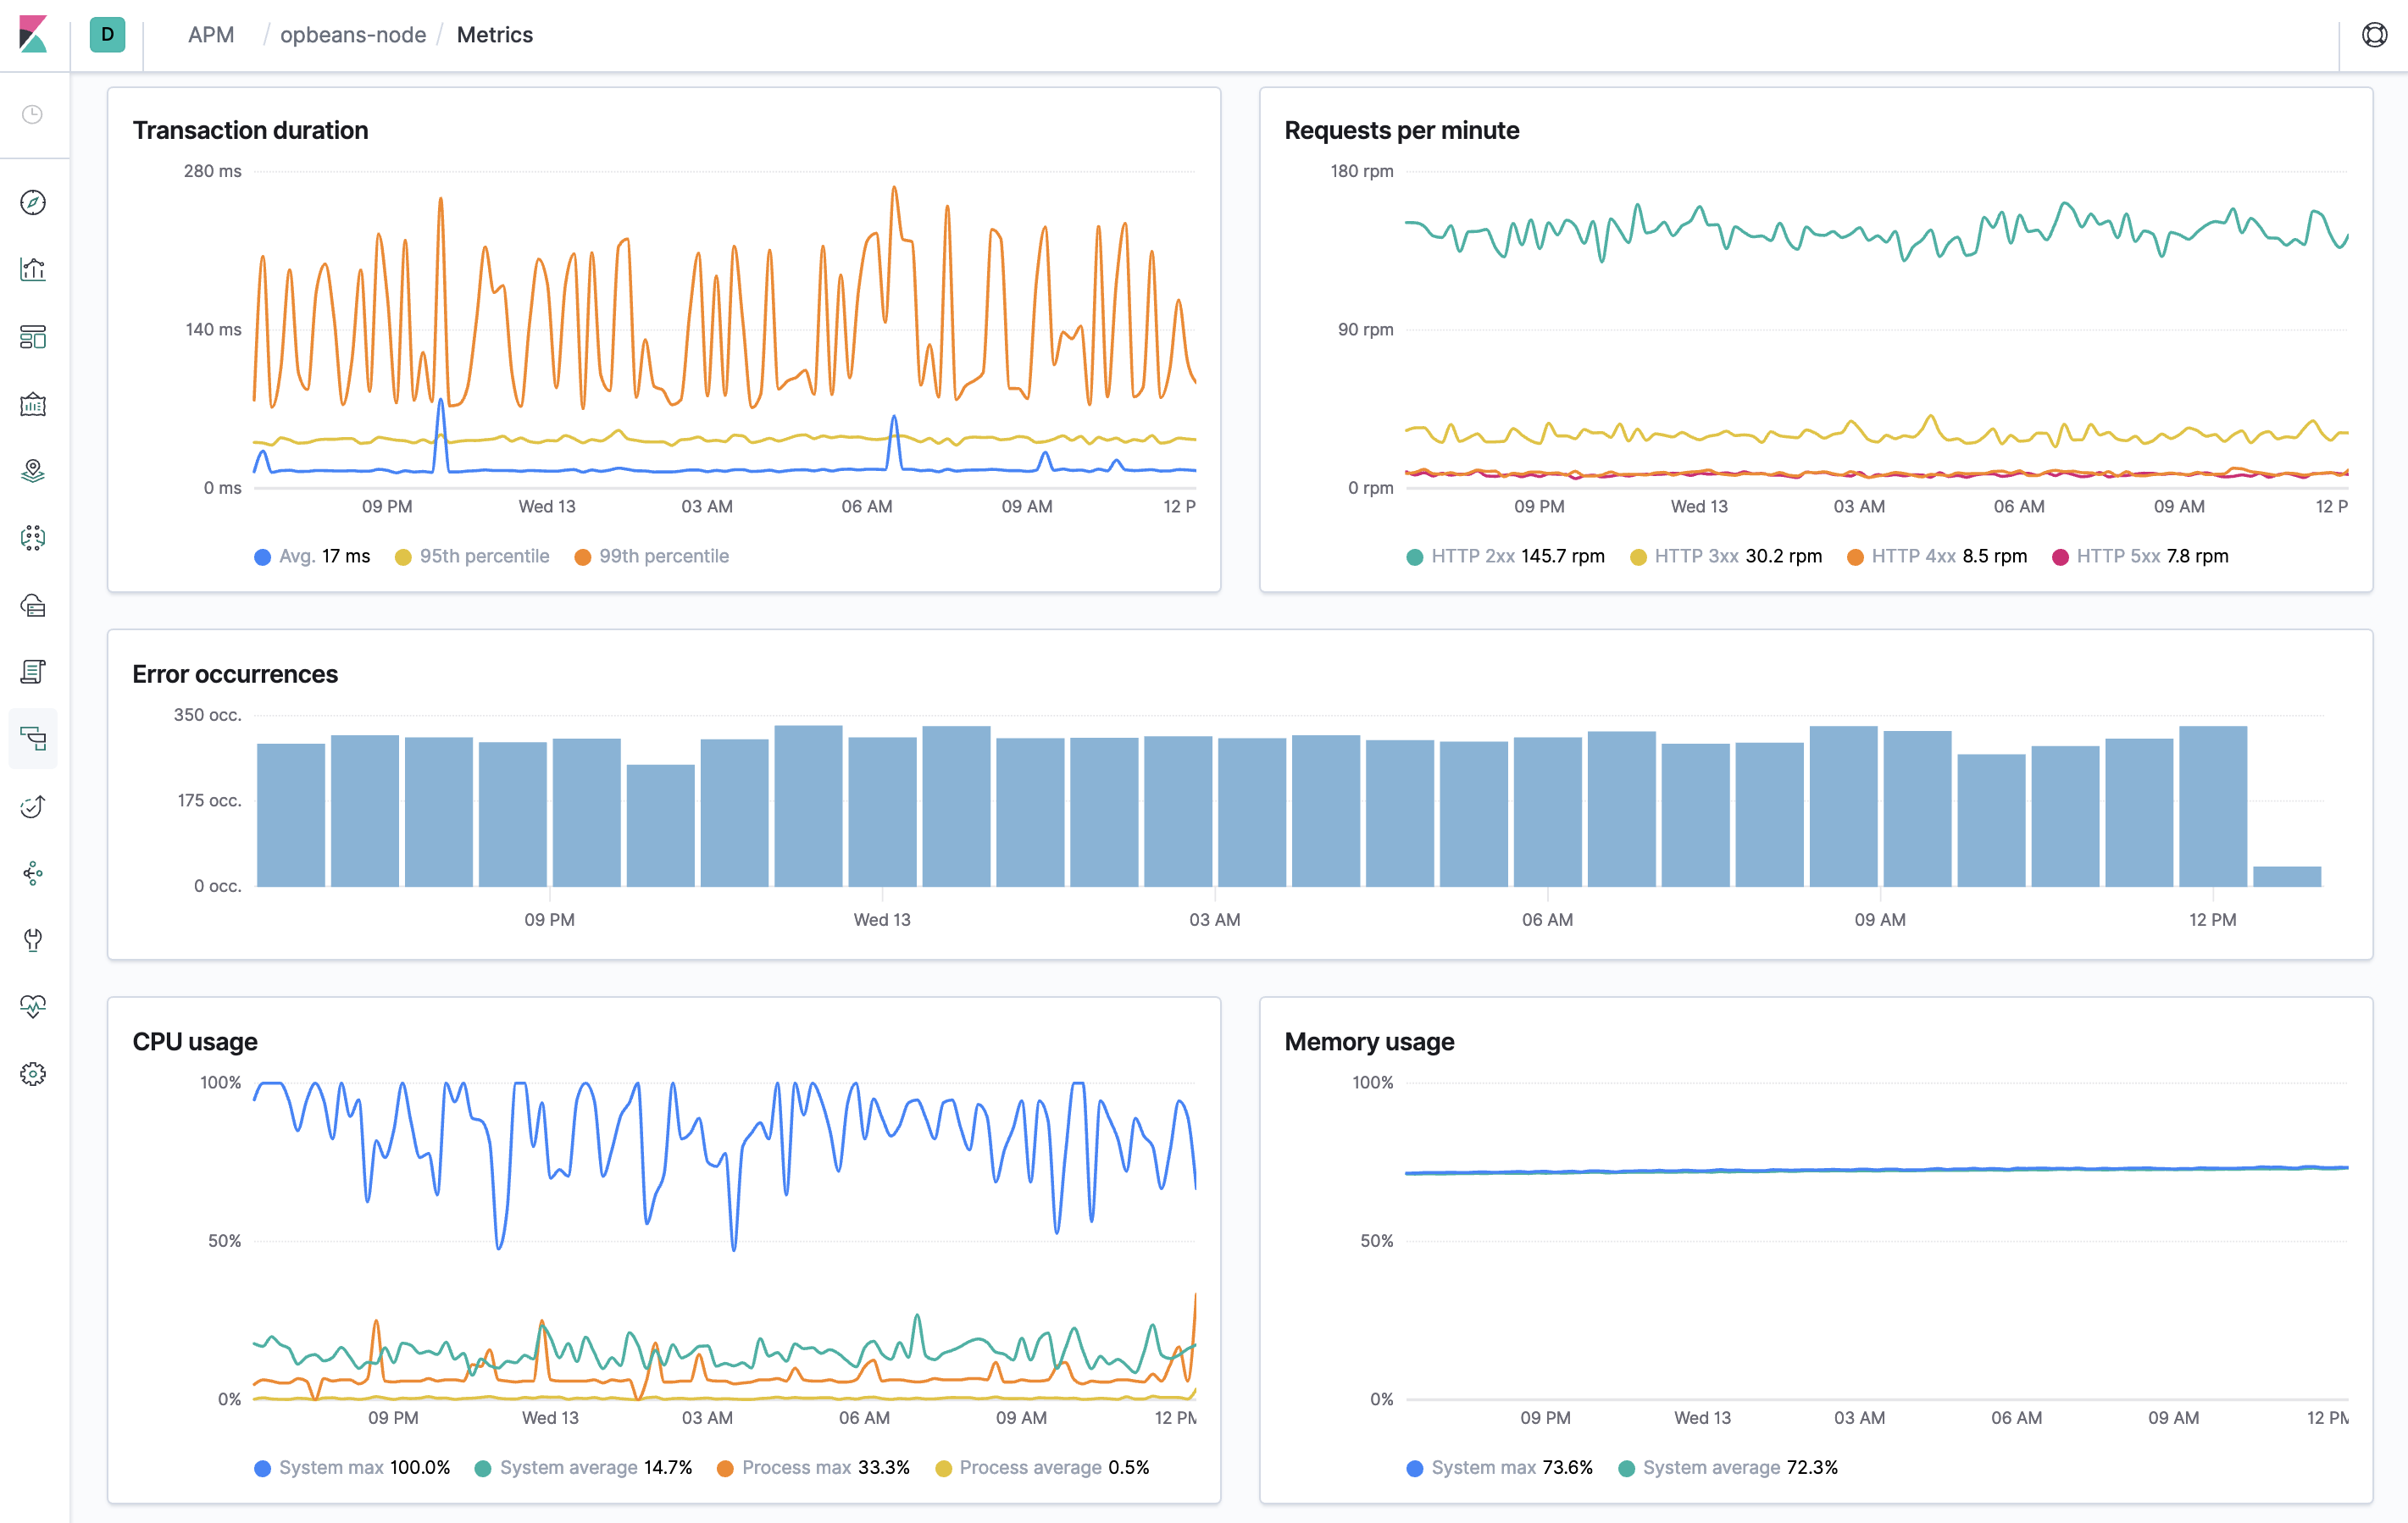
editThe Metrics overview shows a combination of transaction, error, CPU, and memory data.
If you’re experiencing a problem with your service, you can use this page to attempt to find the underlying cause. For example, you might be able to correlate a high number of errors with a long transaction duration, high CPU usage, or a memory leak.