What’s new in 8.6
editWhat’s new in 8.6
editHere are the highlights of what’s new and improved in Elastic Security. For detailed information about this release, check out the Release notes.
Other versions: 8.5 | 8.4 | 8.3 | 8.2 | 8.1 | 8.0 | 7.17 | 7.16 | 7.15 | 7.14 | 7.13 | 7.12 | 7.11 | 7.10 | 7.9
Detection rules enhancements
editAlert suppression for custom query rules
Alert suppression allows you to reduce the number of repeated or duplicate detection alerts created by a custom query detection rule each time the rule runs. Matching events are grouped by a specified field, and only one alert is created for each group per rule execution. You can also specify multiple fields to group events by unique combinations of values.
New terms rules allow multiple fields
You can now configure new terms detection rules to detect combinations of up to three new terms. For example, a host IP address and host ID that haven’t been observed together.
New Tines connector for rule actions
There’s a new Tines connector you can select when configuring rule actions. This connector uses Tines' Webhook Actions to send events to a Tines story.
Machine learning job enhancements
The following enhancements simplify managing machine learning detection rules and their associated machine learning jobs:
- Required machine learning jobs start automatically when you create a new machine learning rule.
- The rule details page includes toggles to turn on machine learning jobs for existing rules.
- The Rules page displays additional information and an error icon to identify rules with machine learning jobs that aren’t running.
New prebuilt rules
18 new prebuilt rules were added in 8.6.0.
Role-based access control (RBAC) for response actions
editNew feature privileges in Kibana allow admins to manage role-based access to Elastic Defend features, including access to response actions history, isolating and releasing hosts, and performing process-related response actions on hosts.

New Data Exfiltration Detection (DED) integration
editThe DED integration package protects your data from being exfiltrated to external web services (technical preview only and requires a Platinum subscription).

Entity Analytics dashboard enhancements
editThe following enhancements have been made to the Entity Analytics dashboard to improve efficiency in responding to emerging threats:
- Hover over a host name or user name to display inline actions: Add to timeline investigation, which adds the selected value to a new Timeline, and Copy to Clipboard, which copies the host name value for you to paste later.
- Launch Timeline by clicking the number link in the Alerts column.
- Install and run a machine learning job directly from the Notable Anomalies table by clicking Run job.

Exceptions enhancements
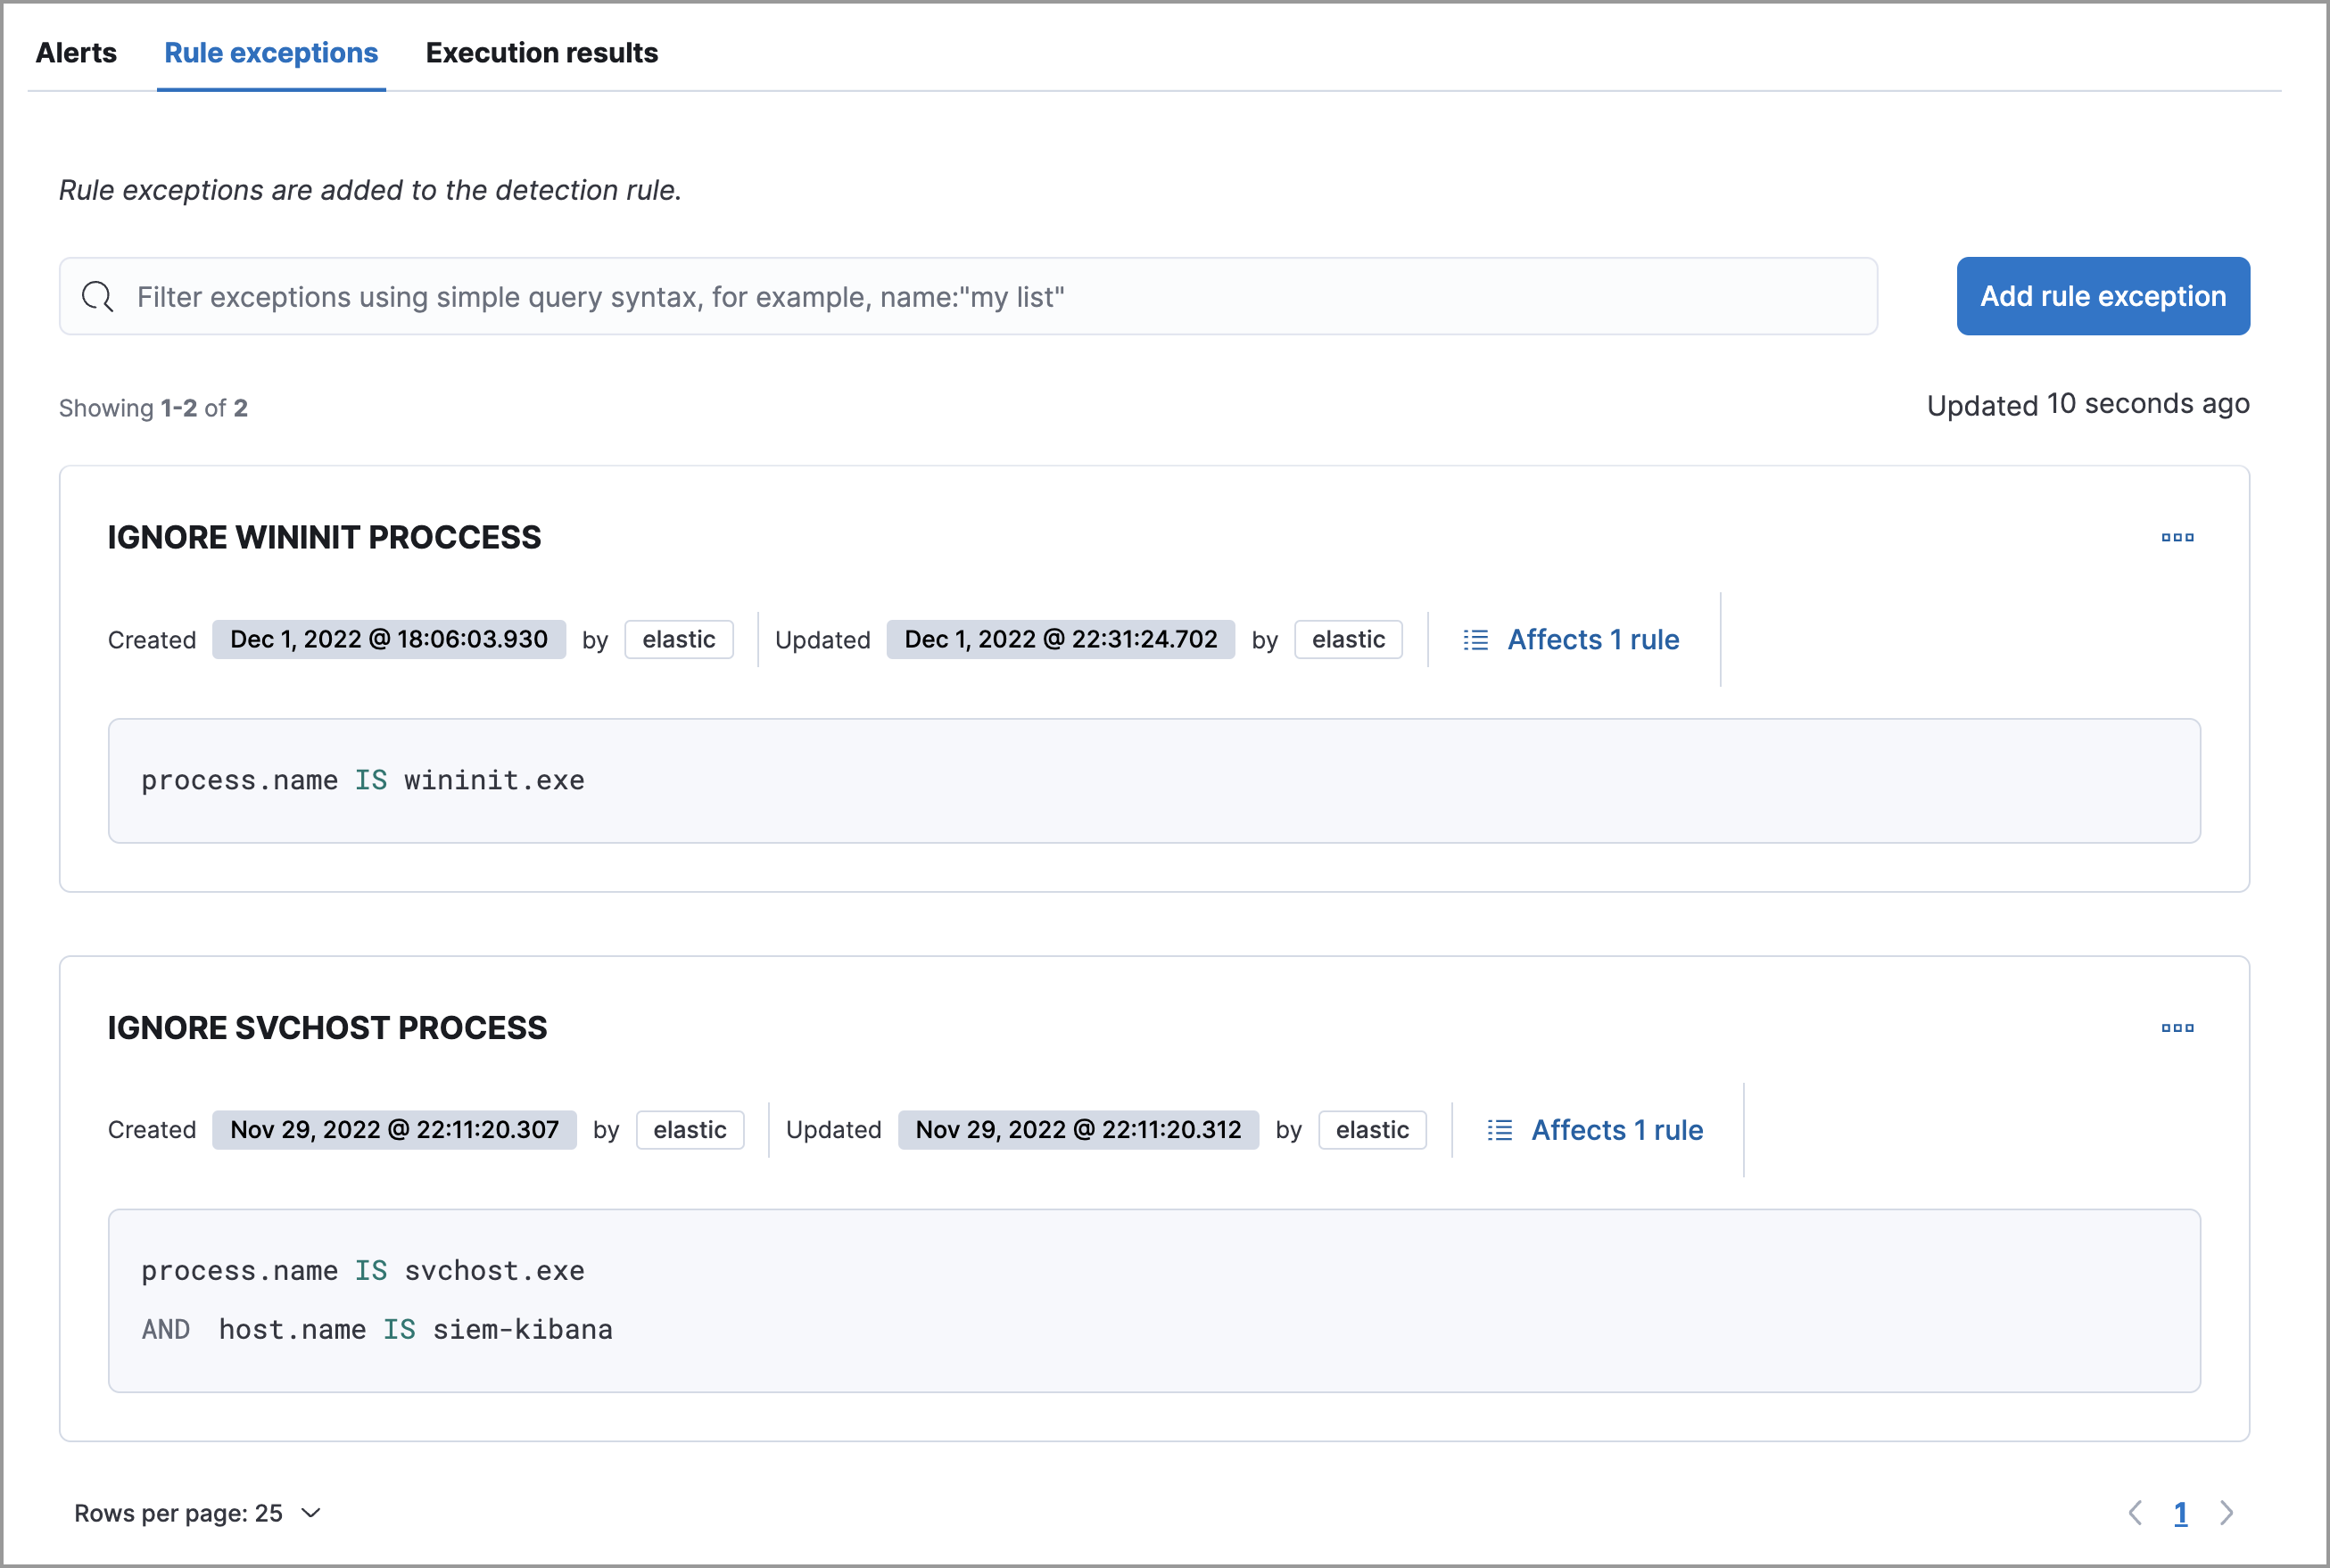
editThe following enhancements improve the exceptions feature’s UI and simplifies management:
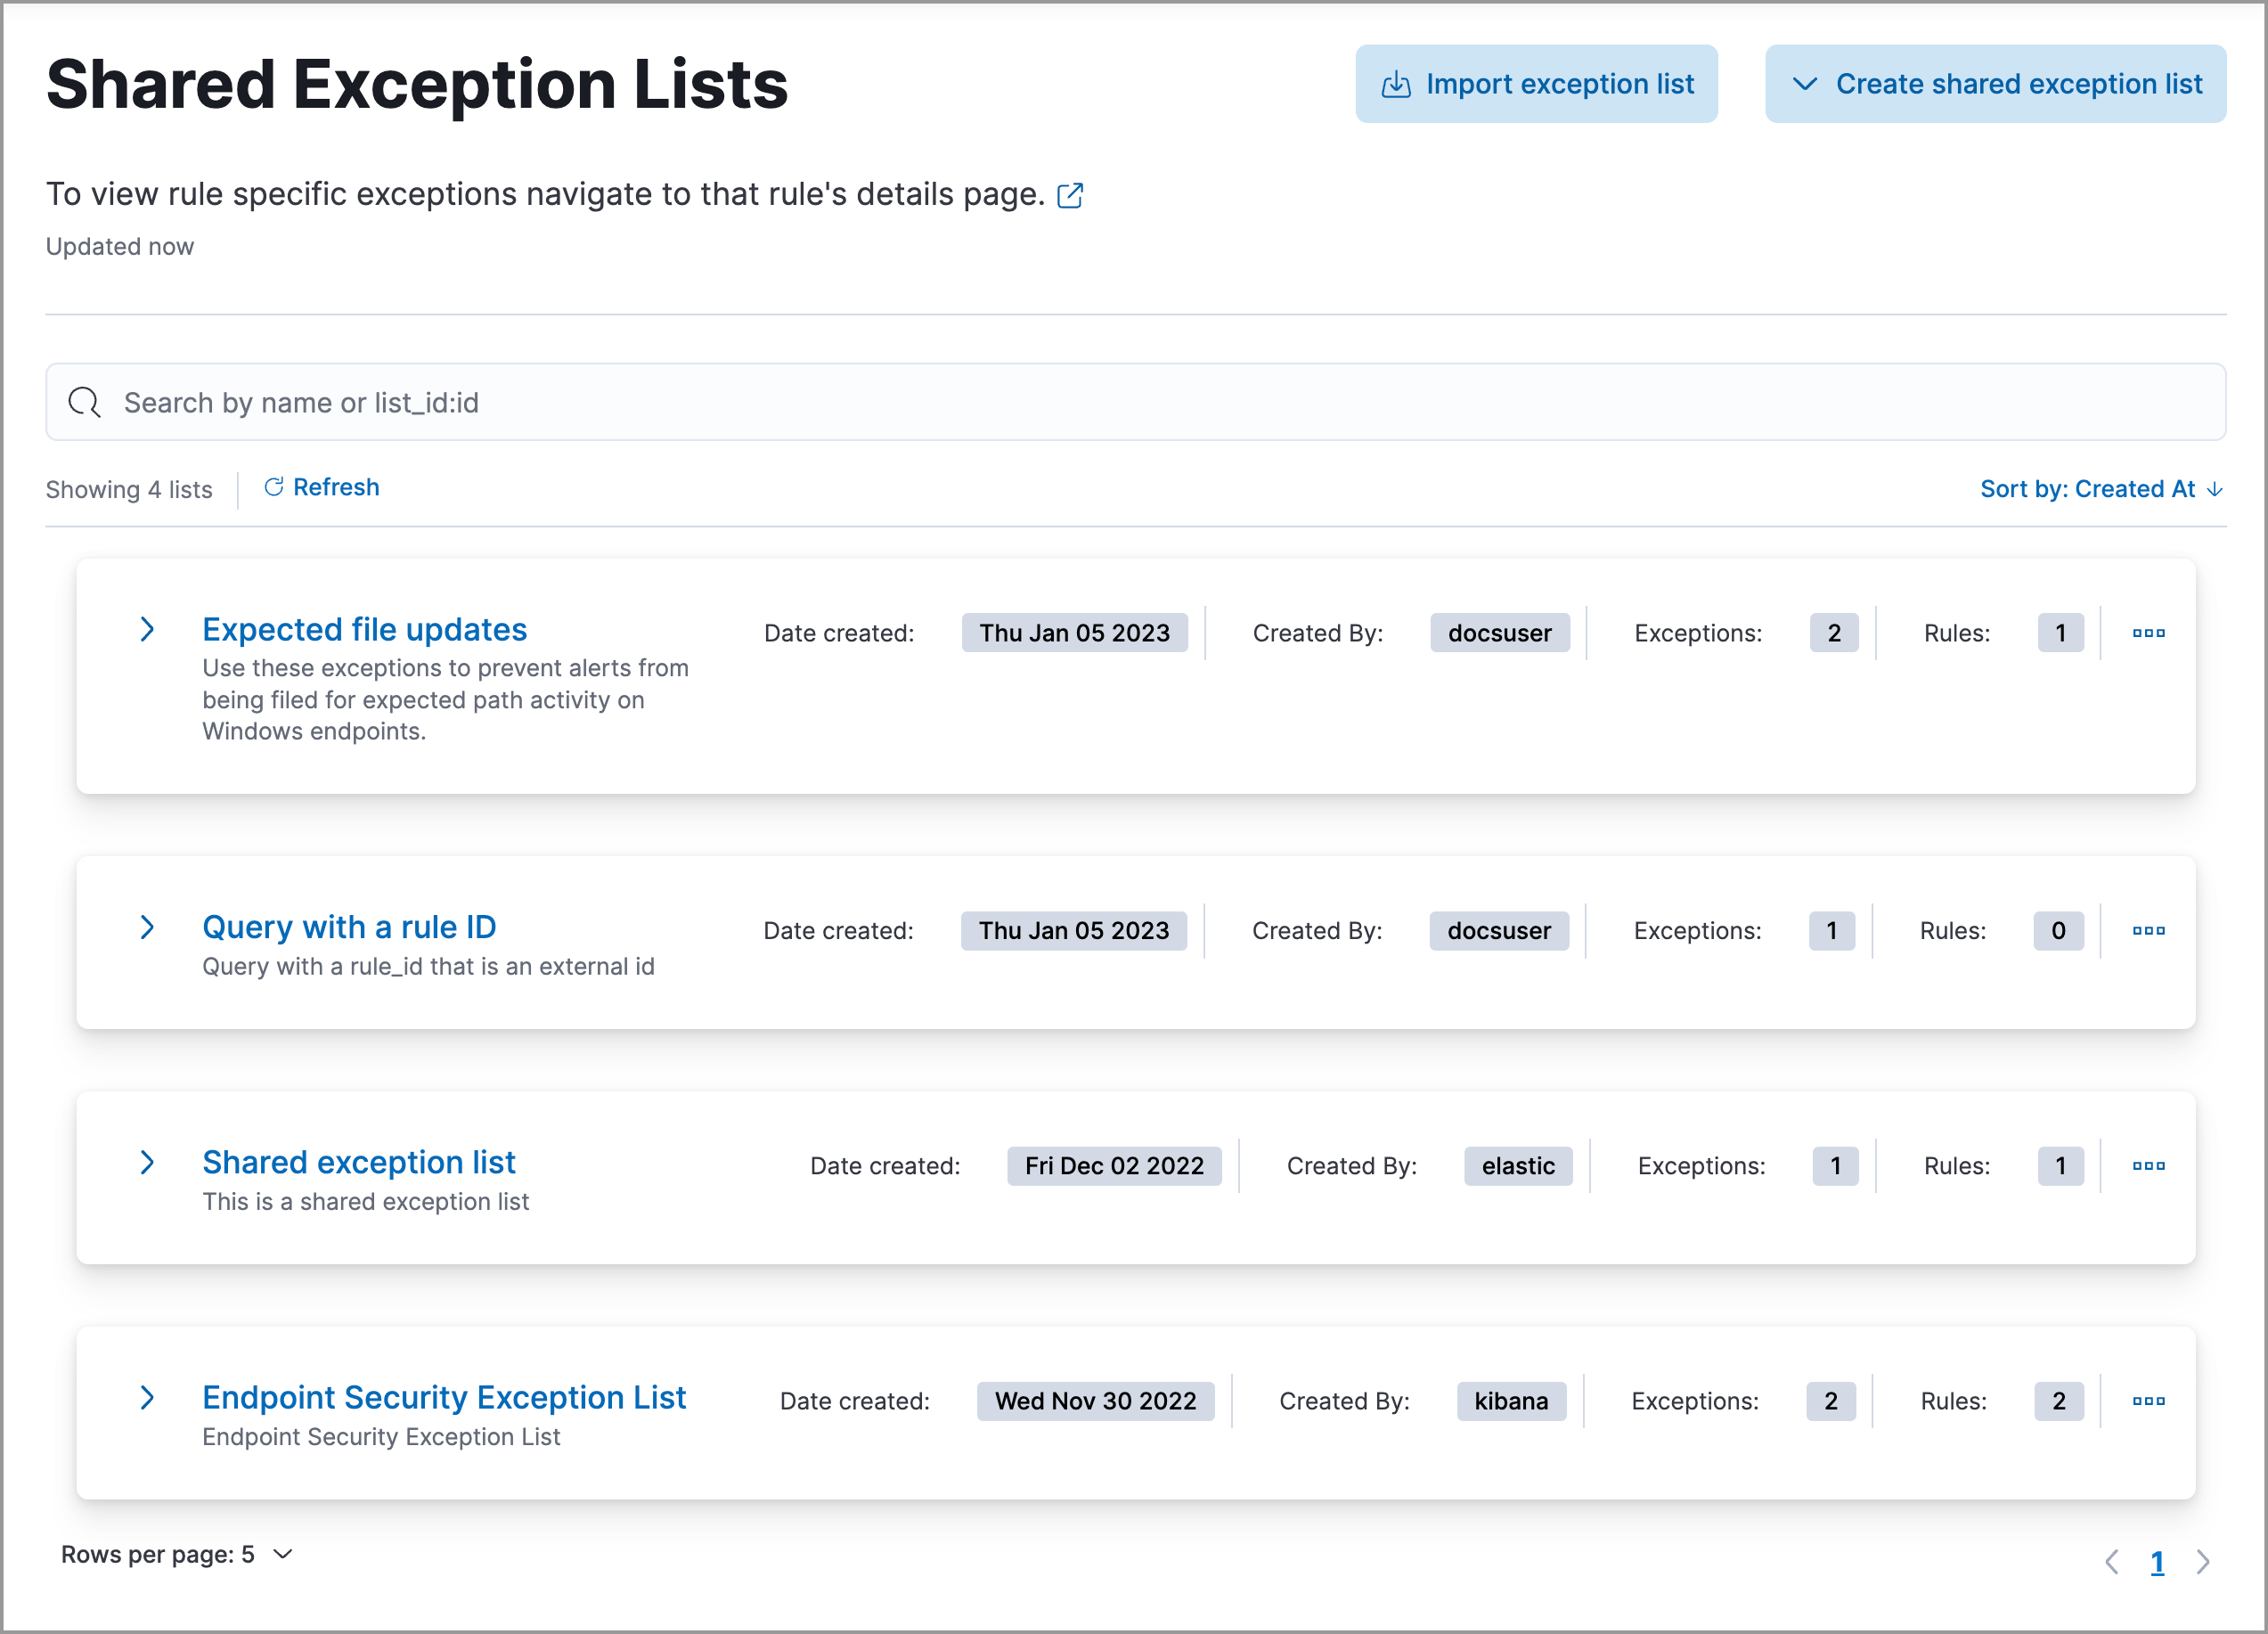
- The Exceptions lists page has been renamed to Shared Exception Lists, where you can create, manage, and import shared exception lists.
-
There are now two types of exception lists:
-
Default rule list: A default rule list is a group of exceptions that belong to a single rule. Other rules cannot use exceptions within a rule’s default rule list.

-
Shared exception list: A shared exception list allows you to group exceptions together, then apply them to multiple rules. Exception lists created in Elastic Stack versions 8.5 and earlier become shared exception lists in 8.6 or later. You can access all shared exception lists from the Shared Exception Lists page (Manage → Shared Exception Lists).

-
- You can now duplicate rules and their exceptions, or rules only.
Alerts enhancements
editAlert details flyout enhancements
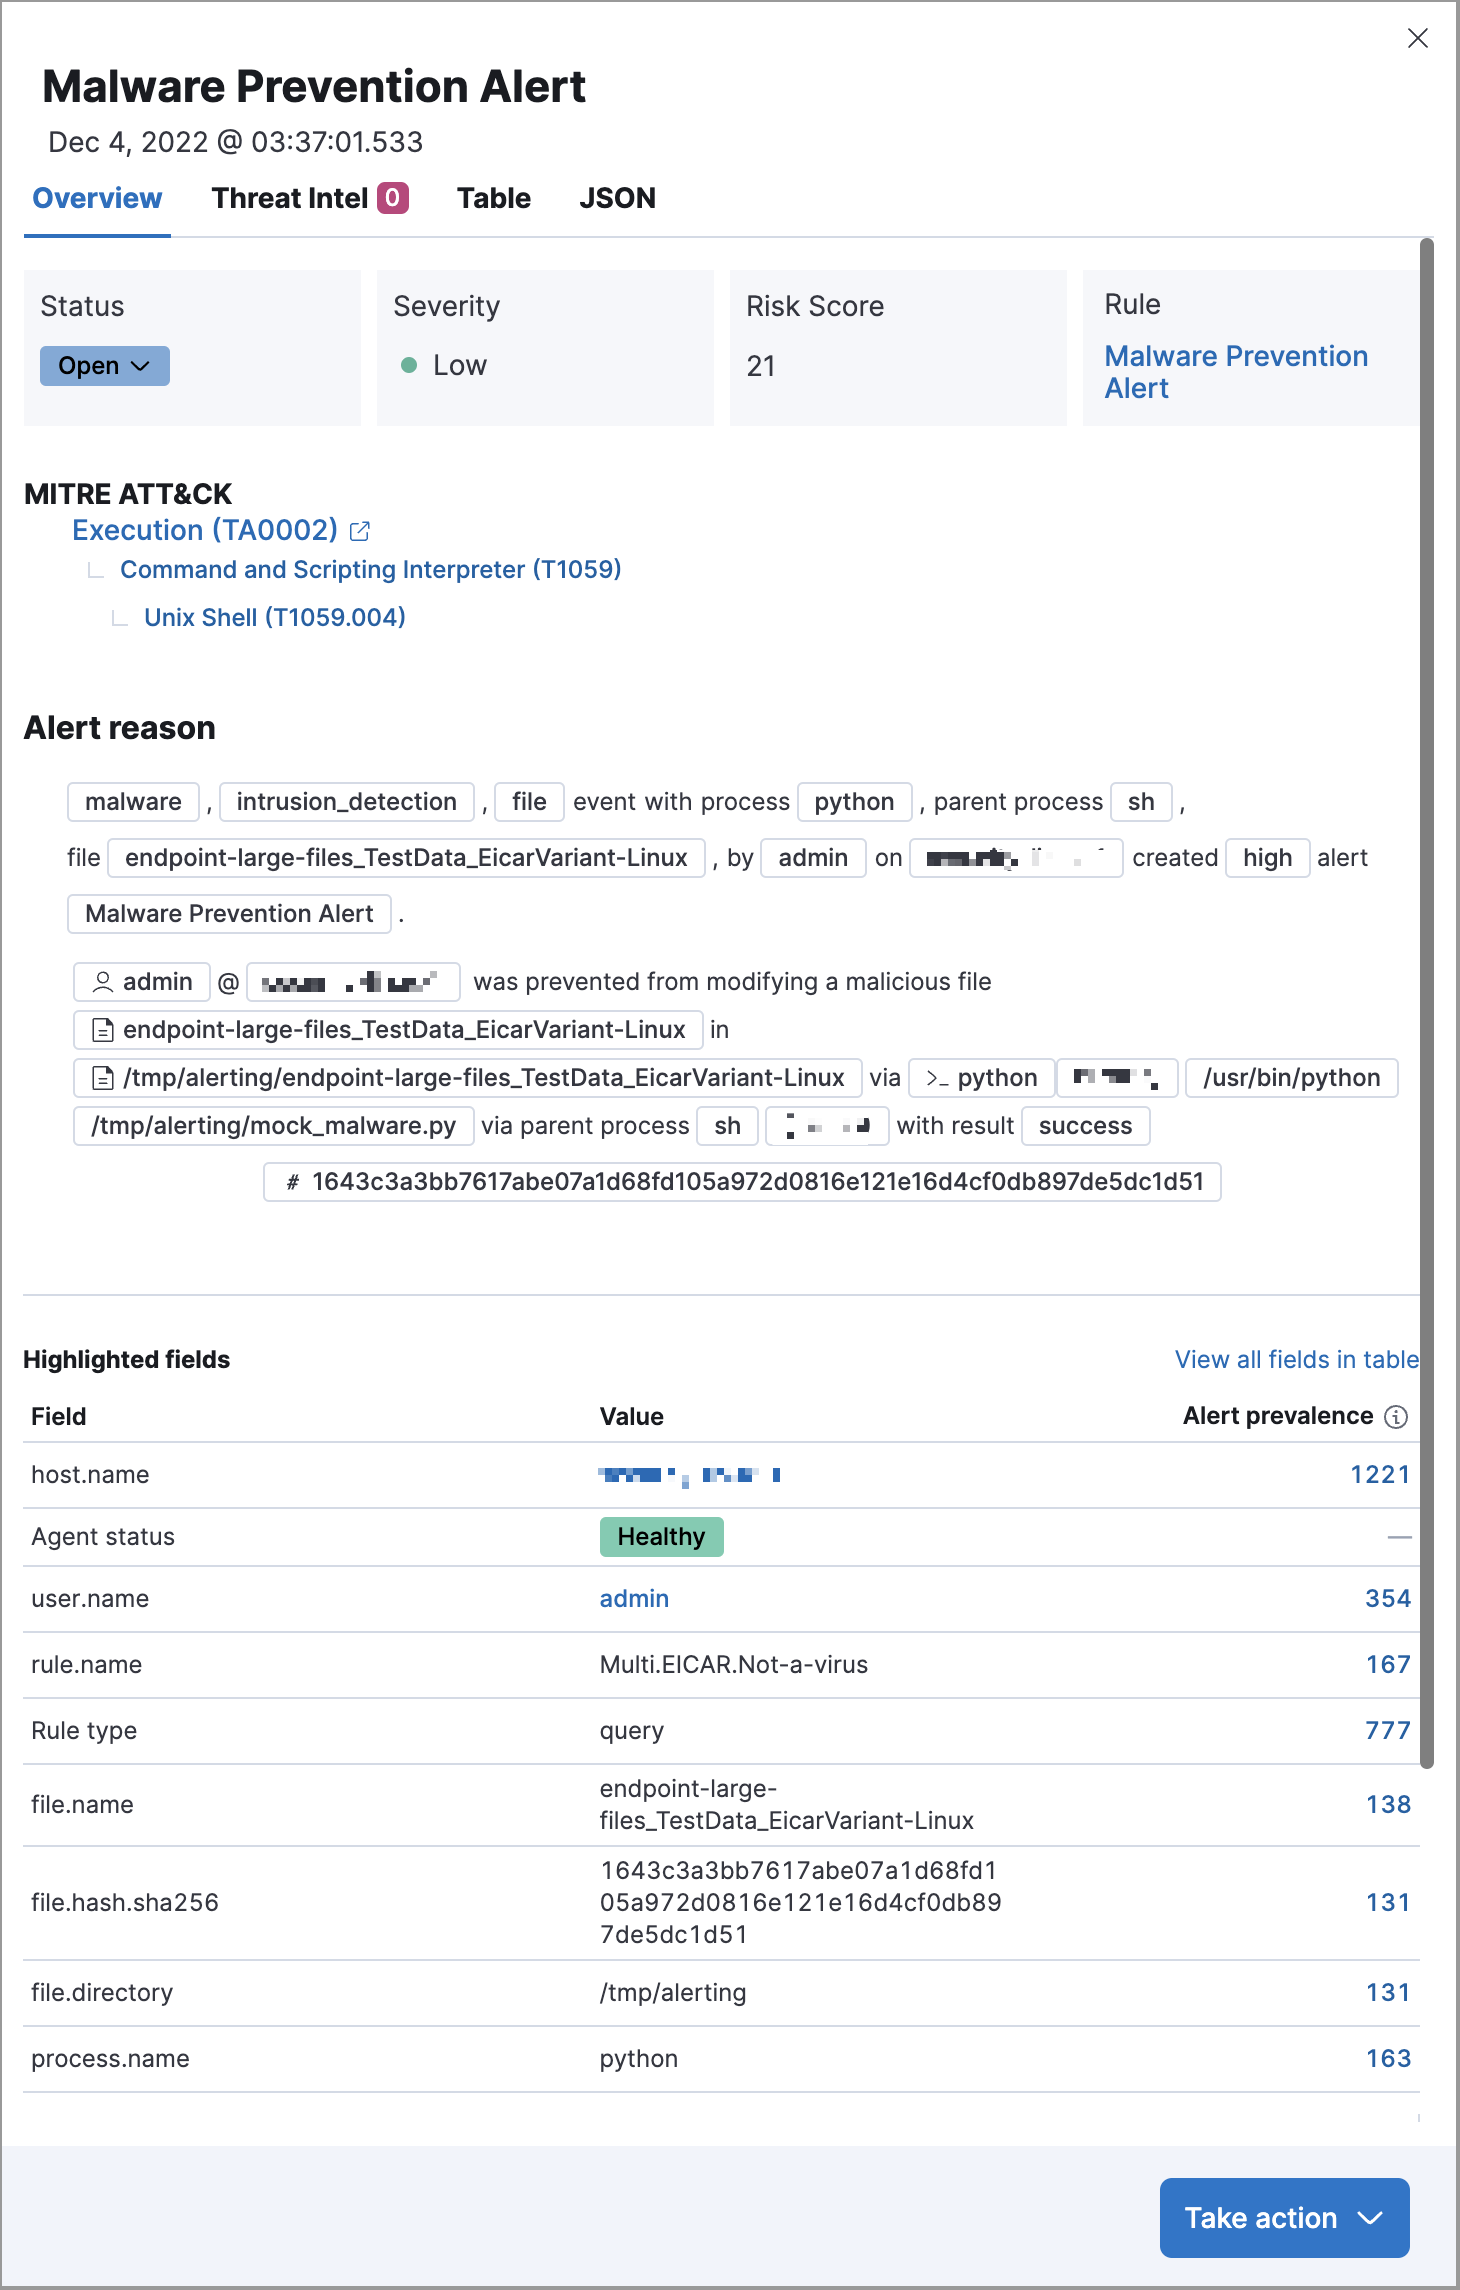
The following enhancements have been made to the alert details flyout. To learn more about analyzing detection alerts, refer to View alert details.
-
Changes to the Overview tab:
- The Alert summary section has been renamed to the Alert reason section.
-
MITRE ATT&CK details are now available.

Bulk add alerts to Timeline
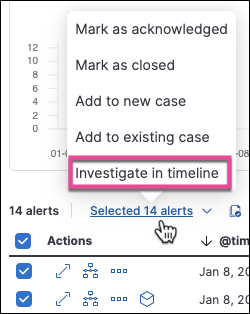
From the Alerts table, you can now investigate up to 2,000 alerts in Timeline.

Cloud Security Posture enhancements
editFile and Network events enabled for Session View
For events to appear in Session View, they must include additional ECS fields related to their context in the Linux process model. Previously, only process events could include the required fields. In 8.6, file and network events can also include the necessary fields, meaning that file and network alerts can appear in Session View in addition to process alerts.
Capture Linux environment variables
You can now configure a policy to capture up to five environment variables (key-value pairs) from Linux hosts. This allows you to capture additional information relevant to investigations.
Enhanced Cloud Posture dashboard
The Cloud Posture dashboard has an improved user interface, including more ways to directly access the Findings page.

Threat intelligence enhancements
editUpdated Threat intelligence UI
A View indicators button has been added to the Threat Intelligence view on the Overview dashboard. Click this button to go directly to the Indicators page, where you can view more details about ingested indicators.

Add cases to indicators
Adding indicators to cases allows you to escalate threats to other teams and workflows using Elastic Security cases. You can add indicators to cases from the Indicators table or the Indicators details flyout.
Indicators page enhancements
The following enhancements have been made to the Indicators page. To learn more about analyzing indicators, refer to Indicators of compromise.
- A status message added beneath the KQL search bar reflects when the Indicators page was last updated.
- You can now view the Indicators page in full-screen mode.
- A Copy to Clipboard action has been added to the Indicators table.
- The Trend chart now shows the total values in the legend.
