- Observability: other versions:
- Get started
- What is Elastic Observability?
- What’s new in 8.17
- Quickstart: Monitor hosts with Elastic Agent
- Quickstart: Monitor your Kubernetes cluster with Elastic Agent
- Quickstart: Monitor hosts with OpenTelemetry
- Quickstart: Unified Kubernetes Observability with Elastic Distributions of OpenTelemetry (EDOT)
- Quickstart: Collect data with AWS Firehose
- Add data from Splunk
- Applications and services
- Application performance monitoring (APM)
- Get started
- Learn about data types
- Collect application data
- View and analyze data
- Act on data
- Use APM securely
- Manage storage
- Configure APM Server
- Monitor APM Server
- APM APIs
- Troubleshooting
- Upgrade
- Release notes
- Known issues
- Synthetic monitoring
- Get started
- Scripting browser monitors
- Configure lightweight monitors
- Manage monitors
- Work with params and secrets
- Analyze monitor data
- Monitor resources on private networks
- Use the CLI
- Configure projects
- Multi-factor Authentication
- Configure Synthetics settings
- Grant users access to secured resources
- Manage data retention
- Use Synthetics with traffic filters
- Migrate from the Elastic Synthetics integration
- Scale and architect a deployment
- Synthetics support matrix
- Synthetics Encryption and Security
- Troubleshooting
- Real user monitoring
- Uptime monitoring (deprecated)
- Tutorial: Monitor a Java application
- Application performance monitoring (APM)
- CI/CD
- Cloud
- Infrastructure and hosts
- Logs
- Troubleshooting
- Incident management
- Data set quality
- Observability AI Assistant
- Reference
Create and manage rules
editCreate and manage rules
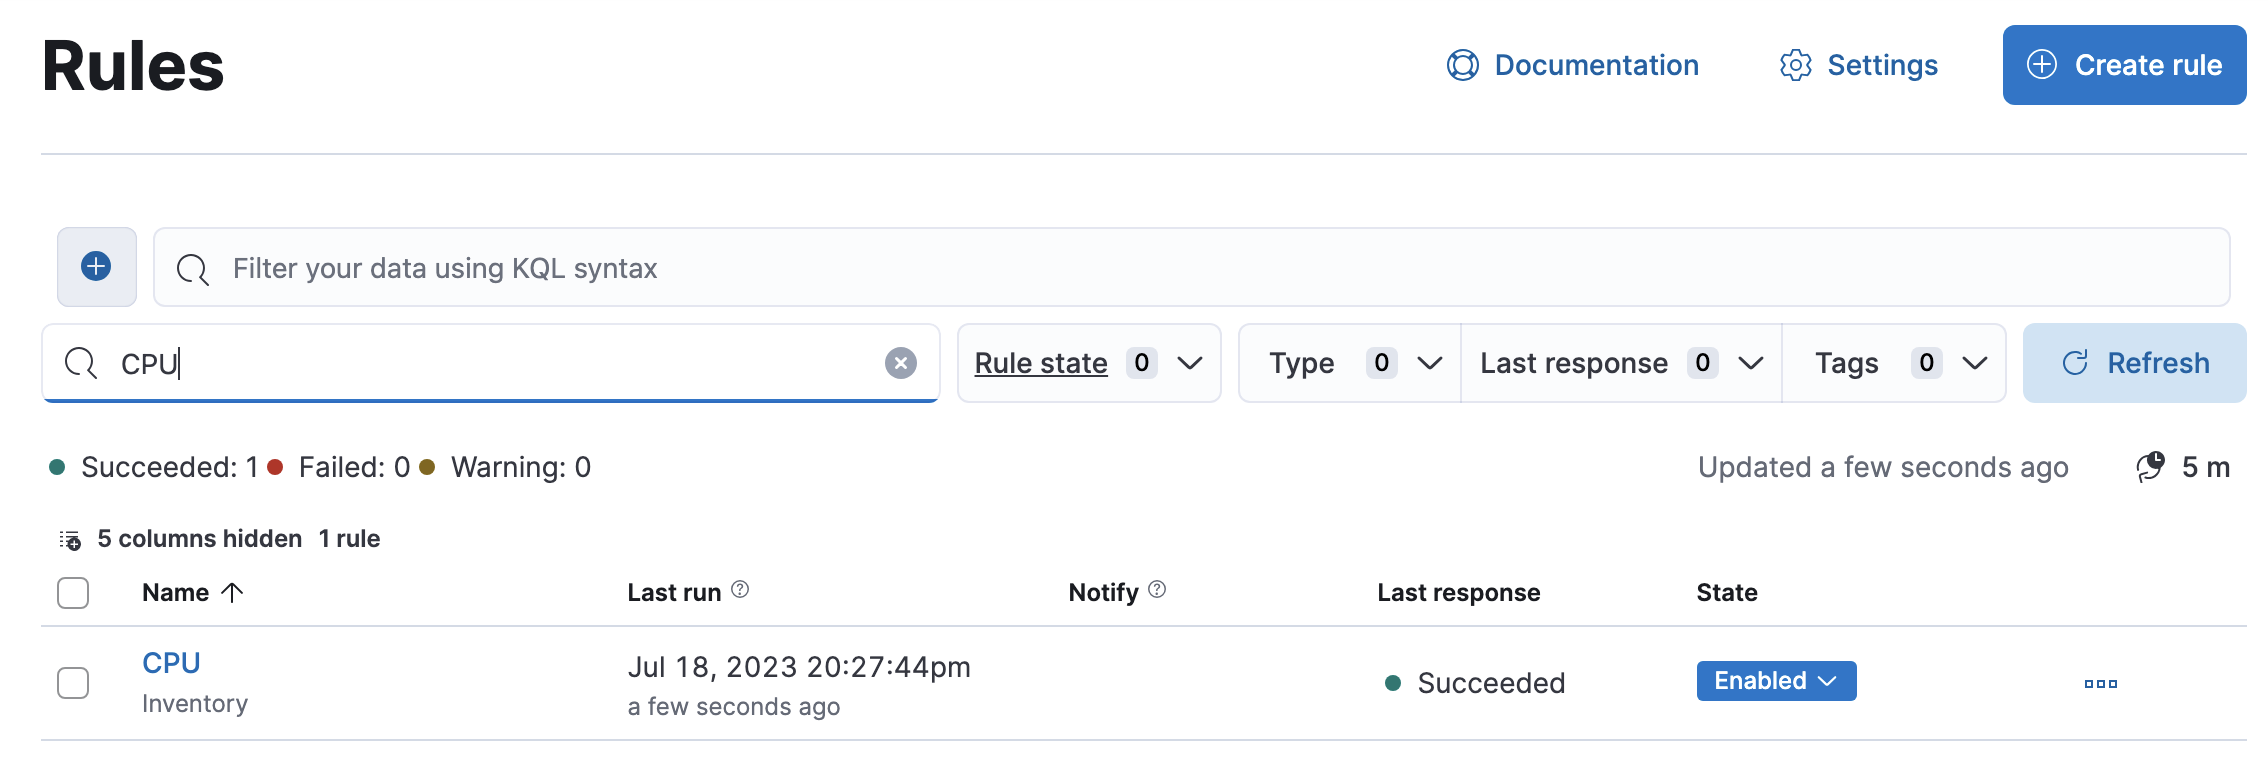
editThe first step when setting up alerts is to create a rule. To create and manage rules related to Observability apps, go to the Observability Alerts page and click Manage Rules to navigate to the Observability Rules page. You can also create rules directly from most Observability UIs by clicking Alerts and rules and selecting a rule.
To create SLO rules, you must first define a new SLO via the Create new SLO button. Once an SLO has been defined, you can create SLO rules tied to this SLO.

You can also centrally create and manage rules, including rules not related to Observability, from the Kibana Management UI.
From the Observability Rules page, you can manage rules for Observability apps, including:
- Creating a new rule
- Editing or deleting existing rules
- Updating the status of existing rules (Enabled, Disabled, or Snoozed indefinitely)
The Observability Rules page allows you to set a rule to be "Snoozed indefinitely". To snooze a rule for a specific time period, you must use the centralized Rules page.
[preview] This functionality is in technical preview and may be changed or removed in a future release. Elastic will work to fix any issues, but features in technical preview are not subject to the support SLA of official GA features. To temporarily suppress notifications for all rules, create a maintenance window.
Extend your rules by connecting them to actions that use built-in connectors for email, IBM Resilient, Index, JIRA, Microsoft Teams, PagerDuty, Server log, ServiceNow ITSM, ServiceNow SecOps, ServiceNow ITOM, Opsgenie, and Slack. Also supported is a powerful webhook output letting you tie into other third-party systems. Connectors allow actions to talk to these services and integrations.
Learn how to create specific types of rules:
All of Observability |
|
APM |
|
Infrastructure |
|
Logs |
|
Synthetics |
|
Uptime ( [8.15.0] Deprecated in 8.15.0. ) |
View rule details
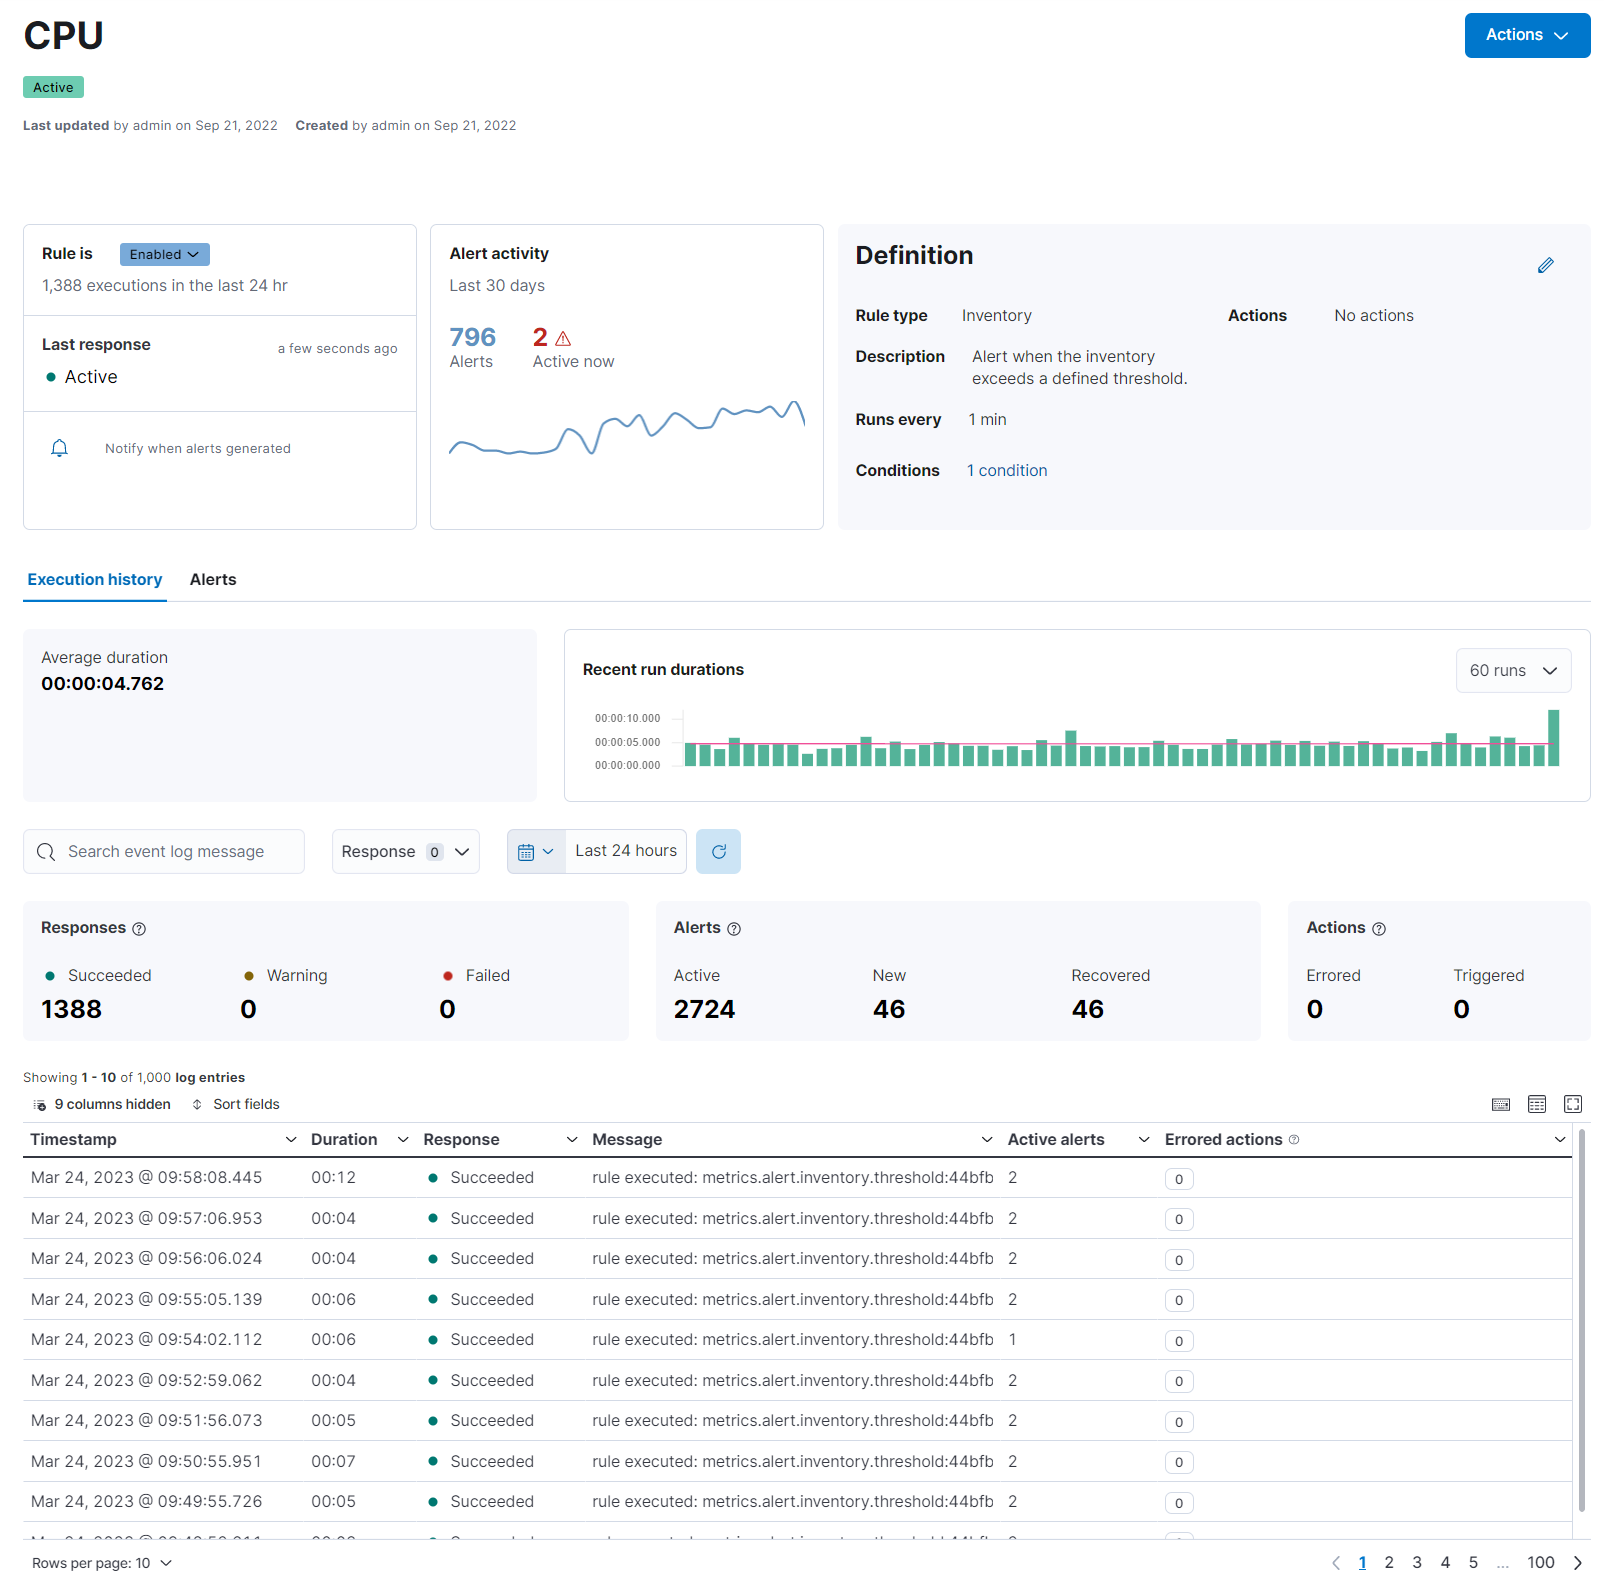
editClick on an individual rule on the Rules page to view details including the rule name, status, definition, execution history, related alerts, and more.

You can also view rule details by clicking on individual rules in the Kibana Management UI.
View and manage alerts
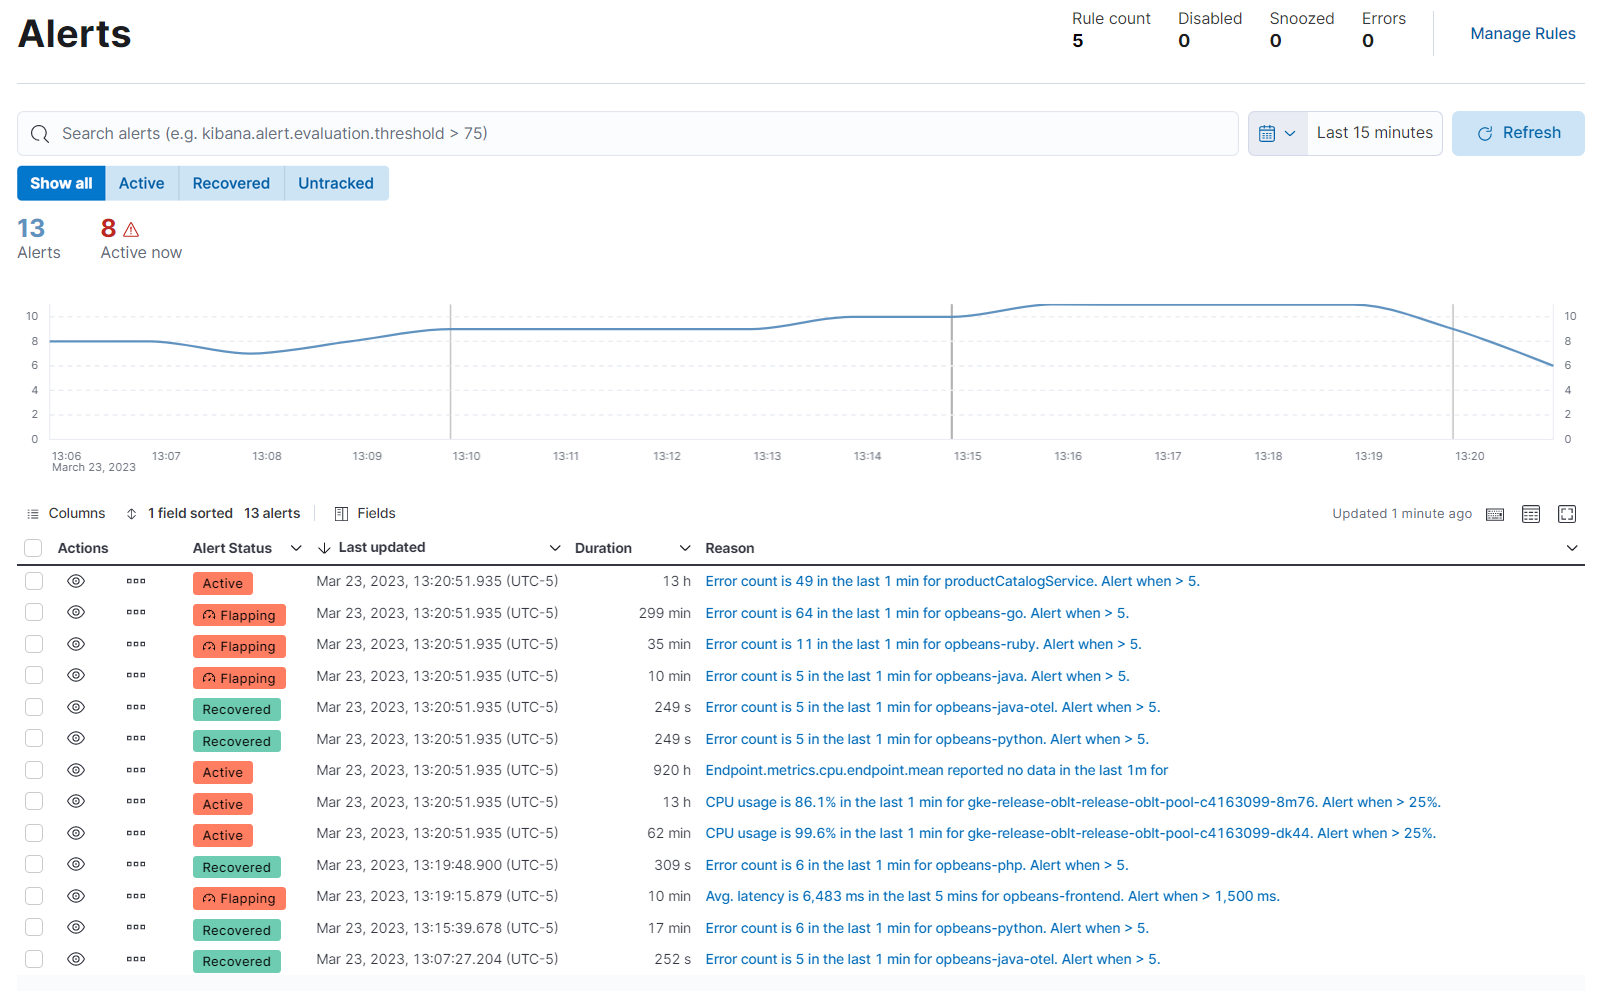
editThe Alerts page lists all your alerts that have met a condition defined by a rule you created using one of the Observability apps.
Learn more about viewing and managing alerts in View alerts.

Not all the predefined rules in Stack Management will generate and list an alert on the Observability Alerts page. Only alerts generated by rules relating to Applications, Logs, Infrastructure, Synthetics, and Uptime can be viewed on the Alerts page.
Configure alerts
editYou may want to disable writing to specific Observability alert indices or disable all alerts and remove the Alerts page altogether. You can do this in Kibana settings.
If you are using our hosted Elasticsearch Service on Elastic Cloud, you’ll edit the Kibana user settings:
- Select your deployment on the home page, and from your deployment menu go to the Edit page.
- In the Kibana section, click Edit user settings, and add the desired settings (detailed below).
-
Click Back, and then click Save. The changes are automatically appended to the
kibana.ymlconfiguration file for your instance.
If you have a self-managed Elastic Stack, you’ll edit the settings in your kibana.yml file.
Disable writing to specific alert indices
editTo disable writing to specific Observability alerts-as-data indices
while continuing to write to others, use xpack.ruleRegistry.write.disabledRegistrationContexts.
You can disable writing to alert indices for:
-
Logs (
observability.logs) -
Infrastructure (
observability.metrics) -
APM (
observability.apm) -
Uptime (
observability.uptime)
Disabling writing to the indices of one of the Observability apps listed above will affect all rule types of the corresponding app. For example, disabling writing to uptime alert indices will affect all uptime rule types including monitor status and TLS rule types.
For example, to disable writing to Logs alert indices, you would add the following to your Kibana settings:
xpack.ruleRegistry.write.disabledRegistrationContexts : ['observability.logs']
To disable writing to both Logs and Uptime alert indices, you would use:
xpack.ruleRegistry.write.disabledRegistrationContexts : ['observability.logs', 'observability.uptime']
Remove the Alerts page
editTo disable writing to all alert indices and remove the Alerts page from Kibana altogether, use the following settings:
xpack.ruleRegistry.write.enabled: 'false'
xpack.observability.unsafe.alertingExperience.enabled: 'false'
On this page