- Kibana Guide: other versions:
- What is Kibana?
- What’s new in 8.8
- Kibana concepts
- Quick start
- Set up
- Install Kibana
- Configure Kibana
- Alerting and action settings
- APM settings
- Banners settings
- Cases settings
- Enterprise Search settings
- Fleet settings
- i18n settings
- Logging settings
- Logs settings
- Metrics settings
- Monitoring settings
- Reporting settings
- Search sessions settings
- Secure settings
- Security settings
- Spaces settings
- Task Manager settings
- Telemetry settings
- URL drilldown settings
- Start and stop Kibana
- Access Kibana
- Securing access to Kibana
- Add data
- Upgrade Kibana
- Configure security
- Configure reporting
- Configure logging
- Configure monitoring
- Command line tools
- Production considerations
- Discover
- Dashboard and visualizations
- Canvas
- Maps
- Build a map to compare metrics by country or region
- Track, visualize, and alert on assets in real time
- Map custom regions with reverse geocoding
- Heat map layer
- Tile layer
- Vector layer
- Plot big data
- Search geographic data
- Configure map settings
- Connect to Elastic Maps Service
- Import geospatial data
- Troubleshoot
- Reporting and sharing
- Machine learning
- Graph
- Alerting
- Observability
- APM
- Security
- Dev Tools
- Fleet
- Osquery
- Stack Monitoring
- Stack Management
- REST API
- Get features API
- Kibana spaces APIs
- Kibana role management APIs
- User session management APIs
- Saved objects APIs
- Data views API
- Index patterns APIs
- Alerting APIs
- Action and connector APIs
- Cases APIs
- Add comment
- Create case
- Delete cases
- Delete comments
- Find case activity
- Find cases
- Find connectors
- Get alerts
- Get case activity
- Get case
- Get case status
- Get cases by alert
- Get comments
- Get configuration
- Get reporters
- Get tags
- Push case
- Set configuration
- Update cases
- Update comment
- Update configuration
- Import and export dashboard APIs
- Logstash configuration management APIs
- Machine learning APIs
- Osquery manager API
- Short URLs APIs
- Get Task Manager health
- Upgrade assistant APIs
- Kibana plugins
- Troubleshooting
- Accessibility
- Release notes
- Kibana 8.8.2
- Kibana 8.8.1
- Kibana 8.8.0
- Kibana 8.7.1
- Kibana 8.7.0
- Kibana 8.6.1
- Kibana 8.6.0
- Kibana 8.5.2
- Kibana 8.5.1
- Kibana 8.5.0
- Kibana 8.4.3
- Kibana 8.4.2
- Kibana 8.4.1
- Kibana 8.4.0
- Kibana 8.3.3
- Kibana 8.3.2
- Kibana 8.3.1
- Kibana 8.3.0
- Kibana 8.2.3
- Kibana 8.2.2
- Kibana 8.2.1
- Kibana 8.2.0
- Kibana 8.1.3
- Kibana 8.1.2
- Kibana 8.1.1
- Kibana 8.1.0
- Kibana 8.0.0
- Kibana 8.0.0-rc2
- Kibana 8.0.0-rc1
- Kibana 8.0.0-beta1
- Kibana 8.0.0-alpha2
- Kibana 8.0.0-alpha1
- Developer guide
Observe Lambda functions
editObserve Lambda functions
editElastic APM provides performance and error monitoring for AWS Lambda functions. Get insight into function execution and runtime behavior, as well as visibility into how your Lambda functions relate to and depend on other services.
To set up Lambda monitoring, see the relevant quick start guide.
Cold starts
editA cold start occurs when a Lambda function has not been used for a certain period of time. A lambda worker receives a request to run the function and prepares an execution environment.
Cold starts are an unavoidable byproduct of the serverless world, but visibility into how they impact your services can help you make better decisions about factors like how much memory to allocate to a function, whether to enable provisioned concurrency, or if it’s time to consider removing a large dependency.
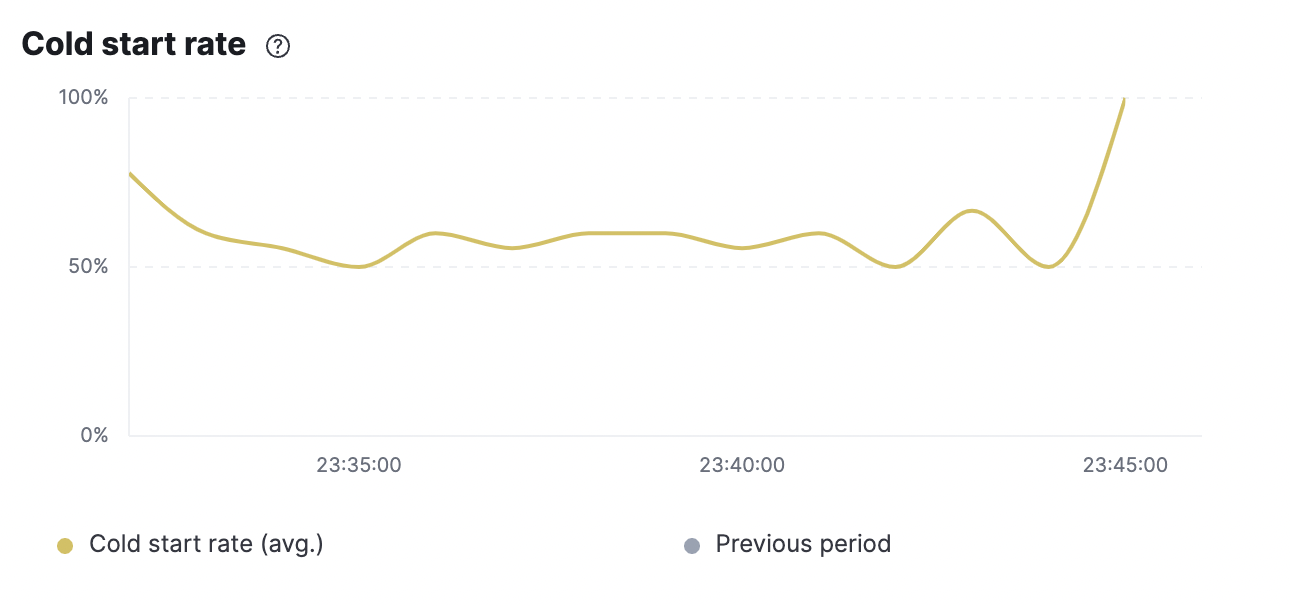
Cold start rate
editThe cold start rate (i.e. proportion of requests that experience a cold start) is displayed per service and per transaction.
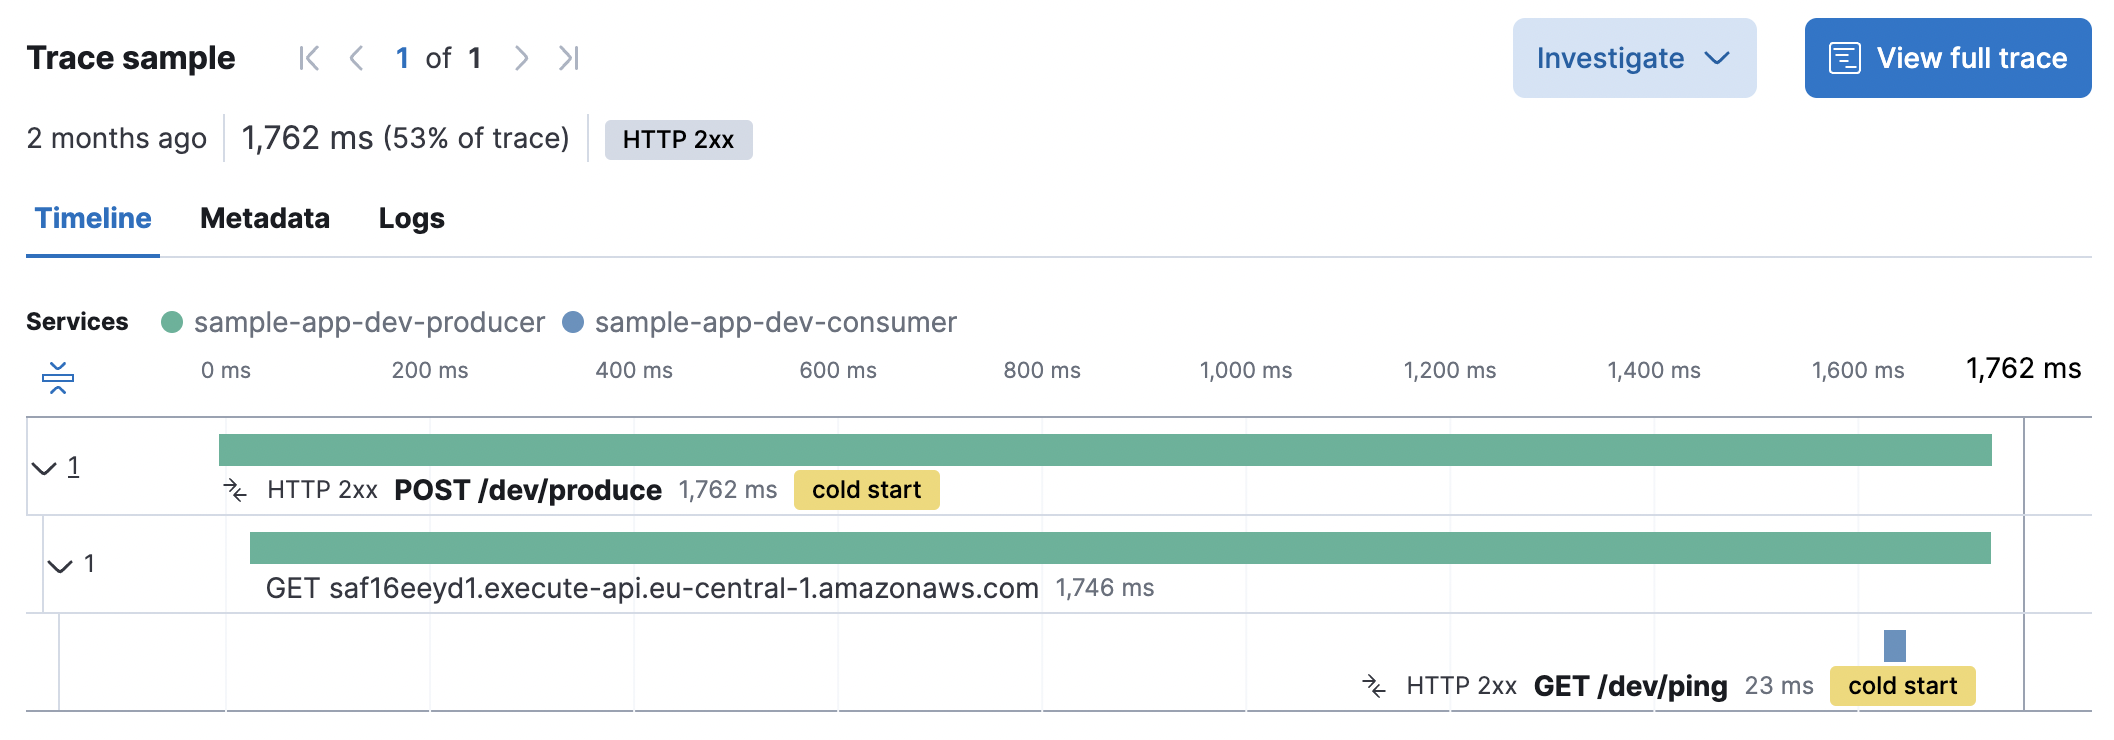
Cold start is also displayed in the trace waterfall, where you can drill-down into individual traces and see trace metadata like AWS request ID, trigger type, and trigger request ID.
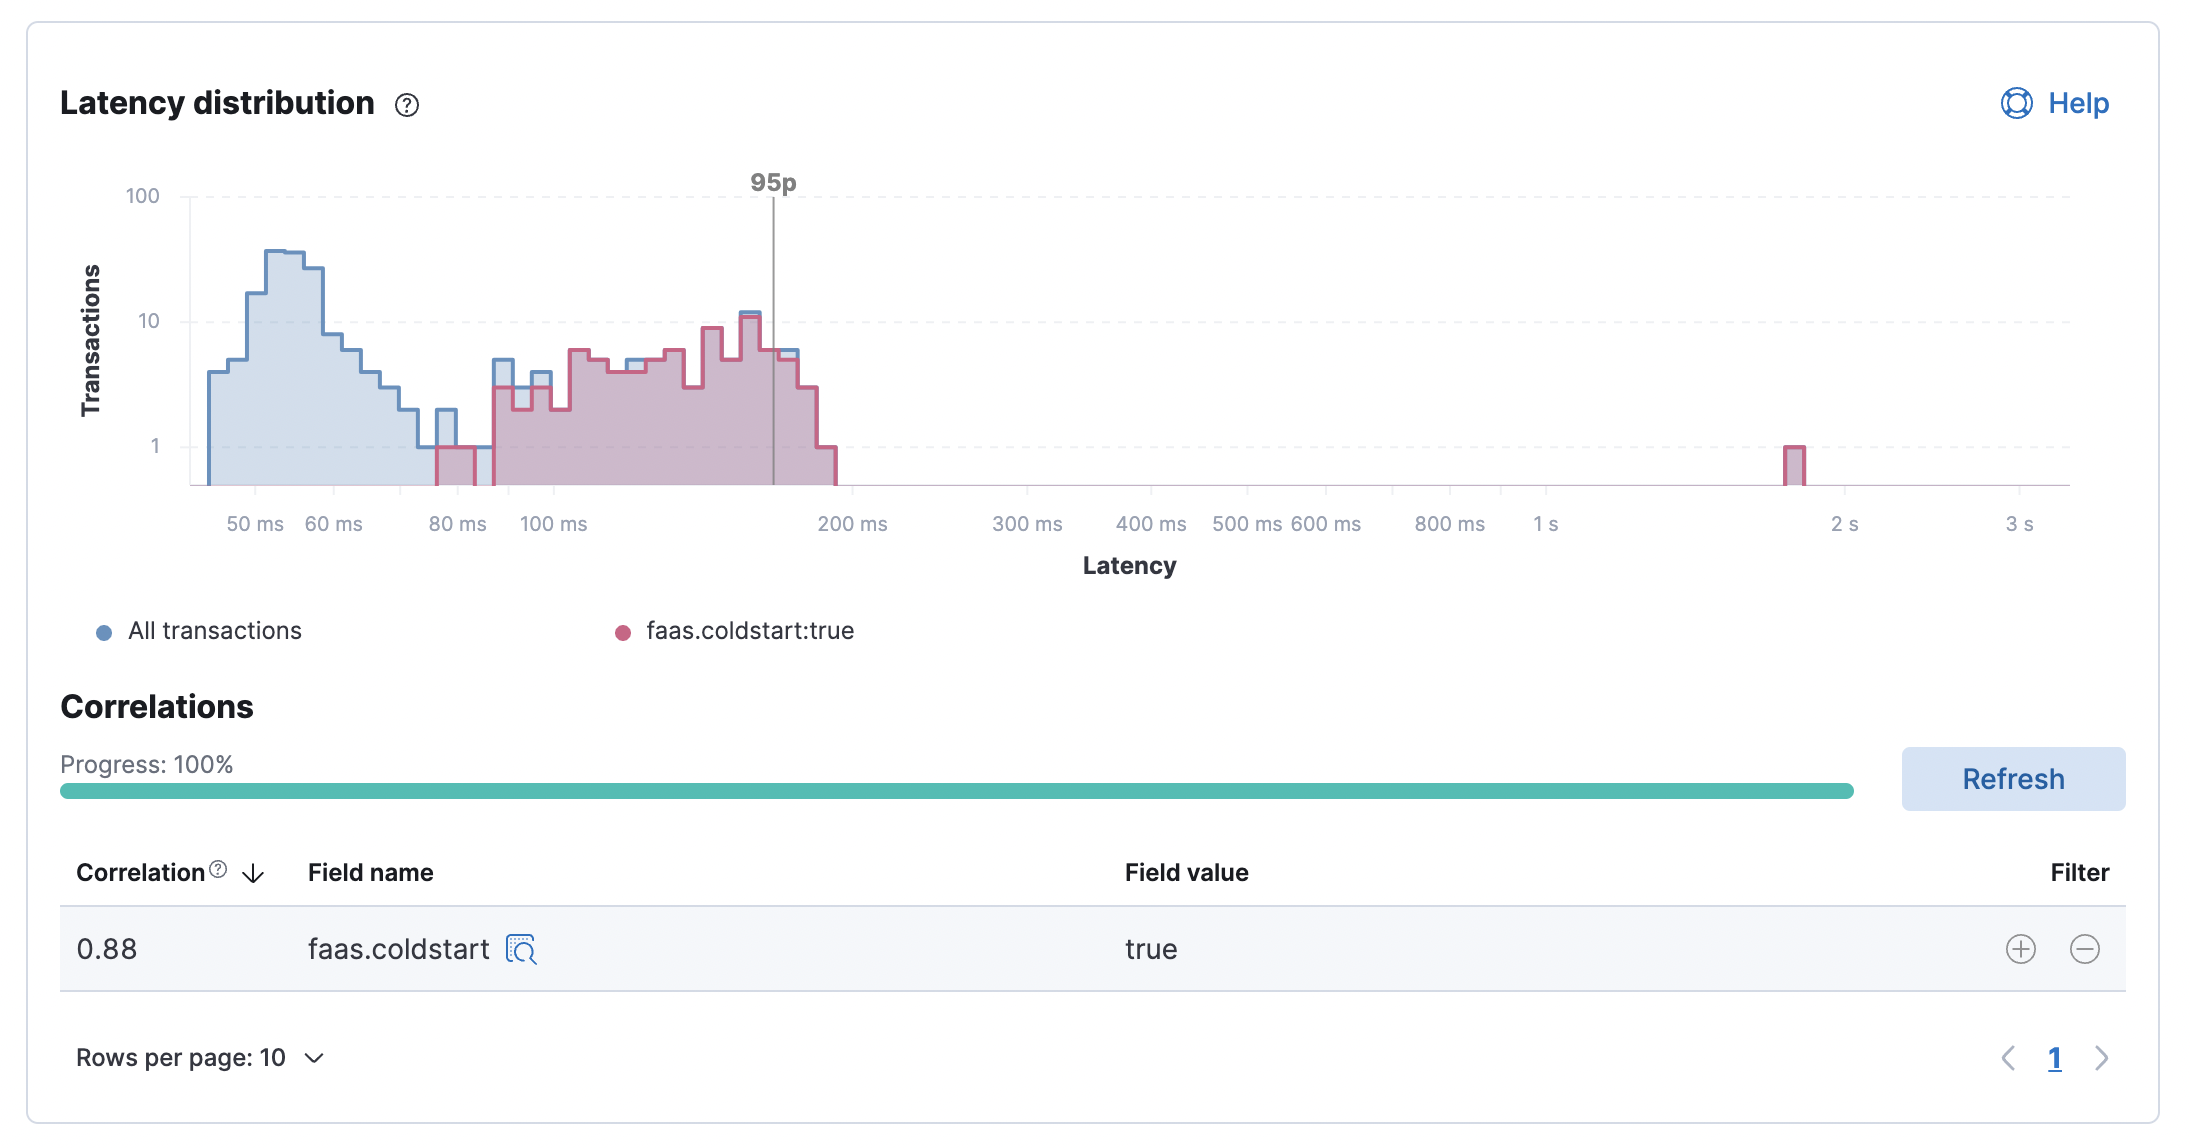
Latency distribution correlation
editThe latency correlations feature can be used to visualize the impact of Lambda cold starts on latency—just select the faas.coldstart
field.
AWS Lambda function grouping
editThe default APM agent configuration results in one APM service per AWS Lambda function, where the Lambda function name is the service name.
In some use cases, it makes more sense to logically group multiple lambda functions under a single
APM service. You can achieve this by setting the ELASTIC_APM_SERVICE_NAME
environment variable
on related Lambda functions to the same value.