Mobile service overview
editMobile service overview
editSelecting a mobile service brings you to the Mobile service overview. The Mobile service overview contains a wide variety of charts and tables that provide high-level visibility into how a mobile service is performing for your users—enabling you to make data-driven decisions about how to improve your user experience.
For example, see:
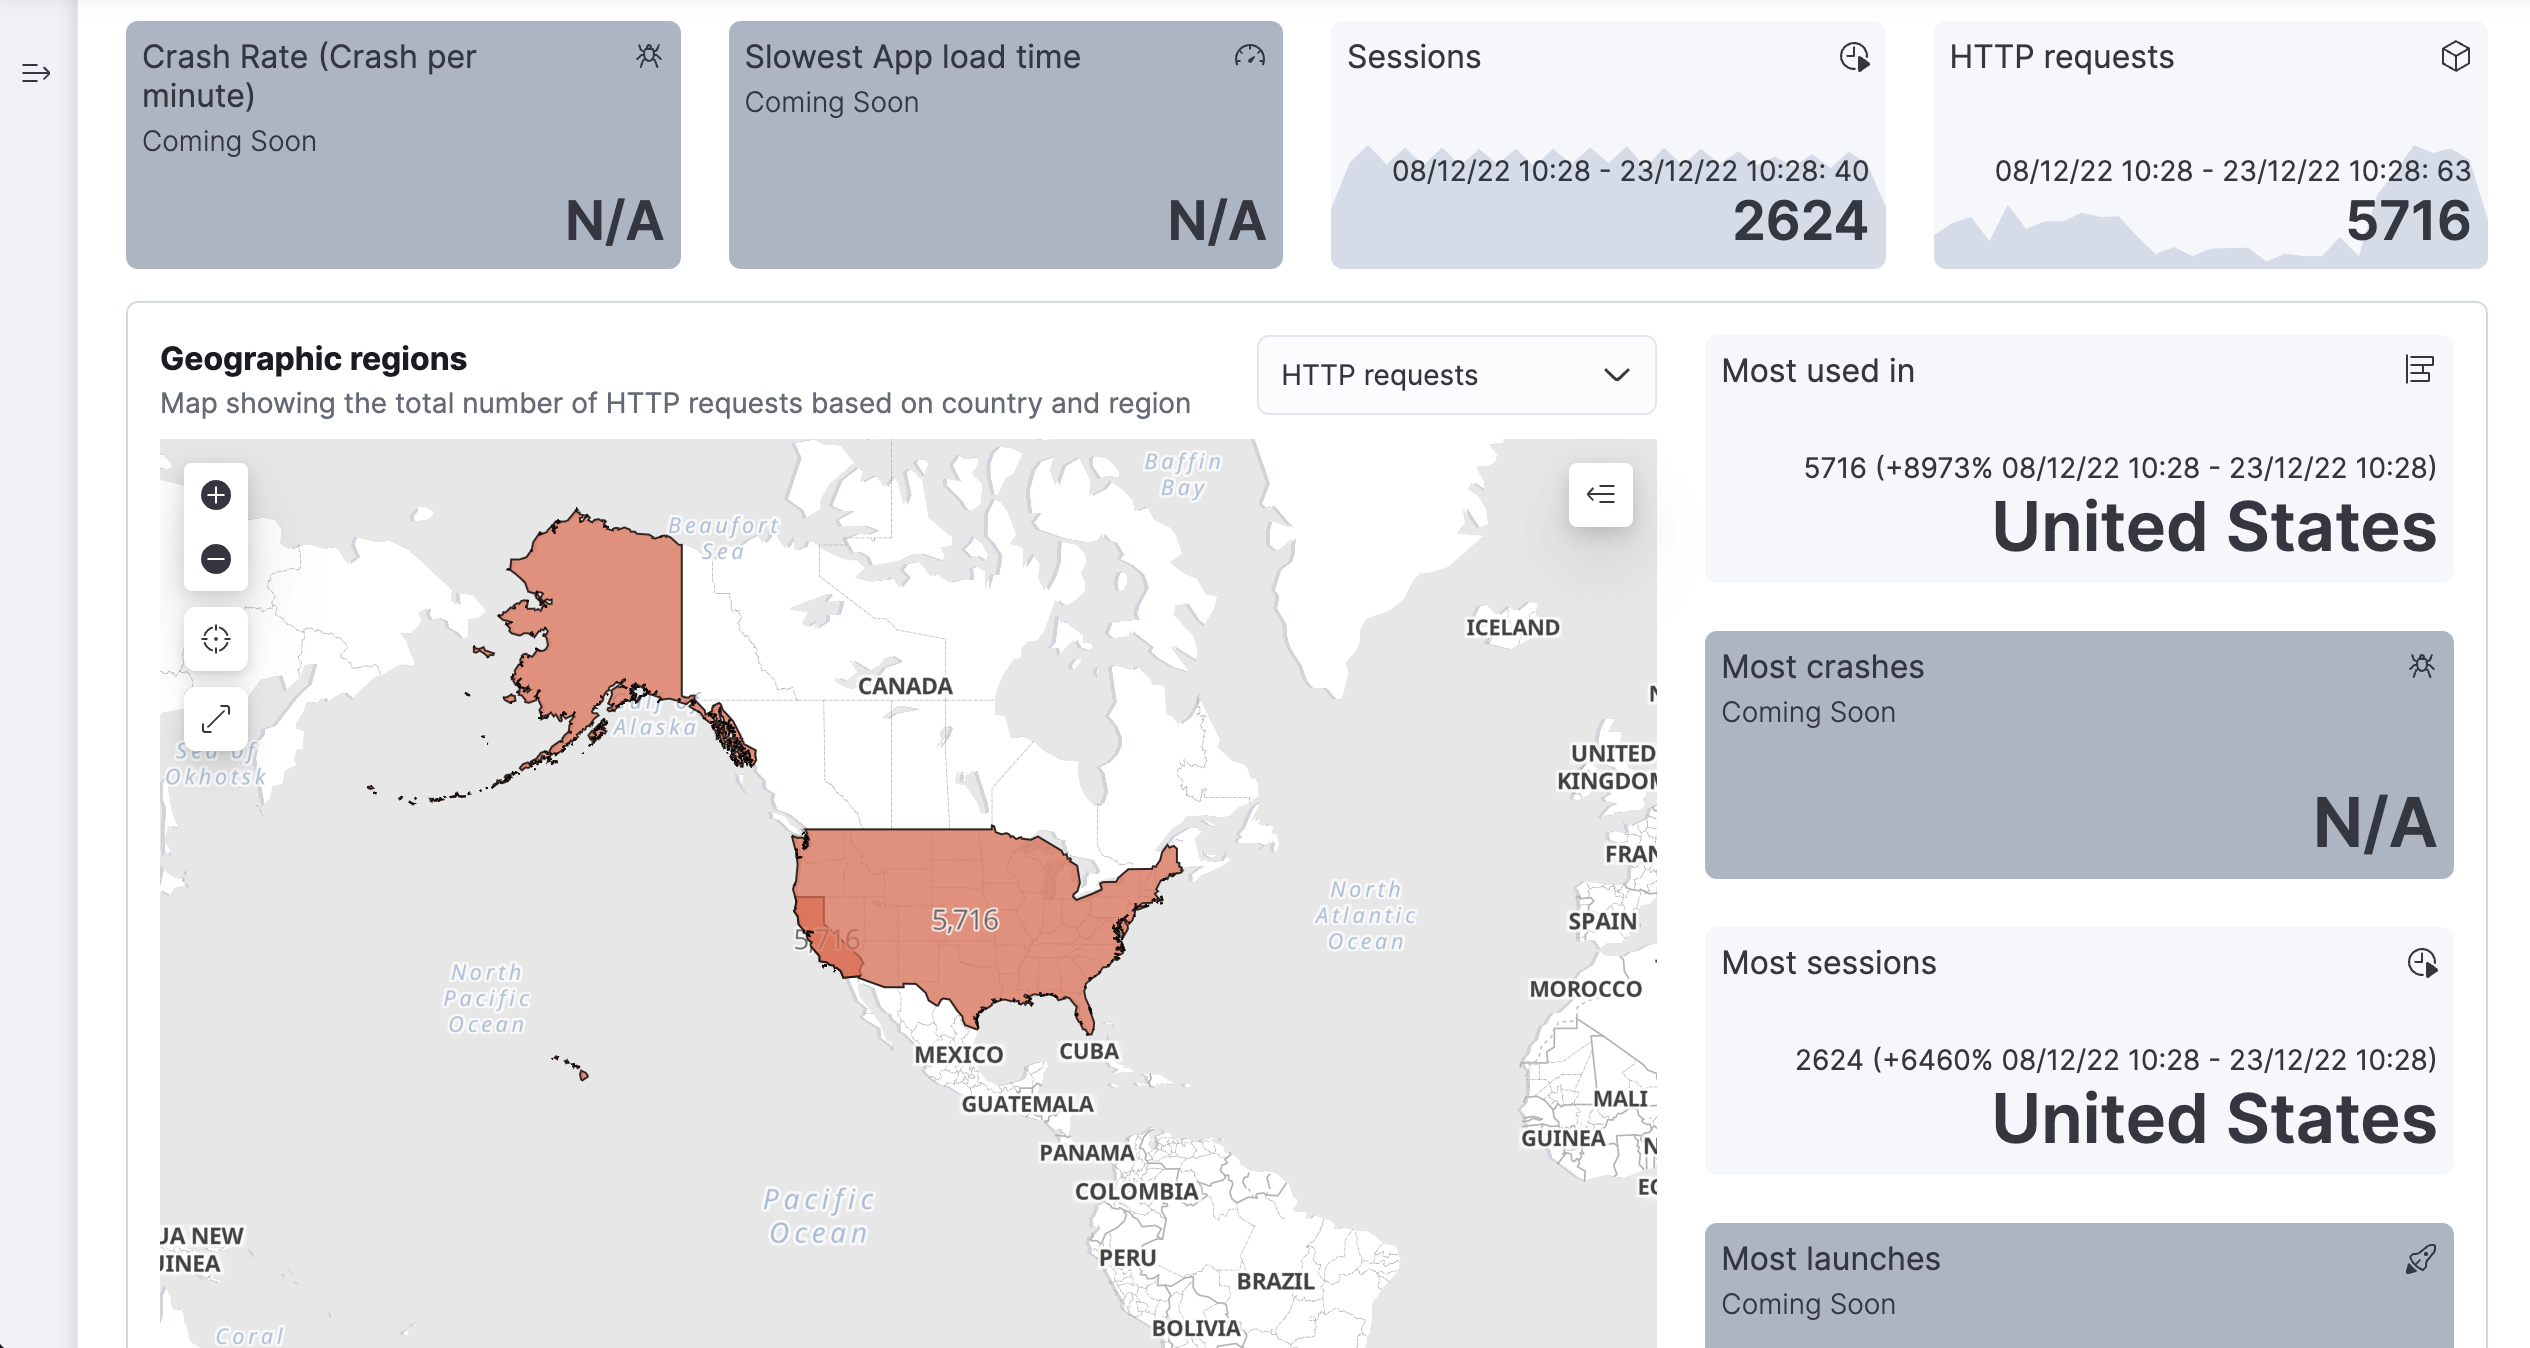
- Crash Rate (Crashes per minute) — coming soon
- Slowest App load time — coming soon
- Number of sessions
- Number of HTTP requests
- Map showing the total number of HTTP requests based on country and region
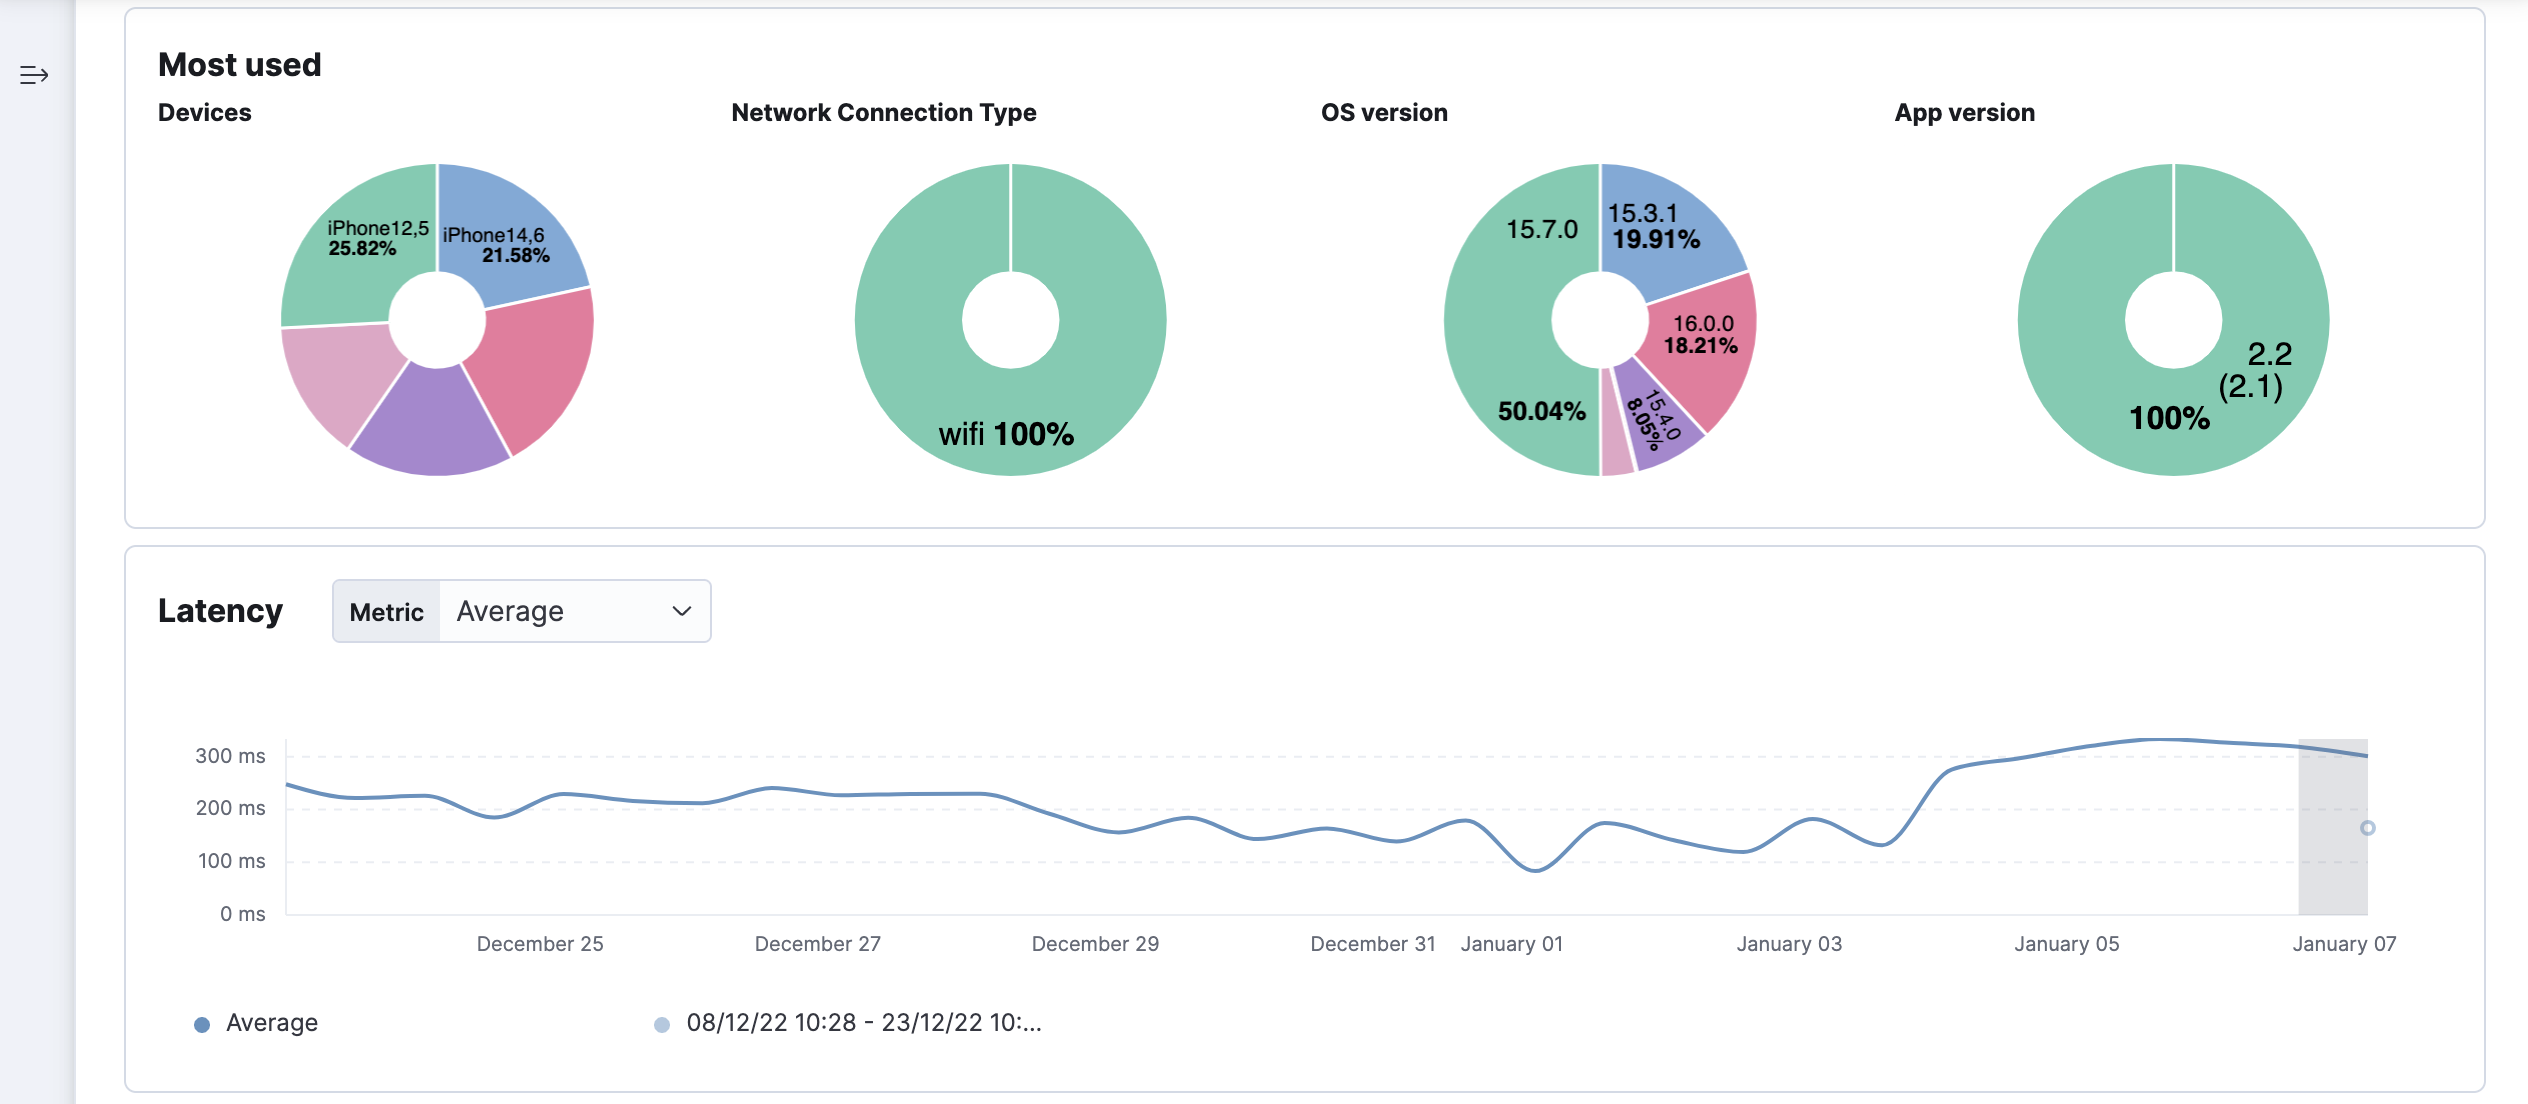
- Most used devices, network connection type, OS version, and app version
- Latency, throughput, and errors over time
- Service dependencies
All of these metrics & insights can help SREs and developers better understand the health of their mobile application environment and the impact of backend errors and bottlenecks on end-user experience.
Quick stats
editUnderstand the impact of slow application load times and variations in application crash rate on user traffic (coming soon). Visualize session and HTTP trends, and see where your users are located—enabling you to optimize your infrastructure deployment and routing topology.
Most used
editOptimize your end-user experience and your application QA strategy based on your most used device models and operating system versions.
Throughput and transactions
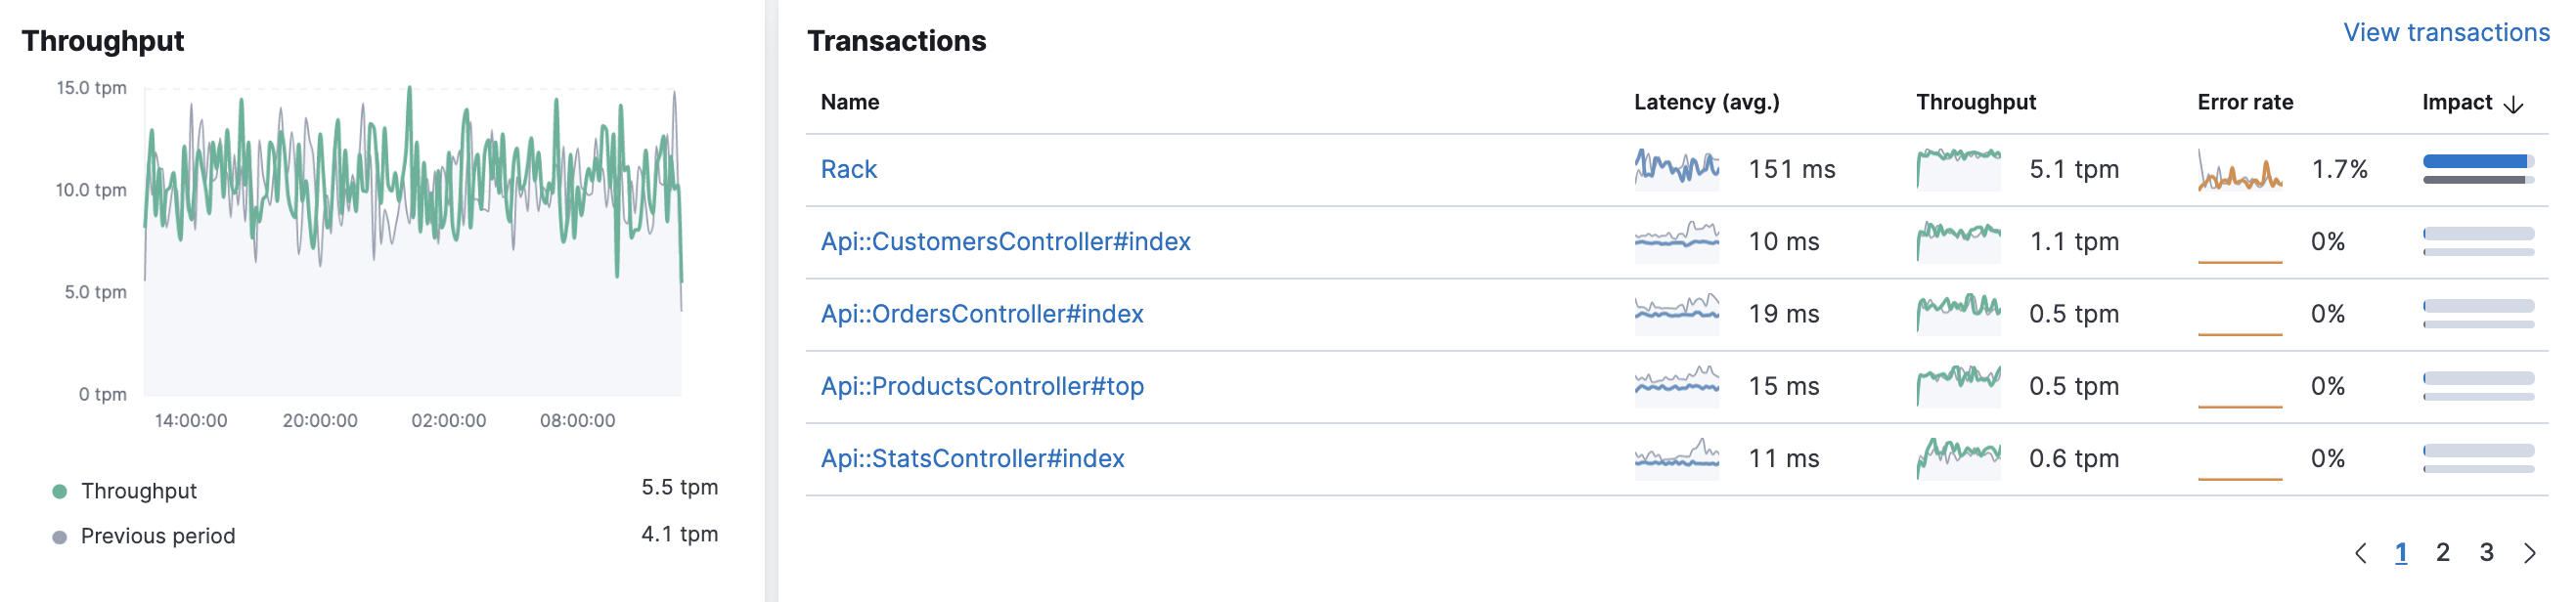
editThe Throughput chart visualizes the average number of transactions per minute for the selected service.
The Transactions table displays a list of transaction groups for the selected service and includes the latency, traffic, error rate, and the impact for each transaction. Transactions that share the same name are grouped, and only one entry is displayed for each group.
By default, transaction groups are sorted by Impact to show the most used and slowest endpoints in your service. If there is a particular endpoint you are interested in, click View transactions to view a list of similar transactions on the transactions overview page.
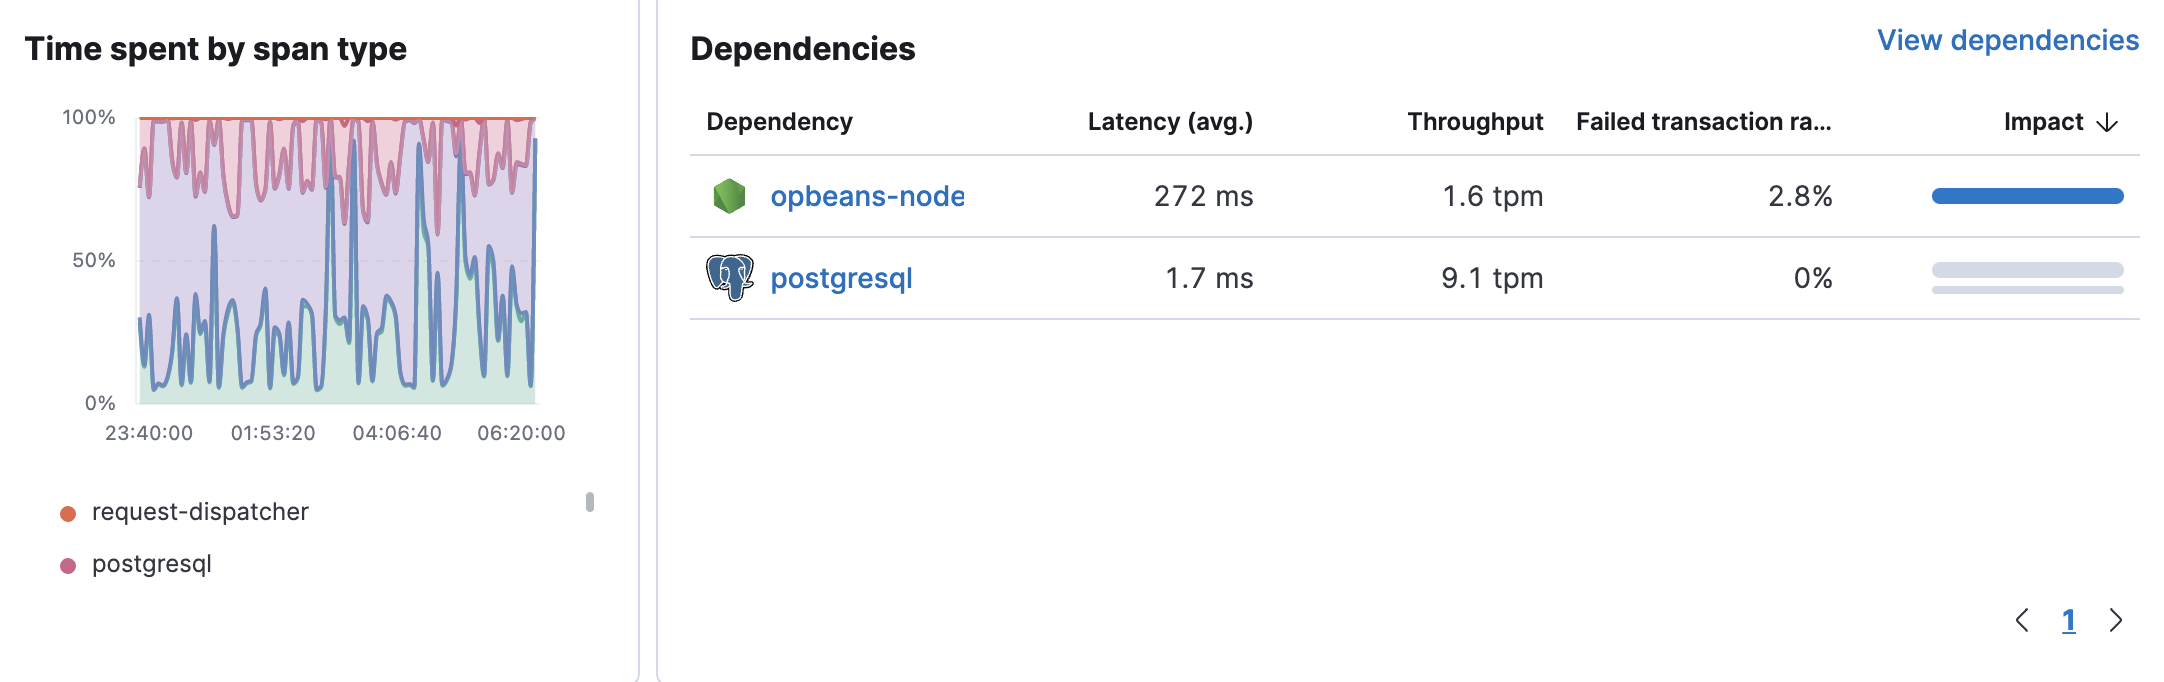
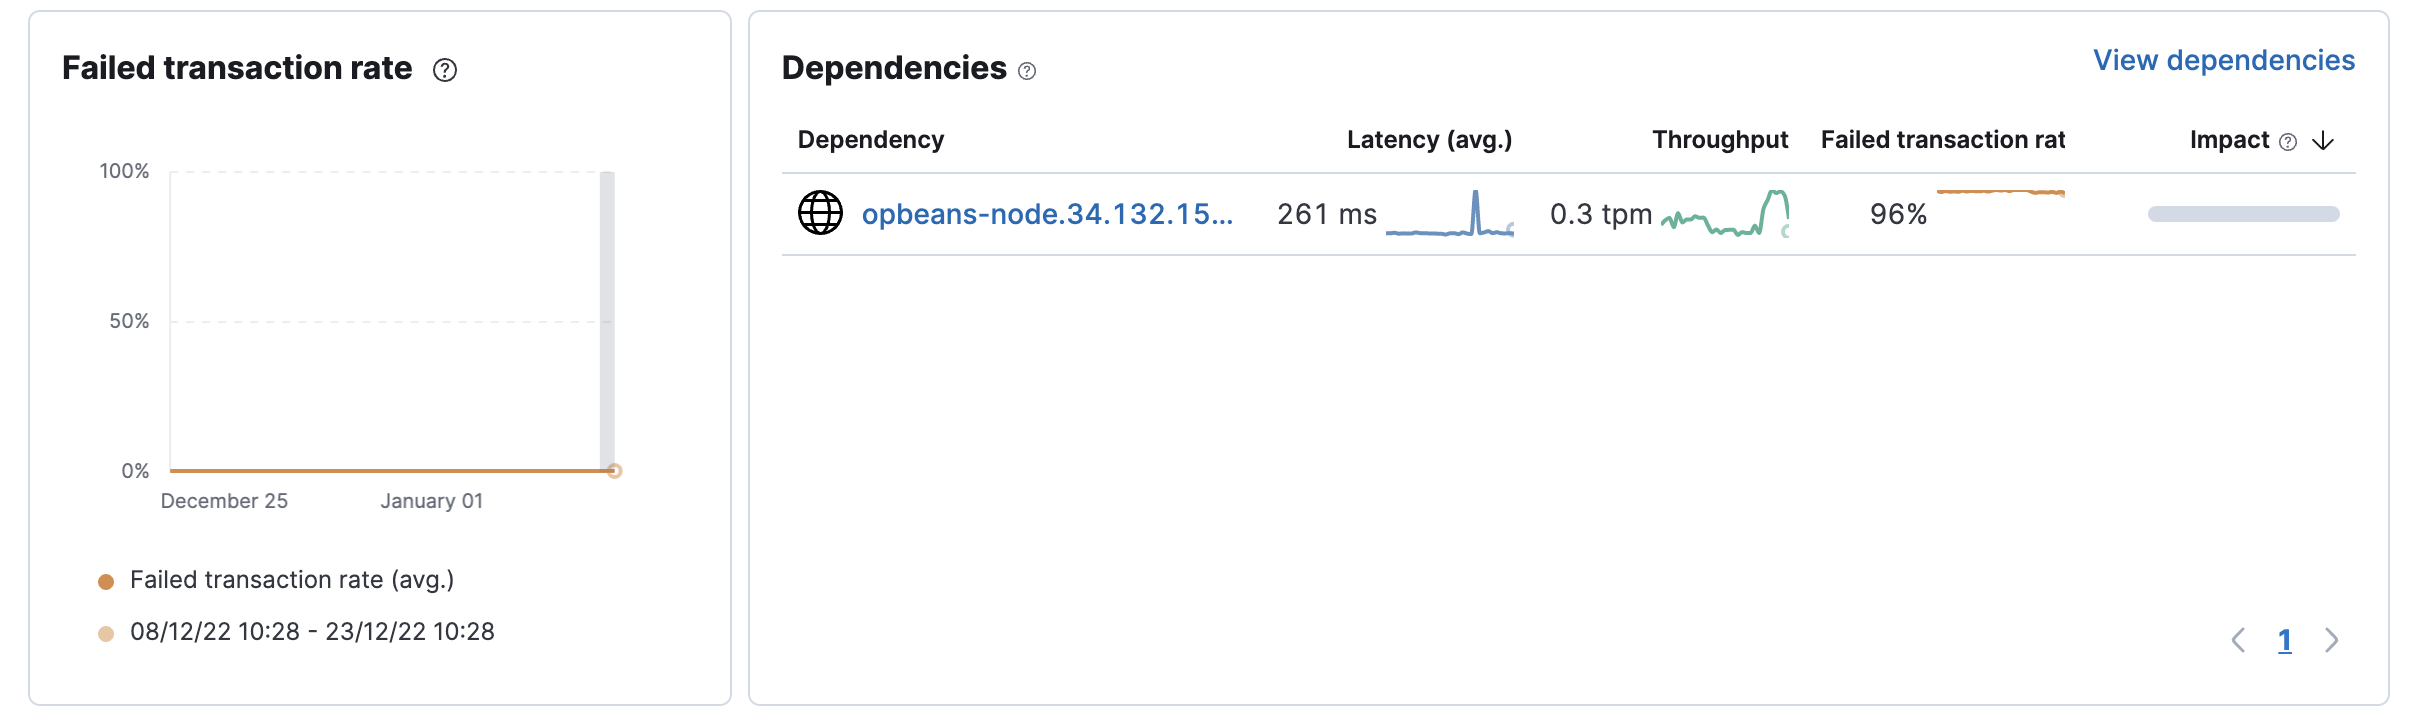
Failed transaction rate and dependencies
editThe failed transaction rate represents the percentage of failed transactions from the perspective of the selected service. It’s useful for visualizing unexpected increases, decreases, or irregular patterns in a service’s transactions.
HTTP transactions from the HTTP server perspective do not consider a 4xx status code (client error) as a failure
because the failure was caused by the caller, not the HTTP server. Thus, event.outcome=success and there will be no increase in failed transaction rate.
HTTP spans from the client perspective however, are considered failures if the HTTP status code is ≥ 400.
These spans will set event.outcome=failure and increase the failed transaction rate.
If there is no HTTP status, both transactions and spans are considered successful unless an error is reported.
The Dependencies table displays a list of downstream services or external connections relevant to the service at the selected time range. The table displays latency, throughput, failed transaction rate, and the impact of each dependency. By default, dependencies are sorted by Impact to show the most used and the slowest dependency. If there is a particular dependency you are interested in, click View dependencies to learn more about it.
Displaying dependencies for services instrumented with the Real User Monitoring (RUM) agent requires an agent version ≥ v5.6.3.