IMPORTANT: No additional bug fixes or documentation updates
will be released for this version. For the latest information, see the
current release documentation.
Displaying your visualizations in a dashboard
edit
IMPORTANT: This documentation is no longer updated. Refer to Elastic's version policy and the latest documentation.
Displaying your visualizations in a dashboard
editA dashboard is a collection of visualizations that you can arrange and share. You’ll build a dashboard that contains the visualizations you saved during this tutorial.
- Open Dashboard.
- Click Create new dashboard.
- Click Add.
- Add Bar Example, Map Example, Markdown Example, and Pie Example.
Your sample dashboard look like this:
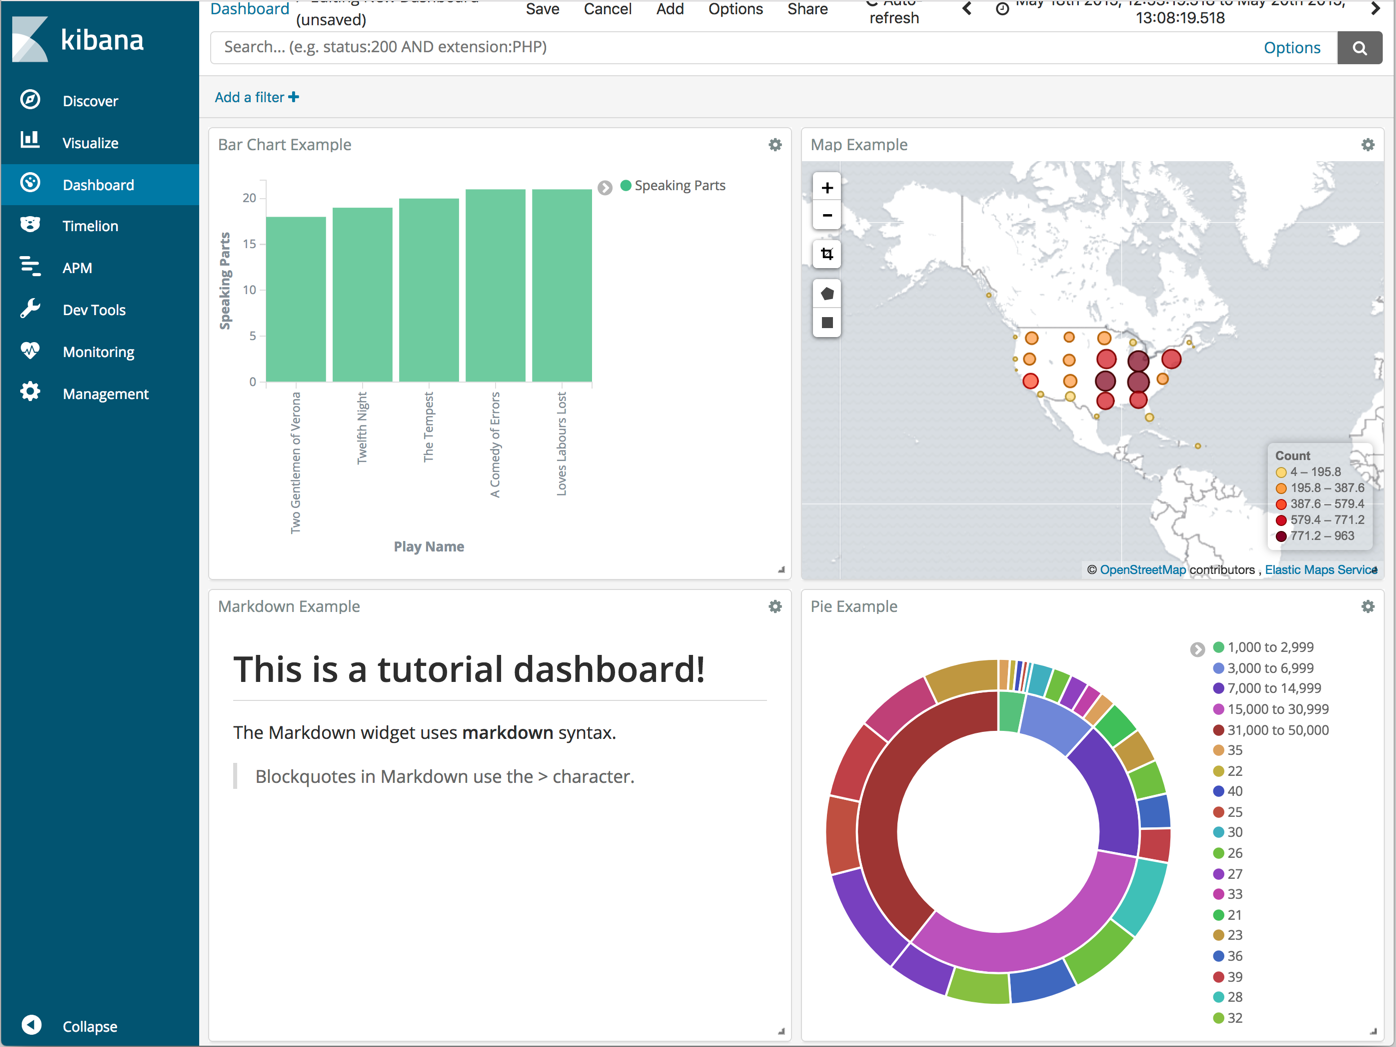
You can rearrange the visualizations by clicking a the header of a visualization and dragging. The gear icon in the top right of a visualization displays controls for editing and deleting the visualization. A resize control is on the lower right.
To get a link to share or HTML code to embed the dashboard in a web page, save the dashboard and click Share.
Save your dashboard.