Get up and running with sample data
editGet up and running with sample data
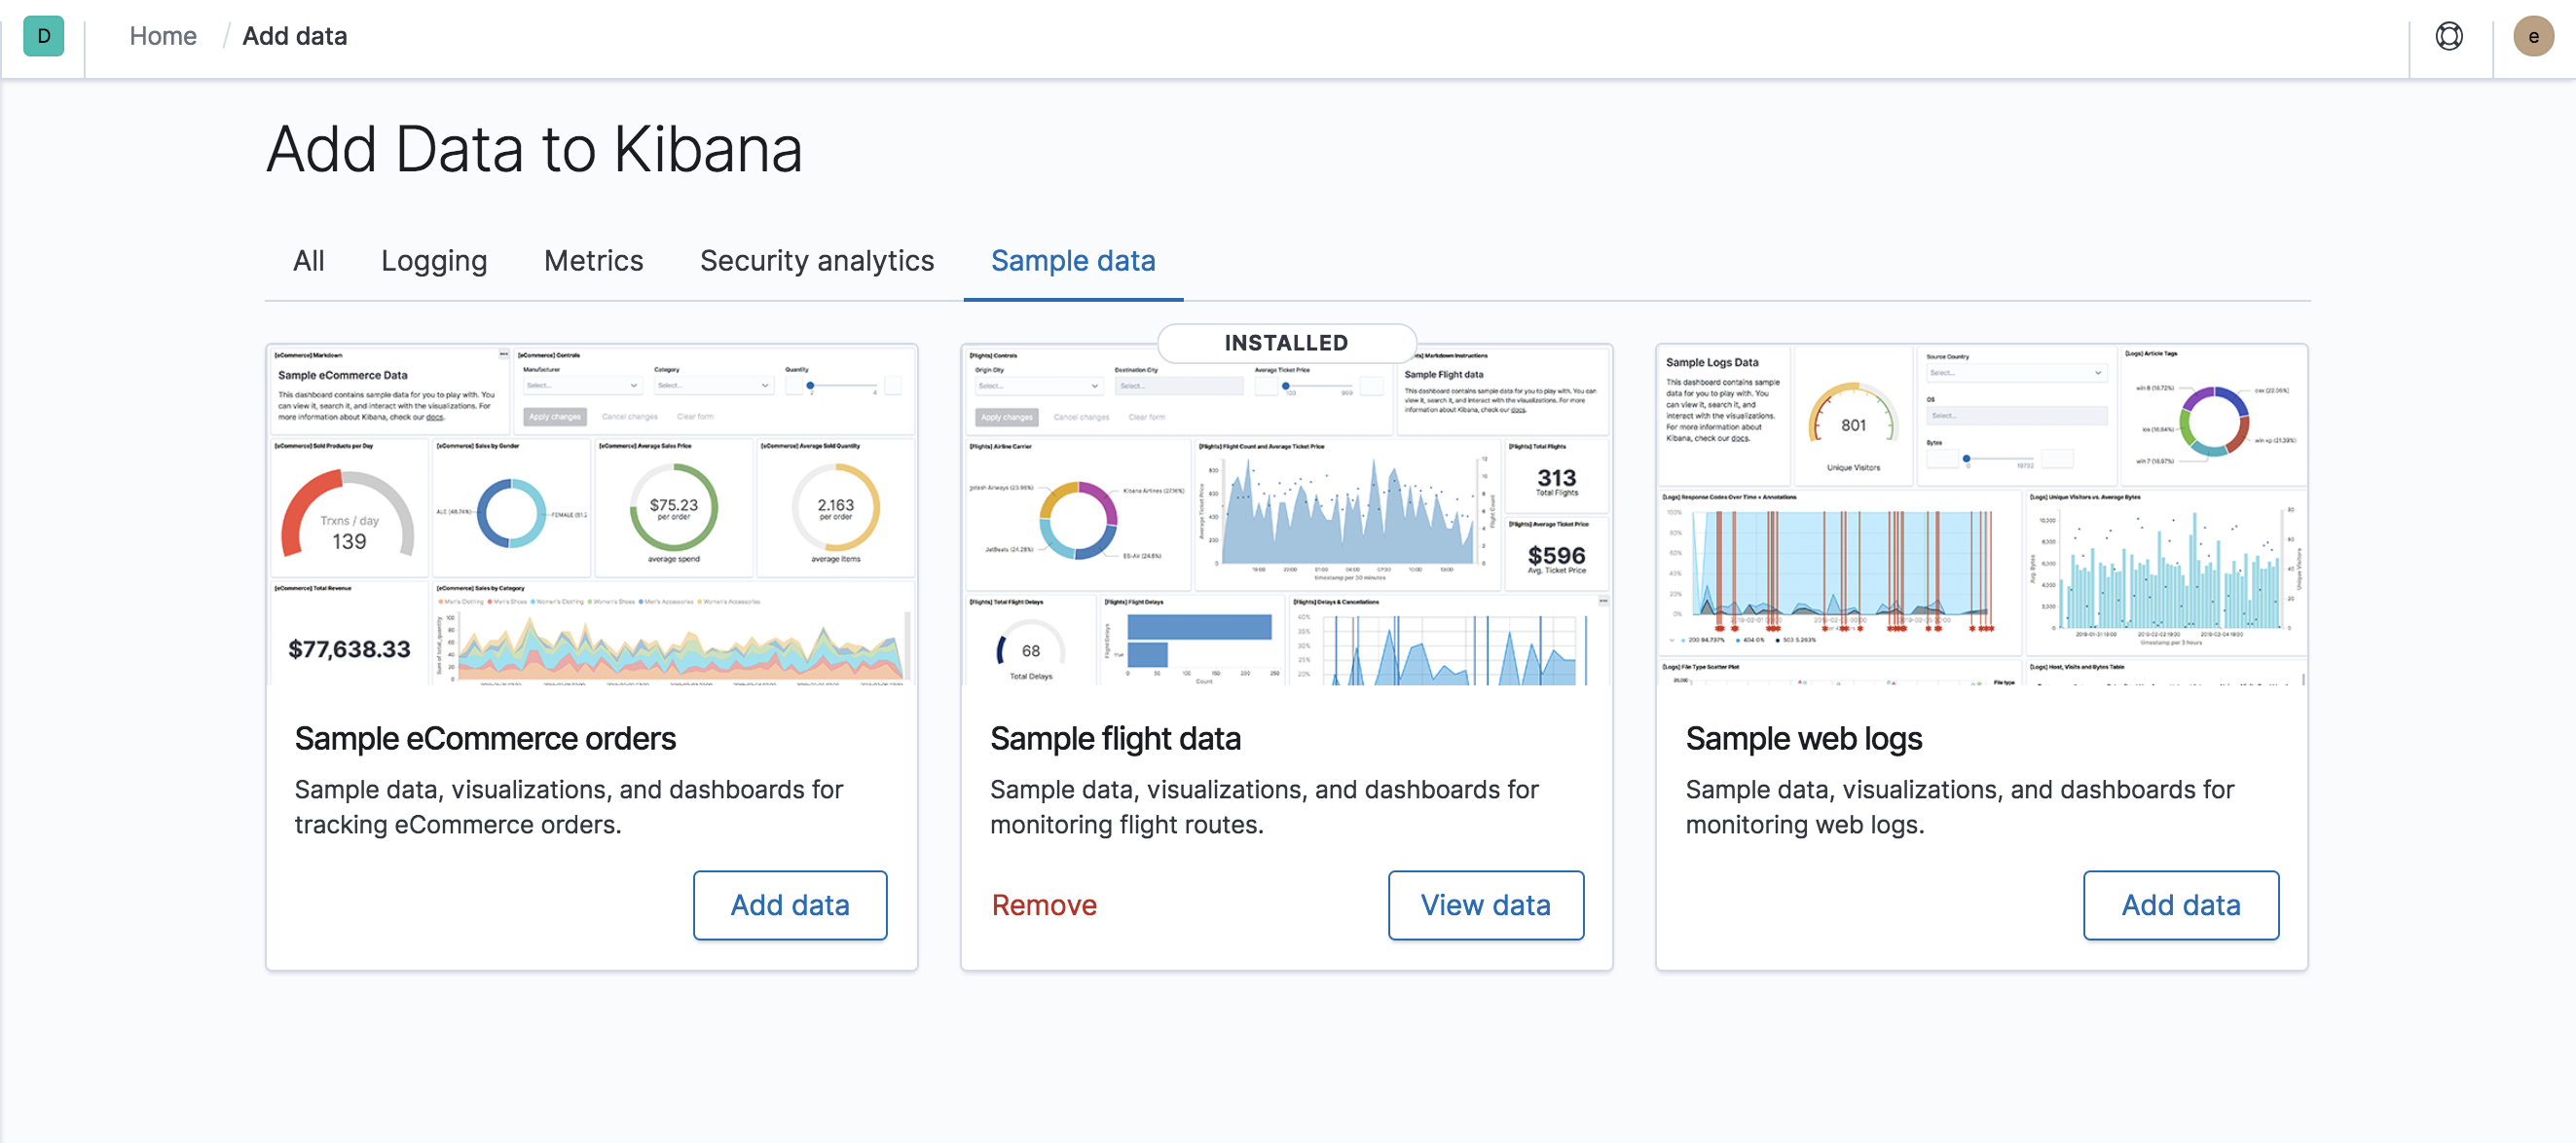
editKibana has three sample data sets that you can use to explore Kibana before loading your own data source. Each set is prepackaged with a dashboard of visualizations and a Canvas workpad.
The sample data sets address common use cases:
- eCommerce orders includes visualizations for product-related information, such as cost, revenue, and price.
- Web logs lets you analyze website traffic.
- Flight data enables you to view and interact with flight routes for four airlines.
To get started, go to the home page and click the link next to Add sample data.
Once you have loaded a data set, click View data to view visualizations in Dashboard.
Note: The timestamps in the sample data sets are relative to when they are installed. If you uninstall and reinstall a data set, the timestamps will change to reflect the most recent installation.
Next steps
editPlay with the sample flight data in the flight dashboard tutorial.
Learn how to load data, define index patterns and build visualizations by building your own dashboard.