Elastic Agent health status
editElastic Agent health status
editThe Elastic Agent monitoring documentation describes the features available through the Fleet UI for you to view Elastic Agent status and activity, access metrics and diagnostics, enable alerts, and more.
For details about how the Elastic Agent status is monitored by Fleet, including connectivity, check-in frequency, and similar, see the following:
- How does Elastic Agent connect to the Fleet to report its availability and health, and receive policy updates?
- We use stack monitoring to monitor the status of our cluster. Is monitoring of Elastic Agent and the status shown in Fleet using stack monitoring as well?
- There are many components that make up Elastic Agent. How does Elastic Agent ensure that these components/processes are up and running, and healthy?
- If Elastic Agent goes down, is an alert generated by Fleet?
- How long does it take for Elastic Agent to report a status change?
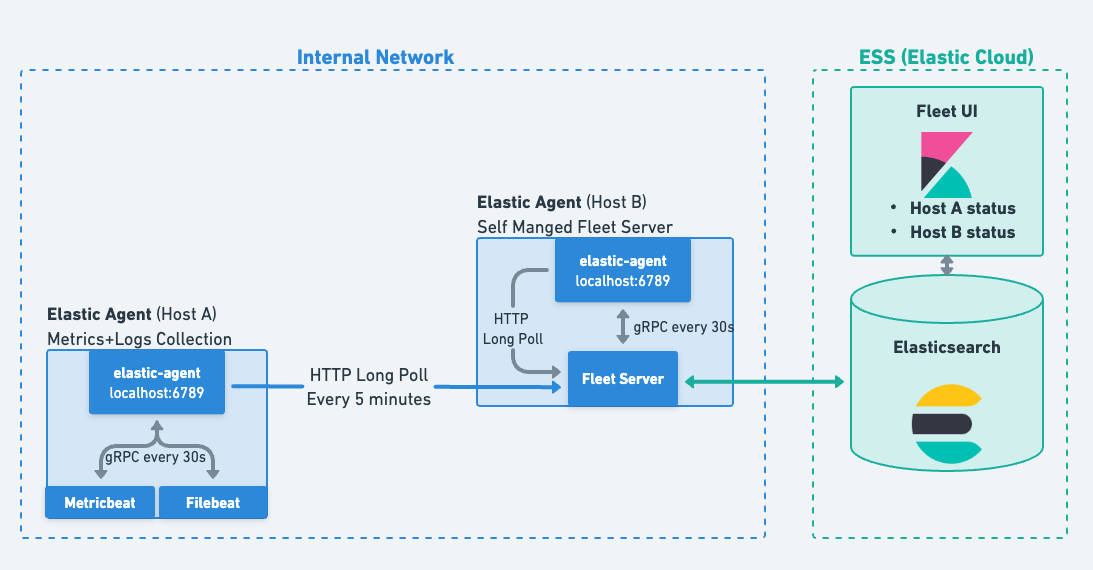
How does Elastic Agent connect to the Fleet to report its availability and health, and receive policy updates?
editAfter enrollment, Elastic Agent regularly initiates a check-in to Fleet Server using HTTP long-polling (Fleet Server is either deployed on-premises or deployed as part of Elasticsearch in Elastic Cloud).
The HTTP long-polling request is kept open until there’s a configuration change that Elastic Agent needs to consume, an action that is sent to the agent, or a 5 minute timeout has elapsed. After 5 minutes, the agent will again send another check-in to start the process over again.
The frequency of check-ins can be configured to a new value with the condition that it may affect the maximum number of agents that can connect to Fleet. Our regular scale testing of the solution doesn’t modify this parameter.
We use stack monitoring to monitor the status of our cluster. Is monitoring of Elastic Agent and the status shown in Fleet using stack monitoring as well?
editNo. The health monitoring of Elastic Agent and its inputs, as reported in Fleet, is done completely outside of what stack monitoring provides.
There are many components that make up Elastic Agent. How does Elastic Agent ensure that these components/processes are up and running, and healthy?
editElastic Agent is essentially a supervisor that (at a minimum) will deploy a Filebeat instance for log collection and a Metricbeat instance for metrics collection from the system and applications running on that system. As a supervisor, it also ensures that these spawned processes are running and healthy. Using gRPC, Elastic Agent communicates with the underlying processes once every 30 seconds, ensuring their health. If there’s no response, the agent will transfer to being Unhealthy with the result and details reported to Fleet.
If Elastic Agent goes down, is an alert generated by Fleet?
editNo. Alerts would have to be created in Kibana on the indices that show the total count of agents at each specific state. Refer to Enable alerts and ML jobs based on Fleet and Elastic Agent status in the Elastic Agent monitoring documentation for the steps to configure alerting. Generating alerts on status change on individual agents is currently planned for a future release.
How long does it take for Elastic Agent to report a status change?
editSome Elastic Agent states are reported immediately, such as when the agent has become Unhealthy. Some other states are derived after a certain criteria is met. Refer to View agent status overview in the Elastic Agent monitoring documentation for details about monitoring agent status.
Transition from an Offline state to an Inactive state is configurable by the user and that transition can be fine tuned by Setting the inactivity timeout parameter.