Elasticsearch has native integrations with the industry-leading Gen AI tools and providers. Check out our webinars on going Beyond RAG Basics, or building prod-ready apps with the Elastic vector database.
To build the best search solutions for your use case, start a free cloud trial or try Elastic on your local machine now.
In a previous blog post, we built a small Python application that queries Elasticsearch using a mix of vector search and BM25 to help find the most relevant results in a proprietary data set. The top hit is then passed to OpenAI, which answers the question for us.
In this blog, we will instrument a Python application that uses OpenAI and analyze its performance, as well as the cost to run the application. Using the data gathered from the application, we will also show how to integrate large language models (LLMs) into your application. As a bonus, we will try to answer the question: why does ChatGPT print its output word by word?
Instrumenting the application with Elastic APM
If you’ve had a chance to give our sample application a try, you might have noticed that the result does not load as quickly as you’d expect it to, from a search interface.
The now is if this is from our two-phased approach of running a query in Elasticsearch first or if the slow behavior is emerging from OpenAI, or if it’s a combination of the two.
Using Elastic APM, we can easily instrument this application to get a better look. All we need to do for the instrumentation is the following (we will show the full example at the end of the blog post and also in a GitHub repository):
Since our sample application is using Streamlit, we will also need to start at least one transaction and eventually end it again. In addition, we can also provide information about the outcome of the transaction to APM, so we can track failures properly.
And that’s it — this would be enough to have full APM instrumentation for our application. That being said, we will be doing a little extra work here in order to get some more interesting data.
As a first step, we will add the user’s query to the APM metadata. This way we can inspect what the user was trying to search and can analyze some popular queries or reproduce errors.
In our async method, which talks to OpenAI, we will also add some more instrumentation so we can better visualize the tokens we receive, as well as to collect additional statistics.
And finally, toward the very end of our application, we will also add the number of tokens and approximate cost to our APM transaction. This will enable us to visualize these metrics later and correlate them to the application performance.
If you do not use streaming, then the OpenAI response will contain a “total_tokens” field, which is the sum of the context you sent and the response returned. If you are using the “stream=True” option, then it’s your responsibility to calculate the number of tokens or approximate them. A common recommendation is to use “(len(prompt) + len(response)) / 4” for english text, but especially code snippets can throw off this approximation. If you need more exact numbers, you can use libraries like tiktoken to calculate the number of tokens.
Analyzing the APM data — Elasticsearch vs. OpenAI performance
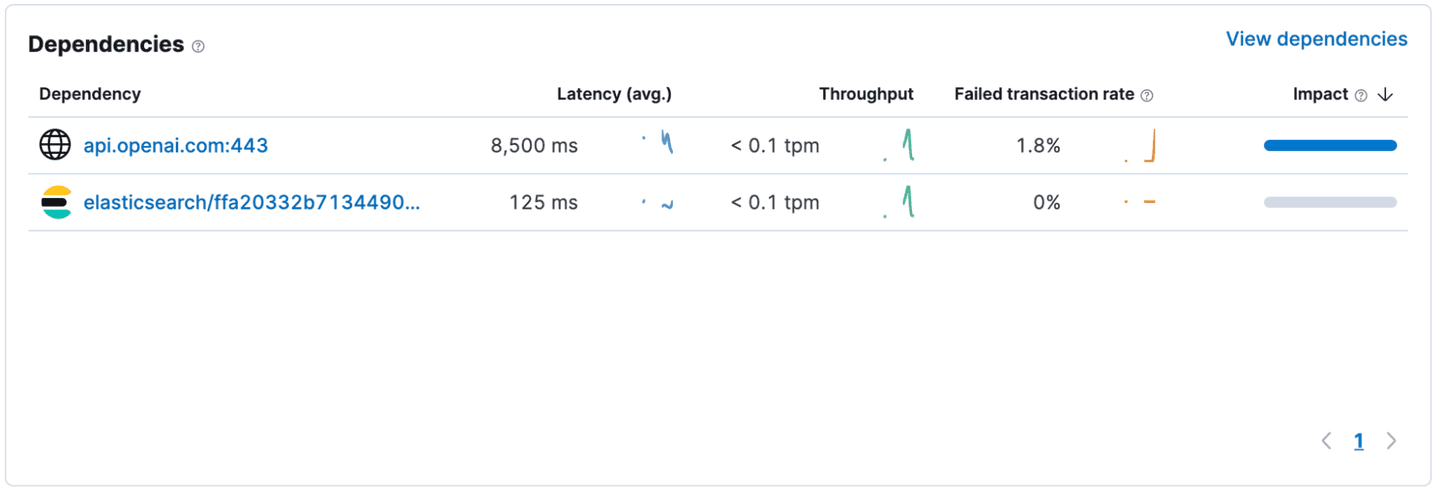
After instrumenting the application, a quick look at the “Dependencies” gives us a better understanding of what’s going on. It looks like our requests to Elasticsearch return within 125ms on average, while OpenAI takes 8,500ms to complete a request. (This screenshot was taken on a version of the application that does not use streaming. If you use streaming, the default instrumentation only considers the initial POST request in the dependency response time and not the time it takes to stream the full response.)
If you’ve used ChatGPT yourself already, you might have been wondering why the UI is printing every word individually, instead of just returning the full response immediately.
As it turns out, this is not actually to entice you to pay money if you’re using the free version! It’s more of a limitation of the inference model. In simple terms, in order to compute the next token, the model will need to take into consideration the last token as well. So there’s not much room for parallelization. And since every token is processed individually, this token can also be sent to the client, while the computation for the next token is running.
In order to improve the UX, it can be helpful to therefore use a streaming approach when using the ChatCompletion functionality. This way a user can start to consume the first results while the full response is being generated. You can see this behavior in the GIF below. Even though all three responses are still loading, the user can scroll down and inspect what’s there already.
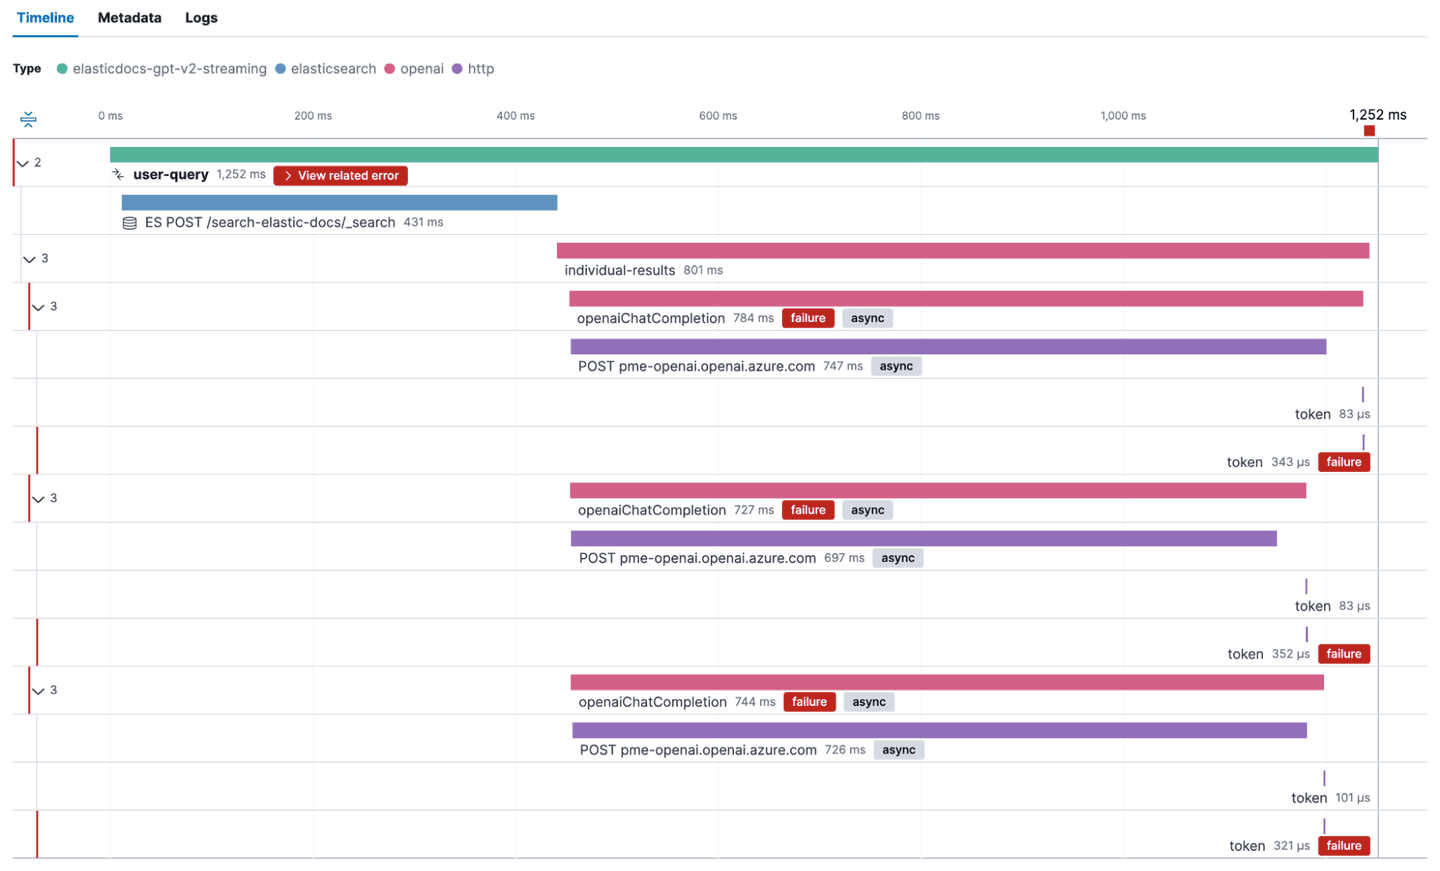
As mentioned previously, we added a bit more custom instrumentation than just the bare minimum. This allows us to get detailed information on where our time is spent. Let’s take a look at a full trace and see this streaming in action.
Our application is configured to fetch the top three hits from Elasticsearch, and then run one ChatCompletion request against OpenAI in parallel.
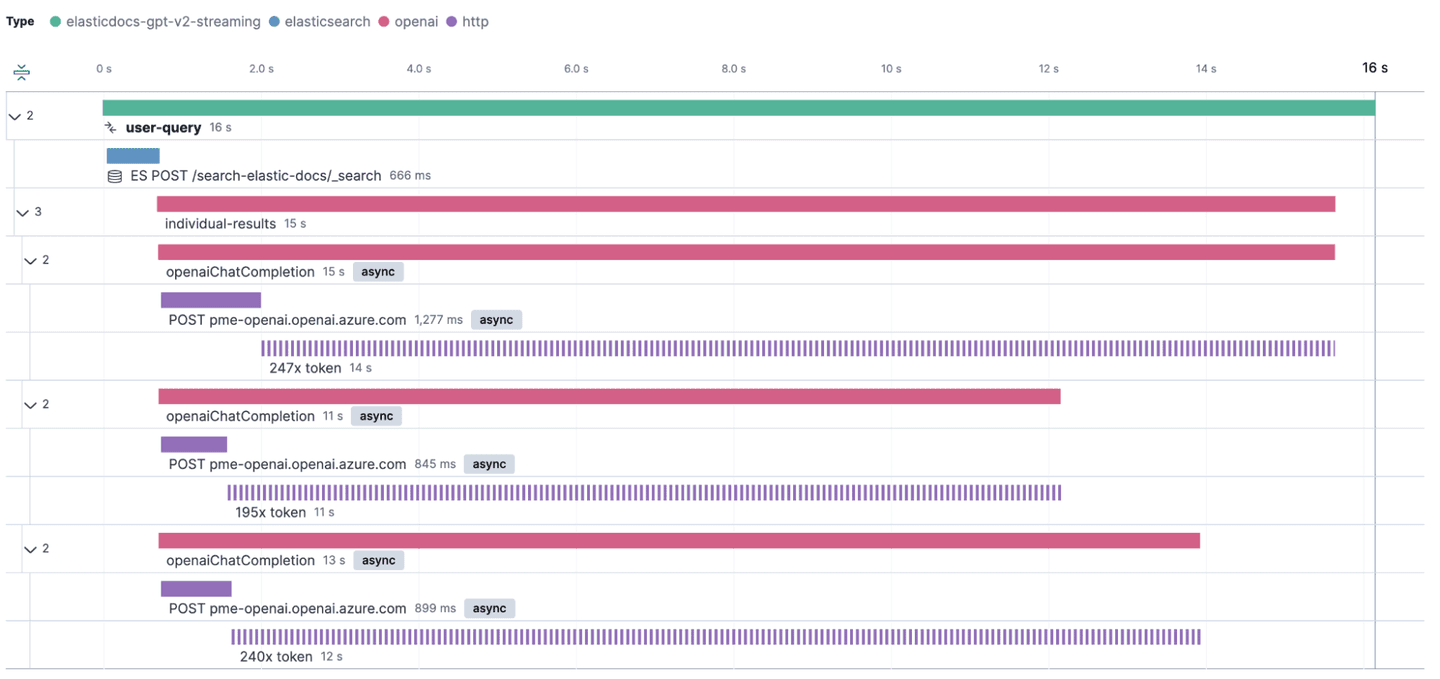
As we can see in the screenshot, loading the individual results takes about 15s. We can also see that requests to OpenAI that return a larger response take longer to return. But this is only a single request. Does this behavior happen for all requests? Is there a clear correlation between response time and number of tokens to back up our claims from earlier?
Analyzing cost and response time
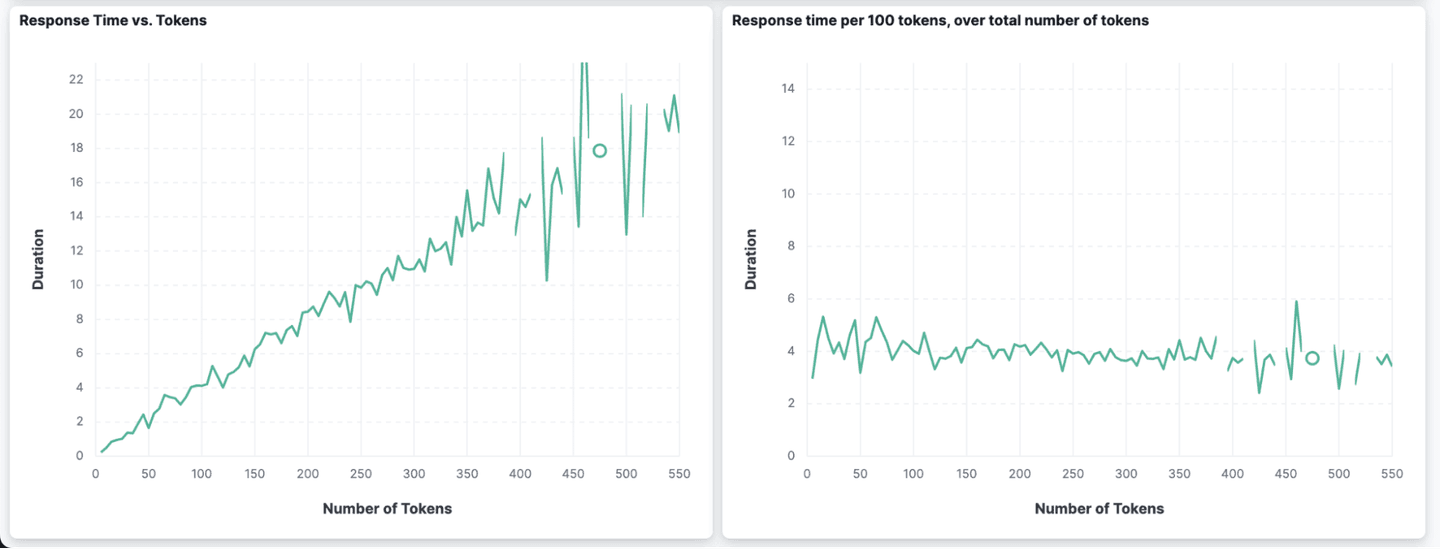
Instead of visualizing the data using Elastic APM, we can also use custom dashboards and create visualizations from our APM data. Two interesting charts that we can build show the relationship between the number of tokens in a response and the duration of the request.
We can see that the more tokens get returned (x-axis in the first chart), the higher the duration (y-axis in the first chart). In the chart to the right, we can also see that the duration per 100 tokens returned stays almost flat at around 4s, no matter the number of tokens returned in total (x-axis).
If you want to improve the responsiveness of your application that uses OpenAI models, it might be a good idea to tell the model to keep the response short.
In addition to this, we can also track our total spend and the average cost per page load, as well as other statistics.
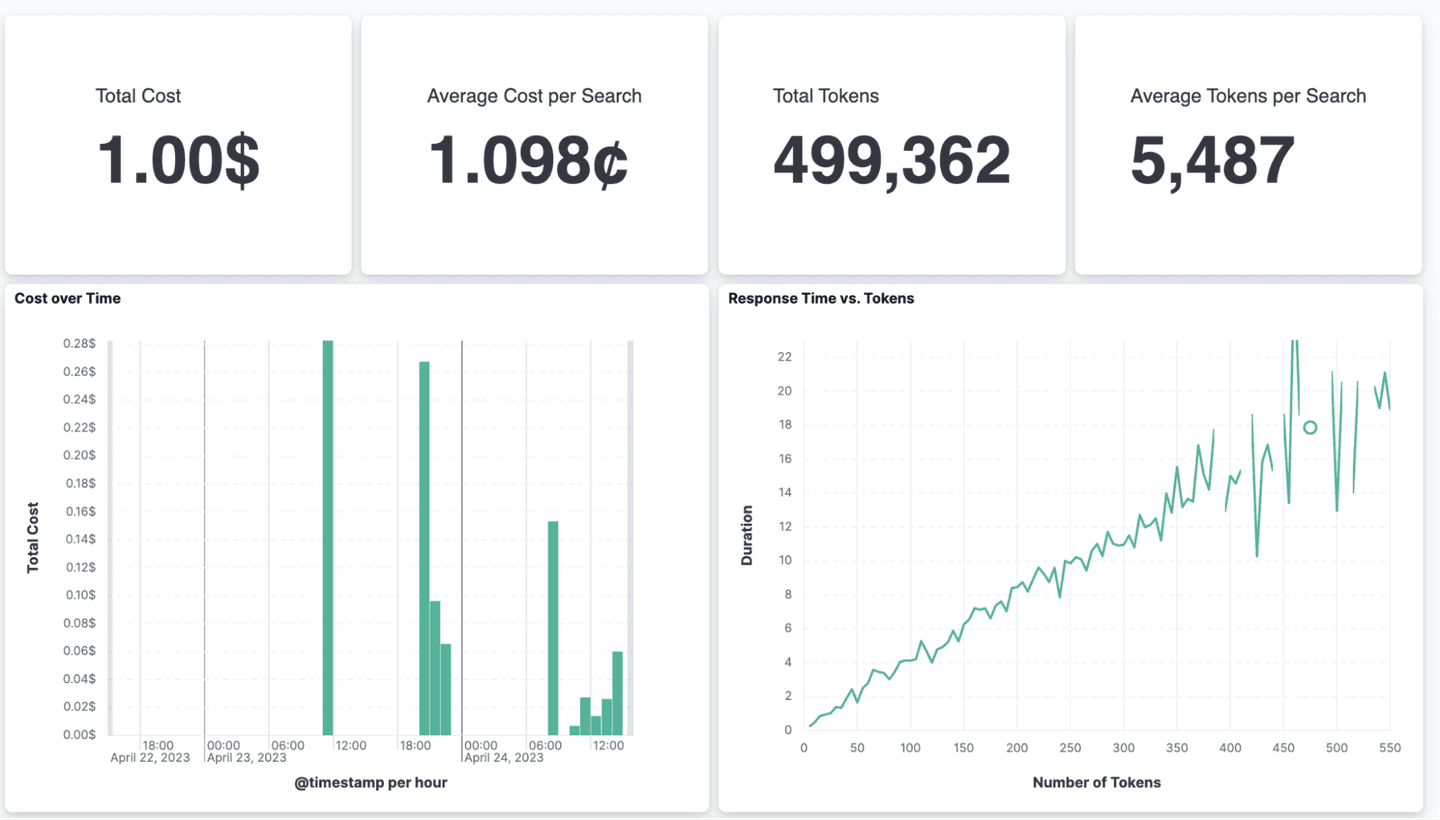
With our sample application, the cost for a single search is around 1.1¢. This number does not sound high, but it’s likely not something that you will have on your public website as a search alternative anytime soon. For company internal data and a search interface that’s only used occasionally, this cost is negligible.
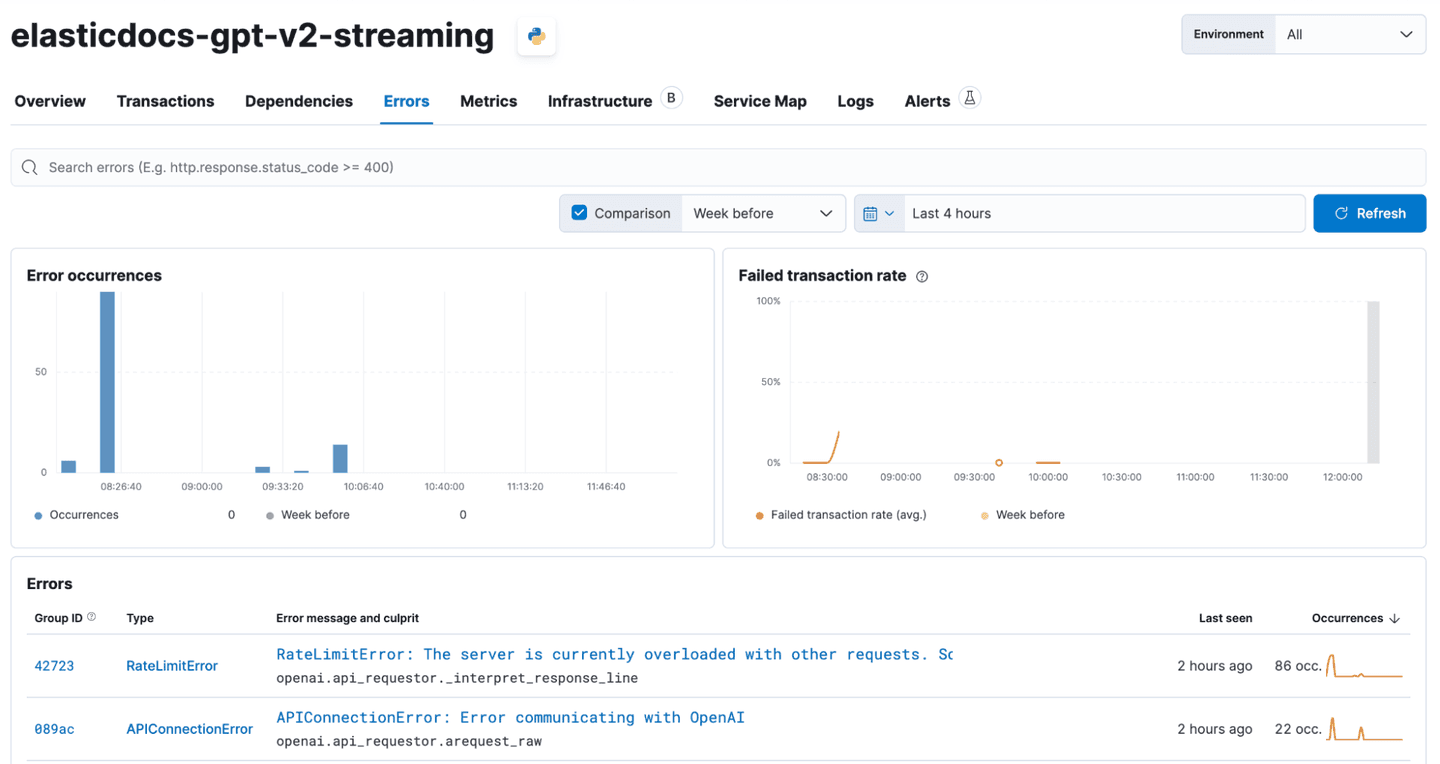
In our testing, we’ve also hit frequent errors when using the OpenAI API in Azure, which eventually made us add a retry loop to the sample app with an exponential backoff. We can also capture these errors using Elastic APM.
Any captured errors are then visible in the waterfall charts as part of the span where the failure happened.
In addition, Elastic APM also provides an overview of all the errors. In the screenshot below, you can see the occasional RateLimitError and APIConnectionError that we’ve encountered. Using our crude exponential retry mechanism, we can mitigate most of these problems.
Latency and failed transaction correlation
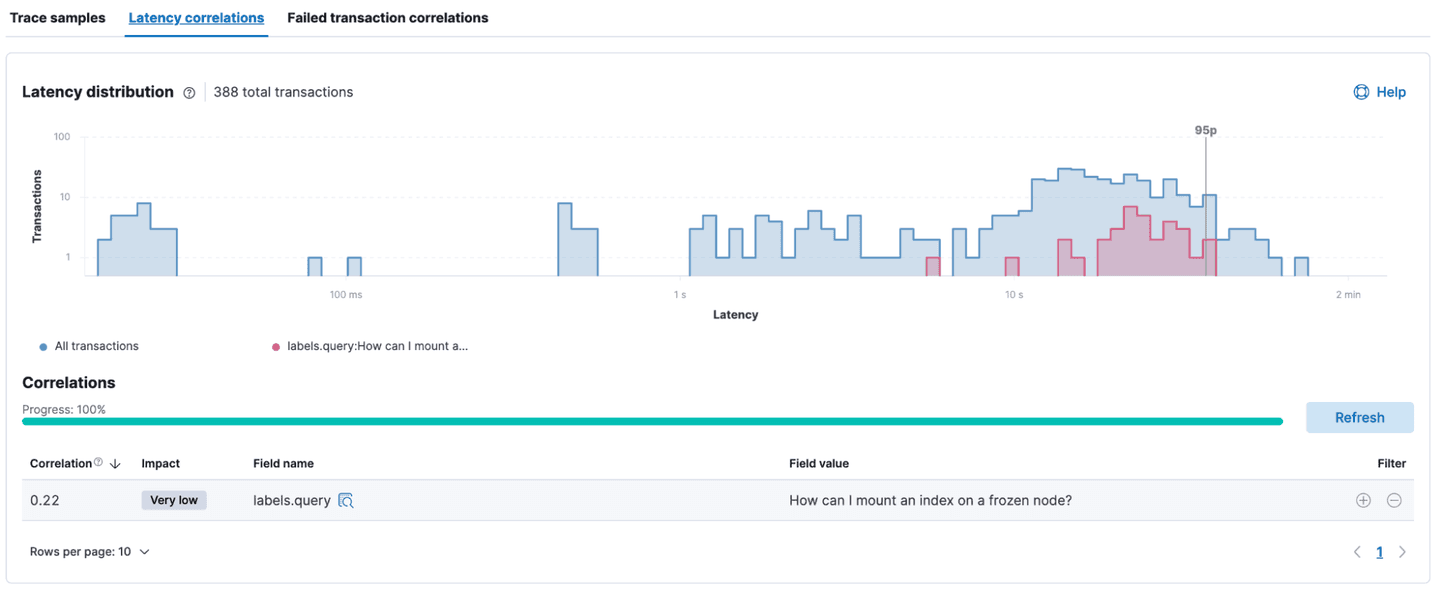
With all the built-in metadata that the Elastic APM agent capture, as well as the custom labels we added, we can easily analyze if there’s any correlation between the performance and any of the metadata (like services version, user query, etc.)
As we can see below, there’s a small correlation between the query “How can I mount and index on a frozen node?” and a slower response time.
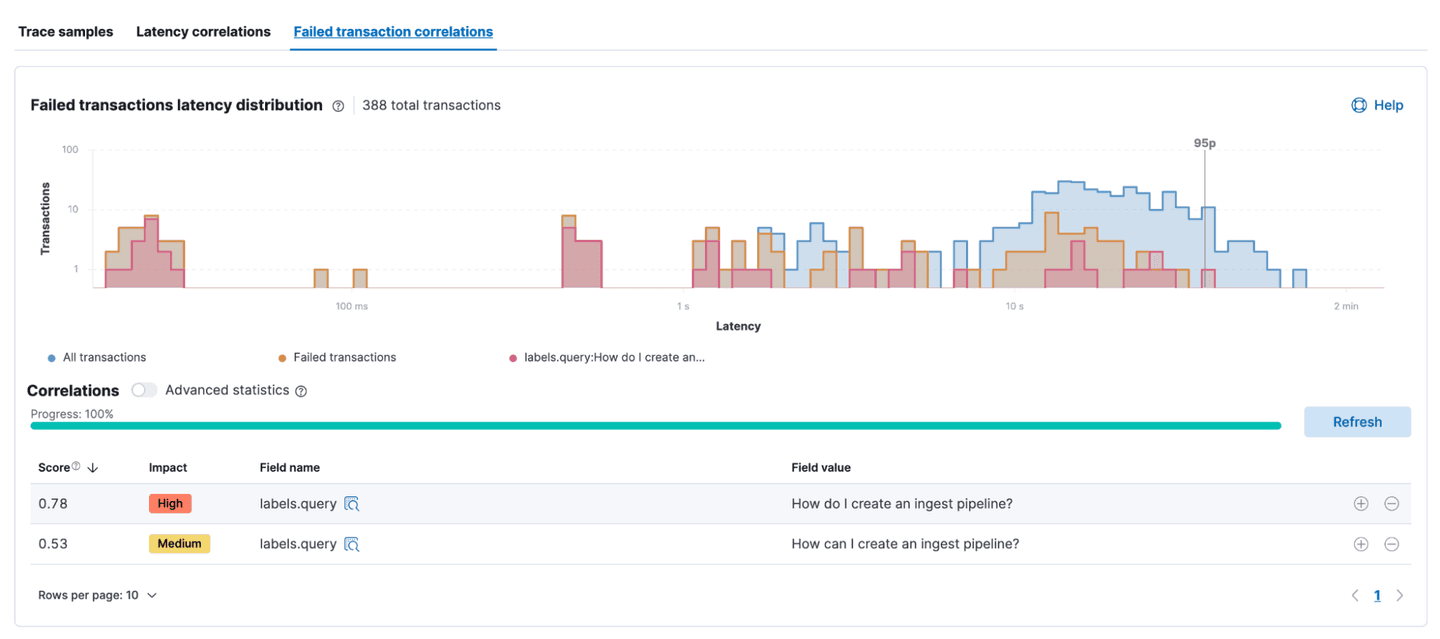
Similar analysis can be done on any transaction that resulted in an error. In this example, the two queries “How do I create an ingest pipeline” and “How can I create an ingest pipeline” fail more often than other queries, causing them to bubble up in this correlation analysis.
In this blog, we instrumented an app written in Python to use OpenAI and analyze its performance. We looked at response latency and failed transactions, and we assessed the costs of running the application. We hope this how-to was useful for you!
Learn more about the possibilities with Elasticsearch and AI .
In this blog post, we may have used third party generative AI tools, which are owned and operated by their respective owners. Elastic does not have any control over the third party tools and we have no responsibility or liability for their content, operation or use, nor for any loss or damage that may arise from your use of such tools. Please exercise caution when using AI tools with personal, sensitive or confidential information. Any data you submit may be used for AI training or other purposes. There is no guarantee that information you provide will be kept secure or confidential. You should familiarize yourself with the privacy practices and terms of use of any generative AI tools prior to use.
Costs referred to herein are based on the current OpenAI API pricing and how often we call it when loading our sample app.
Elastic, Elasticsearch and associated marks are trademarks, logos or registered trademarks of Elasticsearch N.V. in the United States and other countries. All other company and product names are trademarks, logos or registered trademarks of their respective owners.
Frequently Asked Questions
Why does ChatGPT show the answer one word at a time?
ChatGPT prints its output word by word due to limitations in the inference model, which requires considering the last token for computing the next token and limits parallelization. Since every token is processed individually, a token can be sent to the client while the computation for the next token is running.
How to improve the responsiveness of an application that uses OpenAI models?
There is a correlation between the number of tokens in a response and the duration of the request: the more tokens returned, the longer the duration. To improve the responsiveness of your application using OpenAI models, consider telling the model to keep the response short.
Related Content
January 2, 2026
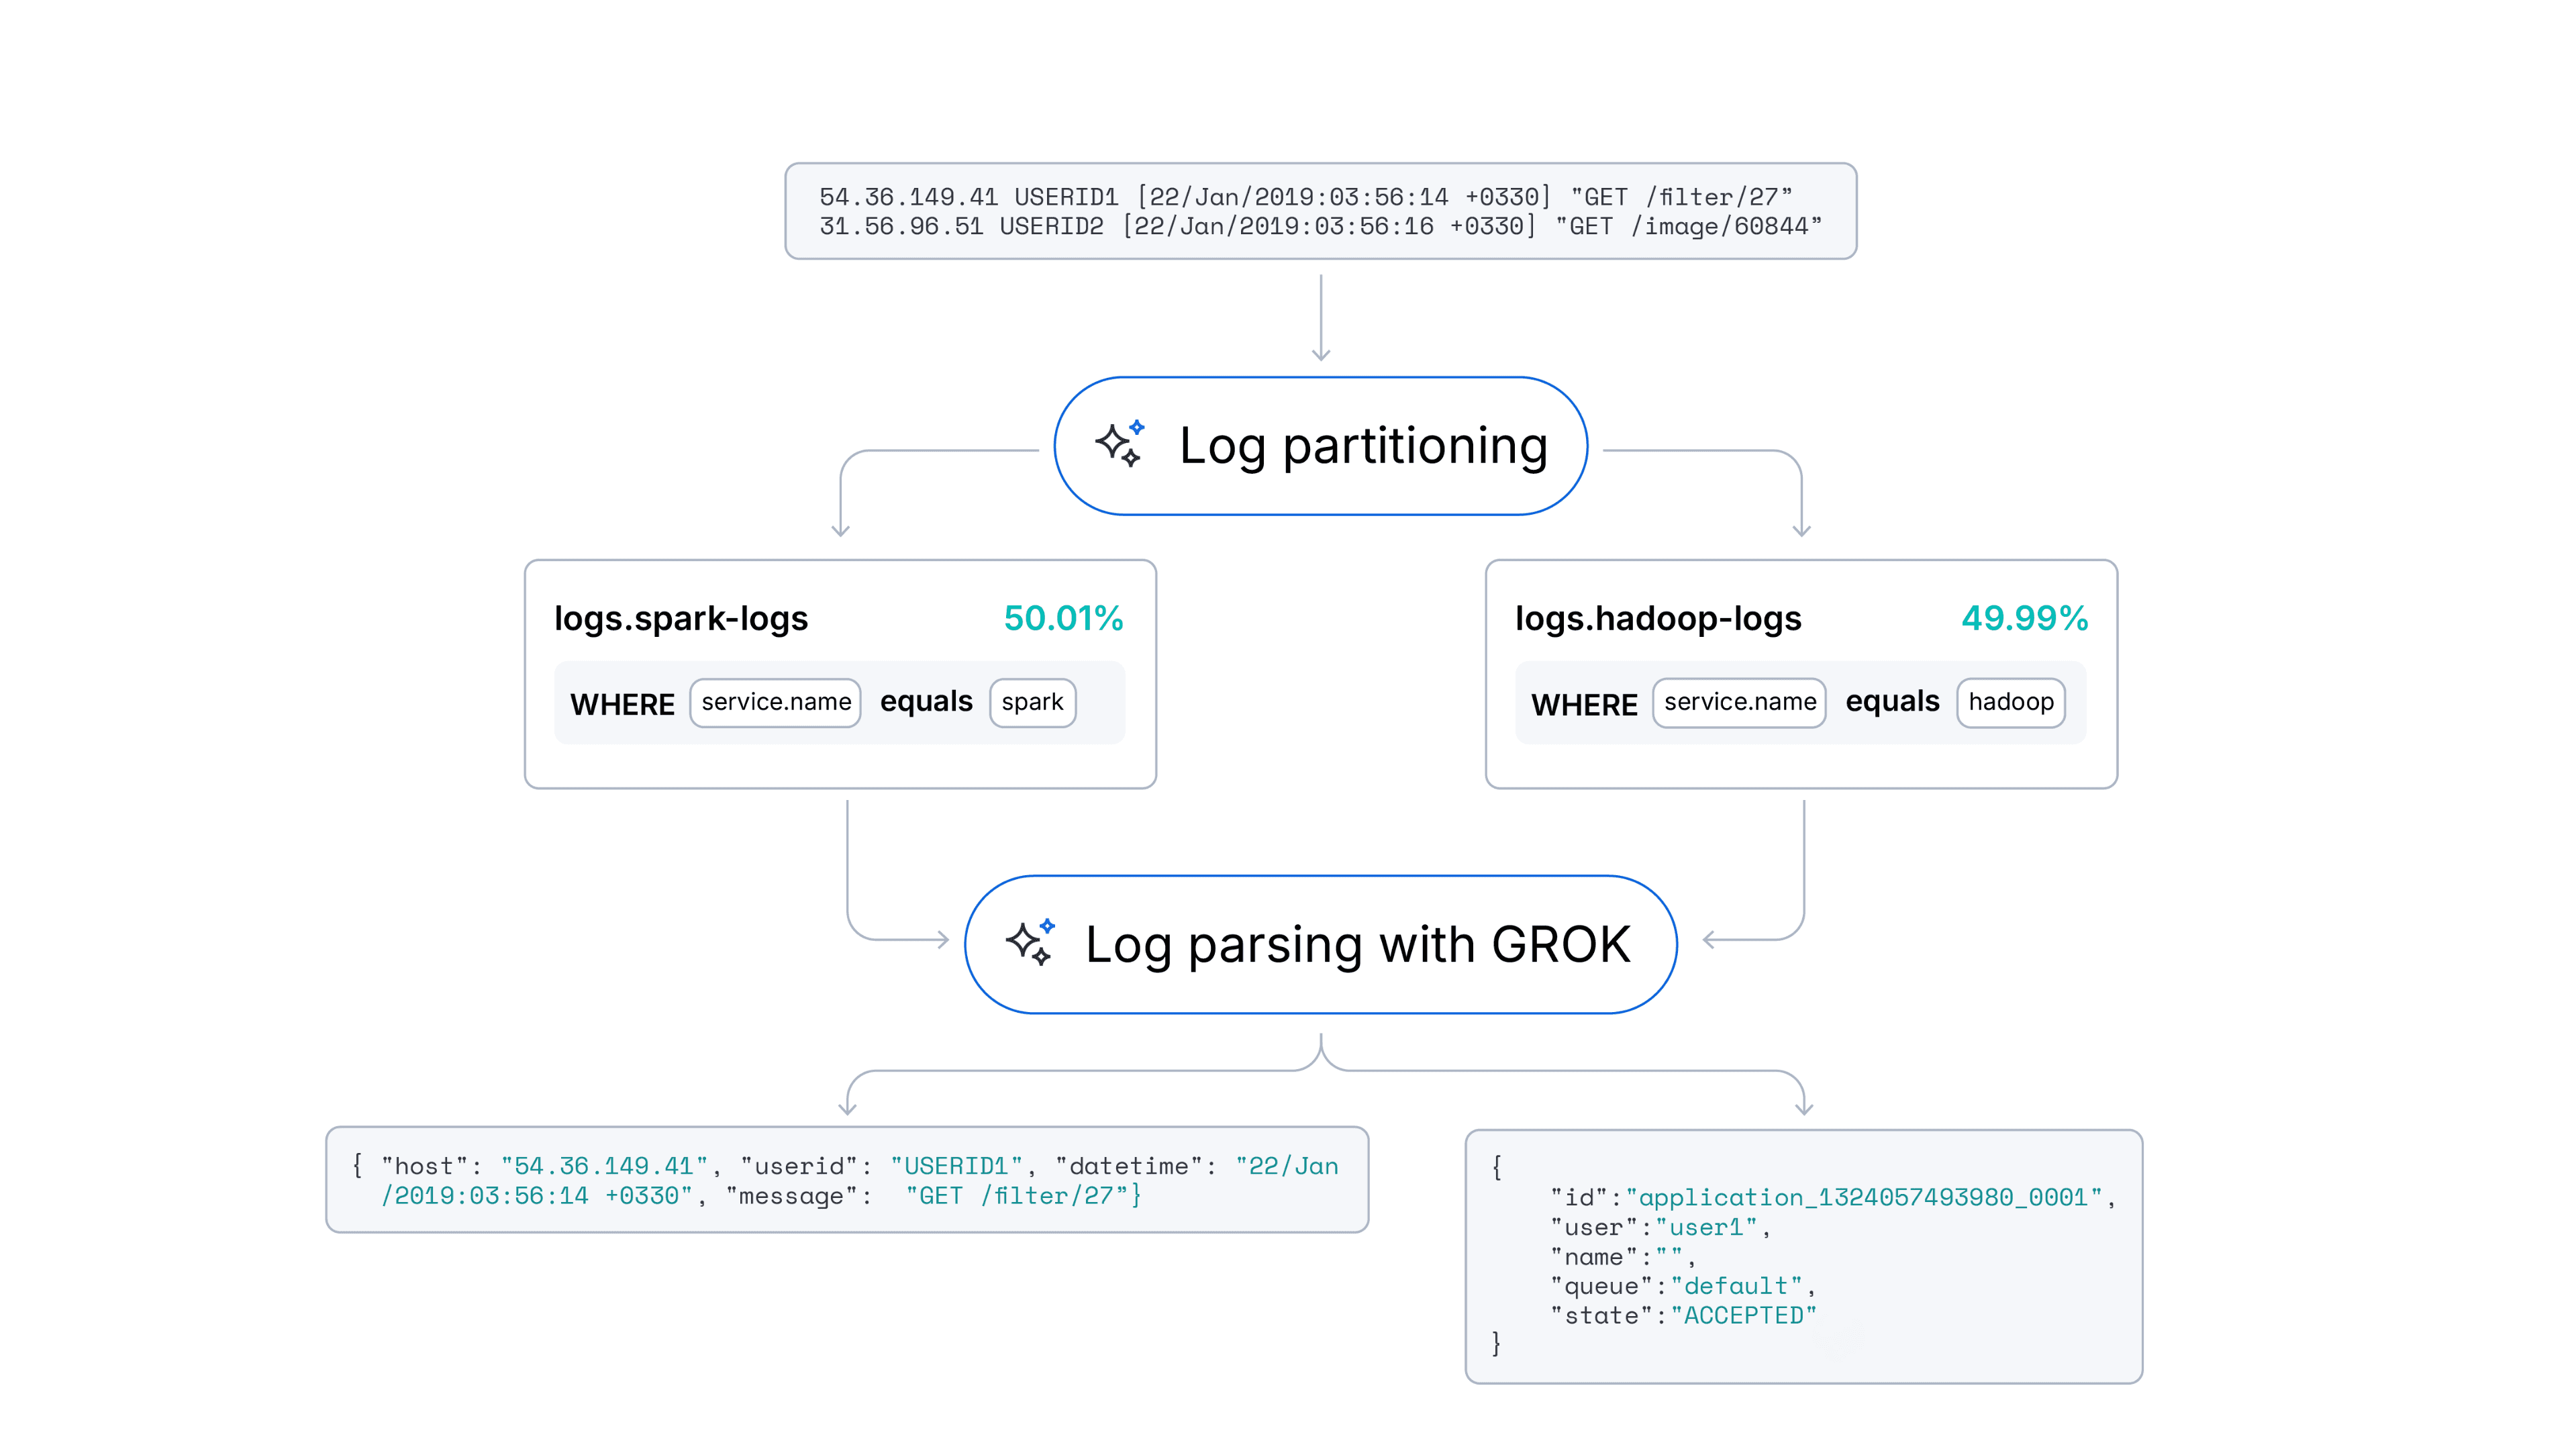
Automating log parsing in Streams with ML
Learn how a hybrid ML approach achieved 94% log parsing and 91% log partitioning accuracy through automation experiments with log format fingerprinting in Streams.
December 31, 2025
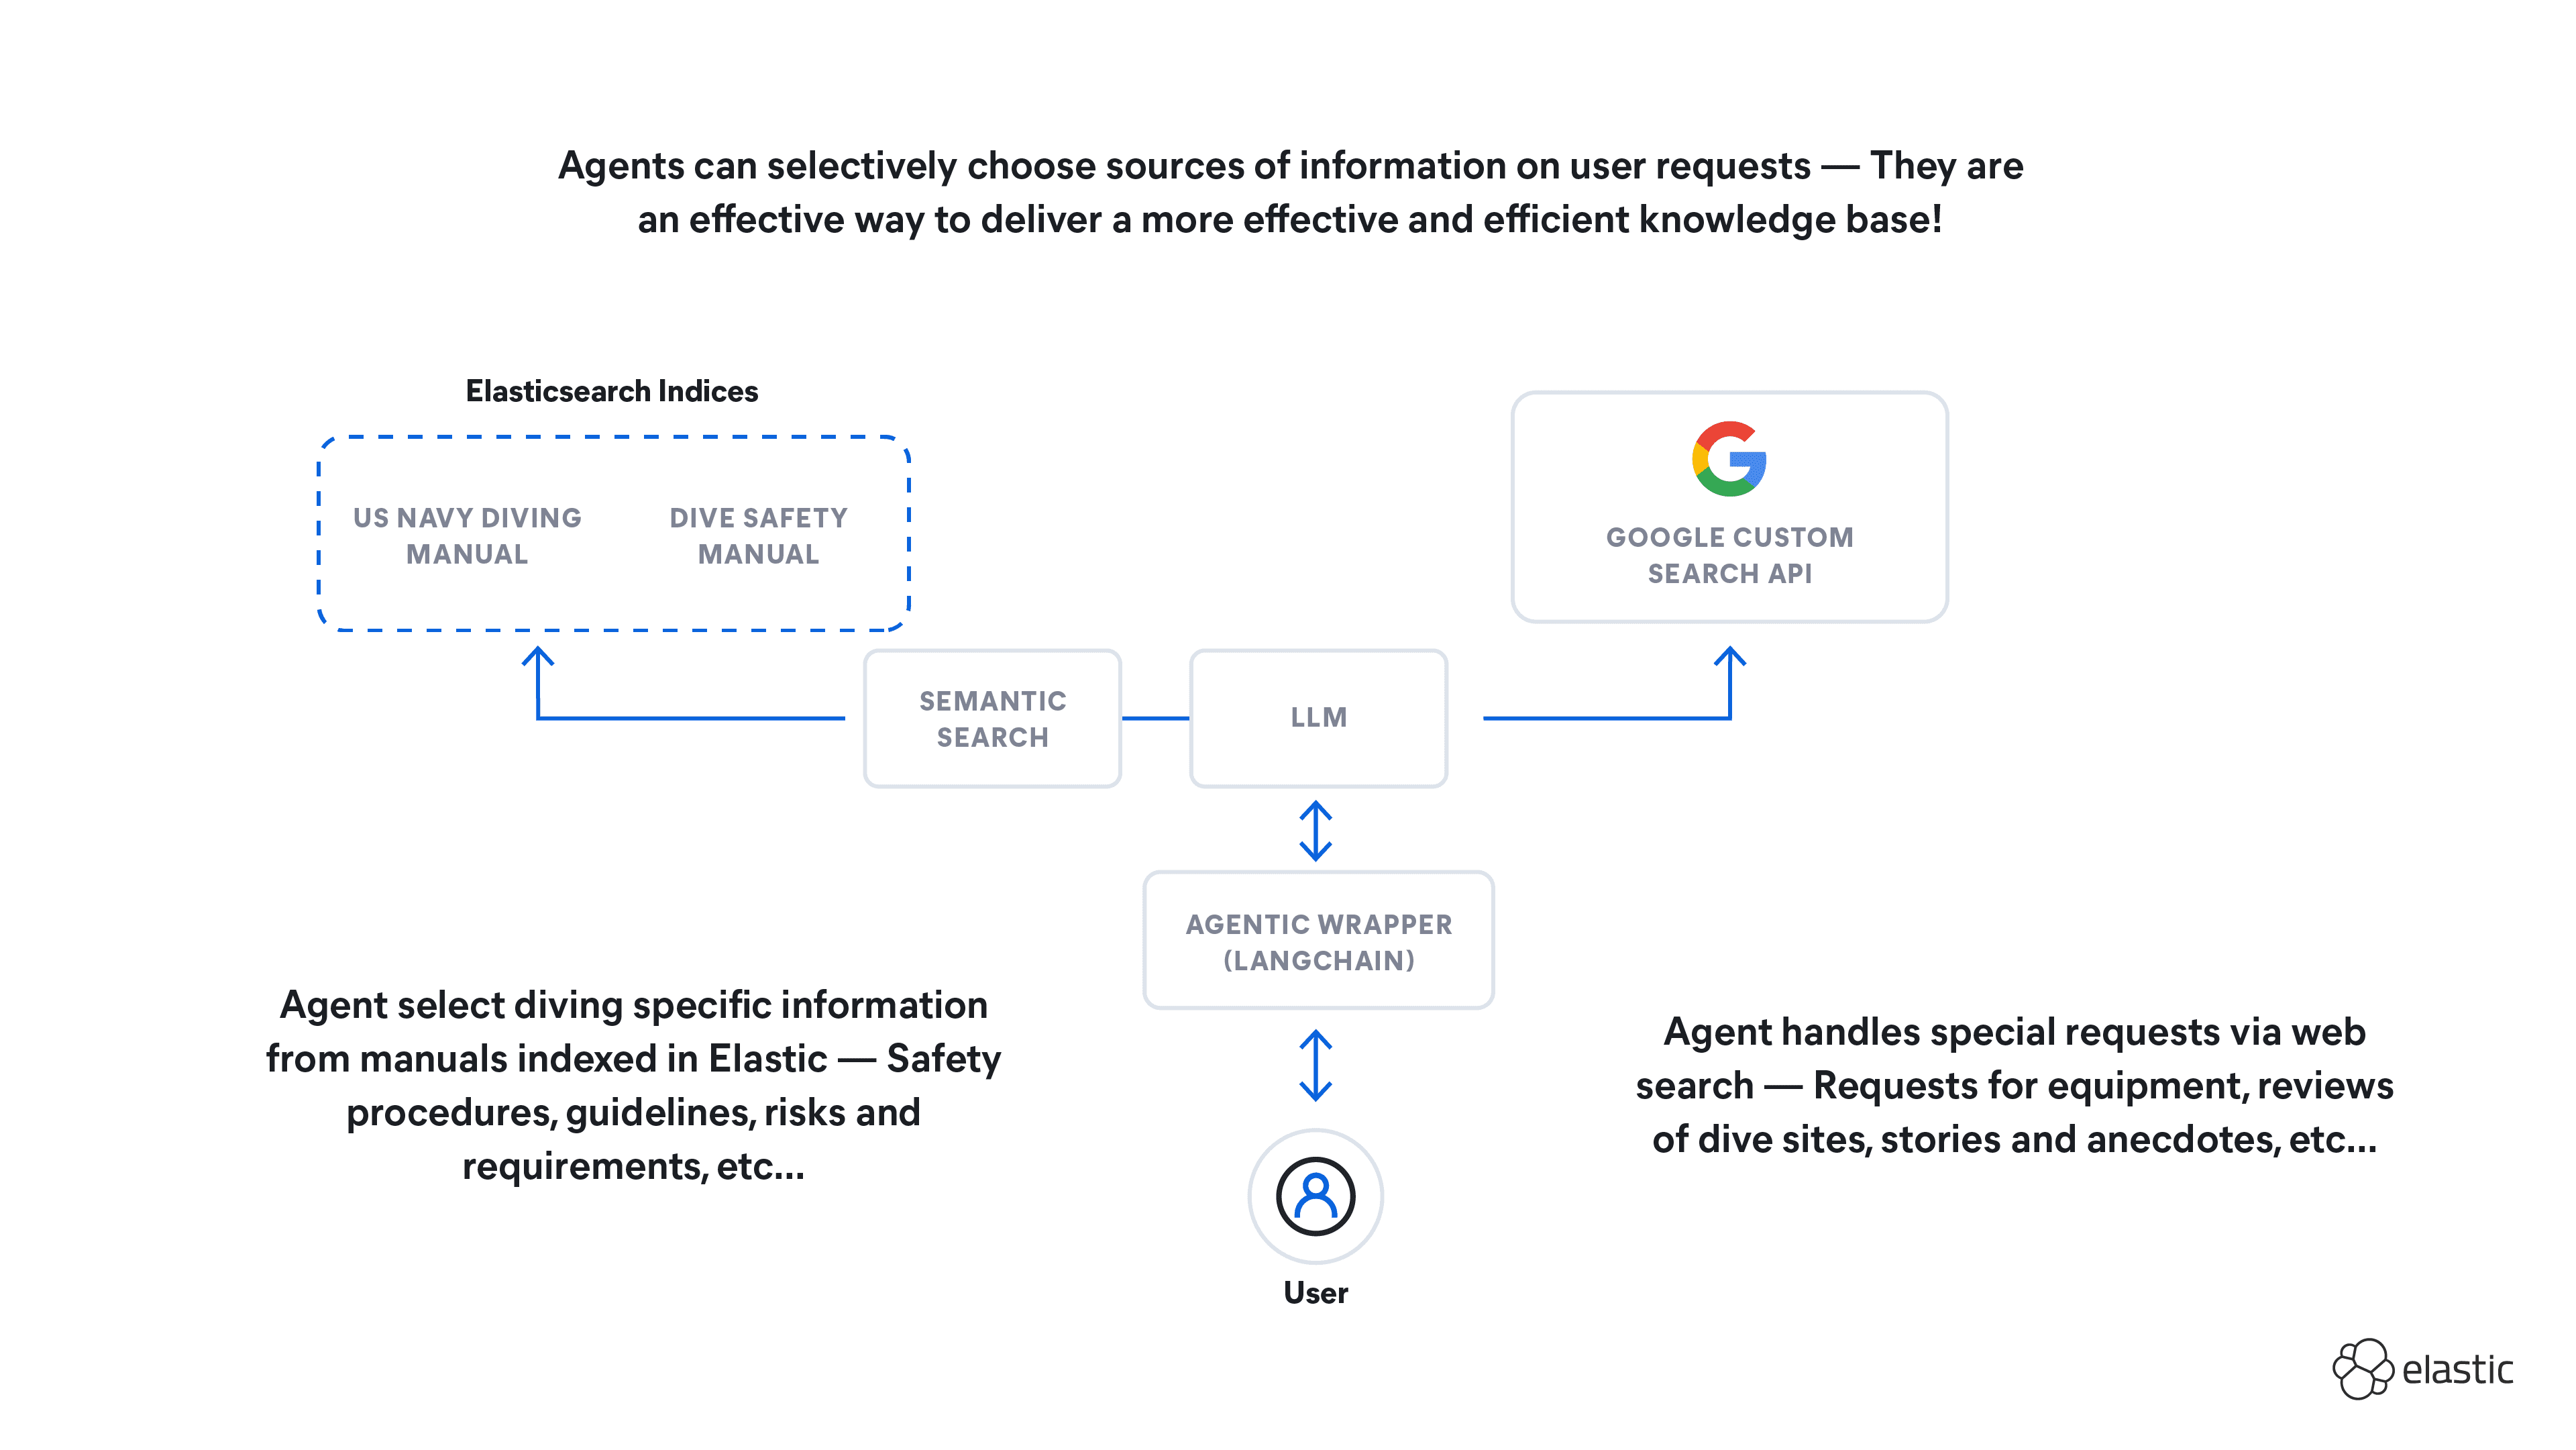
How to build an agent knowledge base with LangChain and Elasticsearch
Learn how to build an agent knowledge base and test its ability to query sources of information based on context, use WebSearch for out-of-scope queries, and refine recommendations based on user intention.
December 29, 2025
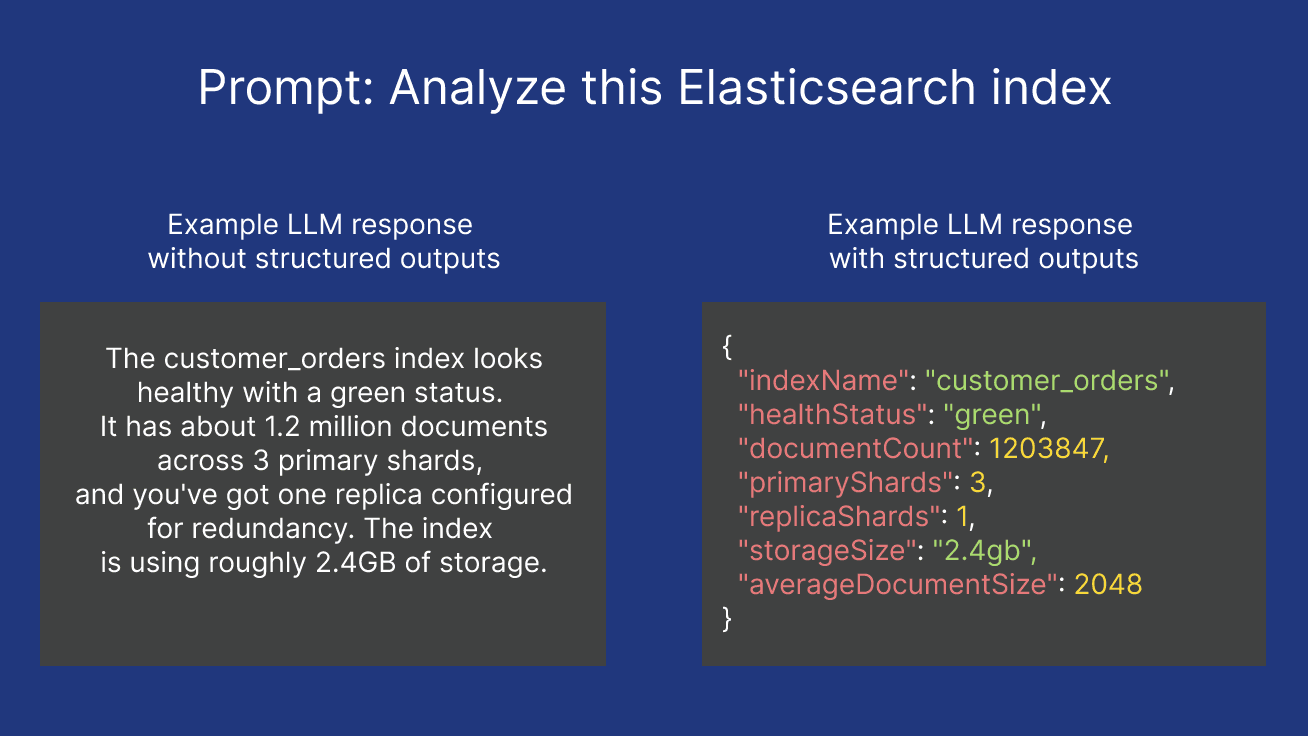
Creating reliable agents with structured outputs in Elasticsearch
Explore what structured outputs are and how to leverage them in Elasticsearch to ground agents in the most relevant context for data contracts.
December 15, 2025
Getting started with Elastic Agent Builder and Strands Agents SDK
Learn how to create an agent with Elastic Agent Builder and then explore how to use the agent via the A2A protocol orchestrated with the Strands Agents SDK.

November 25, 2025
Top Elastic Agent Builder projects and learnings from Cal Hacks 12.0
Explore the top Elastic Agent Builder projects from Cal Hacks 12.0 and dive into our technical takeaways on Serverless, ES|QL, and agent architectures.