Getting started: Deploy your own platform to store, search, and visualize any data
editGetting started: Deploy your own platform to store, search, and visualize any data
editThis guide shows you how to set up a general purpose Elastic deployment to store, search, and visualize any data. Start here if you are interested building a custom solution on the Elastic search platform.
Prerequisites
editTo get started, all you need is an internet connection and an email address.
Step 1: Create an Elastic Cloud deployment
editIf you’ve already signed up for a trial deployment you can skip this step.
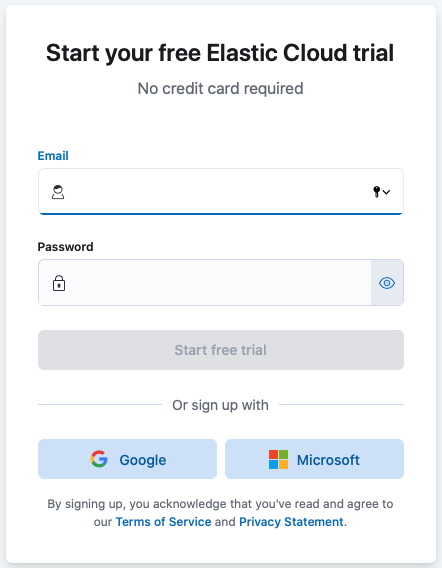
An Elastic Cloud deployment offers you all of the features of the Elastic Stack as a hosted service. To test drive your first deployment, sign up for a free Elastic Cloud trial:
- Go to our Elastic Cloud Trial page.
-
Enter your email address and a password.
-
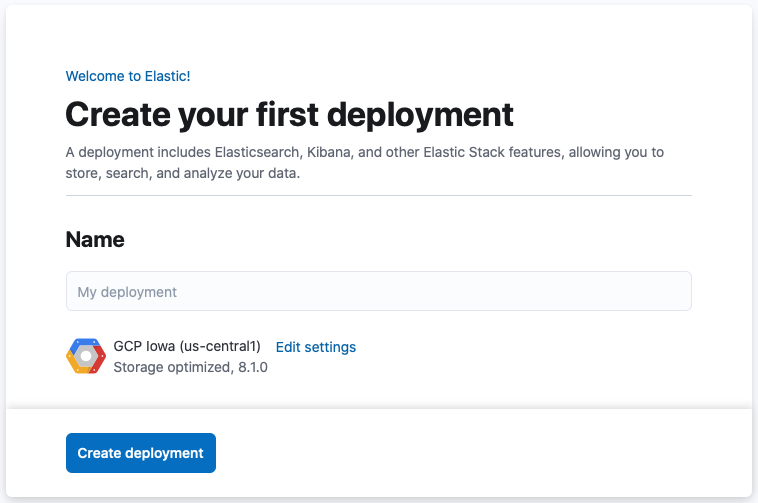
After you’ve logged in, you can create a deployment. Give your deployment a name and select Create deployment.
-
While the deployment sets up, make a note of your
elasticsuperuser password and keep it in a safe place. - Once the deployment is ready, select Continue. At this point, you access Kibana and a selection of setup guides.
Step 2: Add data to Elasticsearch
editYou can add data to Elasticsearch by sending JSON objects (documents) to Elasticsearch over HTTP. Whether you have structured or unstructured text, numerical data, or geospatial data, Elasticsearch efficiently stores and indexes it in a way that supports fast searches.
This tutorial uses the Kibana Dev Tools console to submit REST requests to Elasticsearch, but you can use any HTTP client to send requests to Elasticsearch. Elasticsearch provides clients for Java, Javascript, and many other popular languages.
Use Elastic Agent to collect data from hosts or containers that you need to monitor. For more information, check Monitor applications and systems.
To add a document to a new index:
- Select I’d like to do something else to open the Kibana home page (note that can also always get to the Kibana home page by clicking the Elastic logo).
-
Open the Kibana main menu, select Dev Tools, then Console.
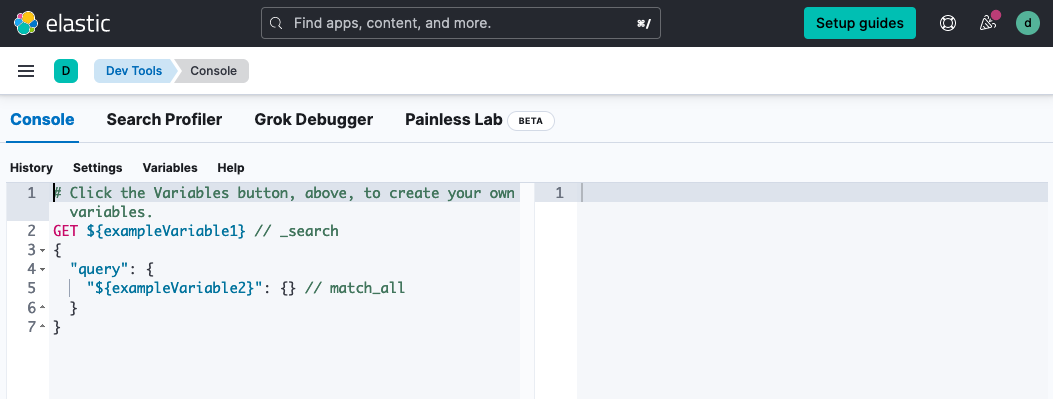
The next few steps have code samples that have
View in Consolelinks. These links paste the code samples into your Kibana console.To use
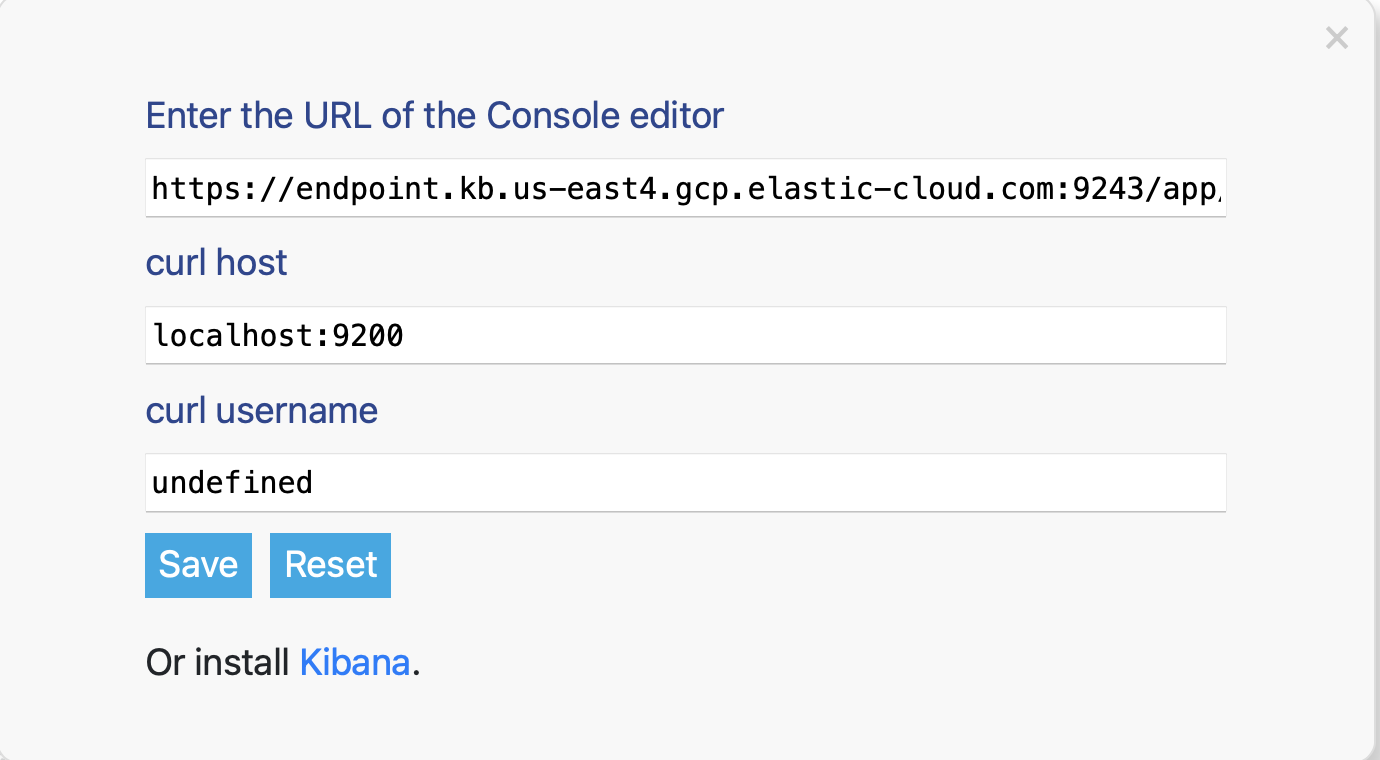
View in Console, configure the connection and select the View in Console link. You only need to configure the connection once.- Select the gear icon in any code sample to open the connection settings.
- Copy the URL from your Kibana > Dev Tools > Console tab and paste it into the connection settings as the URL of the Console editor.
- Select Save.
-
Submit an HTTP post request that contains a JSON document.
POST /customer/_doc/1
{
  "name": "John Doe"
}
This request automatically creates the
customerindex, adds a new document that has an ID of 1, and stores and indexes thenamefield. -
The new document is available immediately from any node in the cluster. You can retrieve it with a GET request that specifies its document ID:
GET /customer/_doc/1
Step 3: Add data in bulk
editInstead of adding documents one at a time, you can use the _bulk endpoint
to add multiple documents in one request.
This minimizes network roundtrips and is significantly faster than adding documents one at a time.
Want to index some of your own data? You can upload data from a CSV, TSV, JSON file or use Elastic integrations to collect data from popular services and platforms like Nginx, AWS, and MongoDB. To check what’s available, select Add integrations on the Kibana home page.
The optimal batch size depends on a number of factors: the document size and complexity, the indexing and search load, and the resources available to your cluster. A good place to start is with batches of 1,000 to 5,000 documents and a total payload between 5MB and 15MB.
Bulk data must be newline-delimited JSON (NDJSON).
Each line must end in a newline character (\n), including the last line.
For example, submit the following bulk request to add 10 documents to the bank index.
POST bank/_bulk
{ "create":{ } }
{ "account_number":1,"balance":39225,"firstname":"Amber","lastname":"Duke","age":32,"gender":"M","address":"880 Holmes Lane","employer":"Pyrami","email":"[email protected]","city":"Brogan","state":"IL" }
{ "create":{ } }
{ "account_number":6,"balance":5686,"firstname":"Hattie","lastname":"Bond","age":36,"gender":"M","address":"671 Bristol Street","employer":"Netagy","email":"[email protected]","city":"Dante","state":"TN" }
{ "create":{ } }
{ "account_number":13,"balance":32838,"firstname":"Nanette","lastname":"Bates","age":28,"gender":"F","address":"789 Madison Street","employer":"Quility","email":"[email protected]","city":"Nogal","state":"VA" }
{ "create":{ } }
{ "account_number":18,"balance":4180,"firstname":"Dale","lastname":"Adams","age":33,"gender":"M","address":"467 Hutchinson Court","employer":"Boink","email":"[email protected]","city":"Orick","state":"MD" }
{ "create":{ } }
{ "account_number":20,"balance":16418,"firstname":"Elinor","lastname":"Ratliff","age":36,"gender":"M","address":"282 Kings Place","employer":"Scentric","email":"[email protected]","city":"Ribera","state":"WA" }
{ "create":{ } }
{ "account_number":25,"balance":40540,"firstname":"Virginia","lastname":"Ayala","age":39,"gender":"F","address":"171 Putnam Avenue","employer":"Filodyne","email":"[email protected]","city":"Nicholson","state":"PA" }
{ "create":{ } }
{ "account_number":32,"balance":48086,"firstname":"Dillard","lastname":"Mcpherson","age":34,"gender":"F","address":"702 Quentin Street","employer":"Quailcom","email":"[email protected]","city":"Veguita","state":"IN" }
{ "create":{ } }
{ "account_number":37,"balance":18612,"firstname":"Mcgee","lastname":"Mooney","age":39,"gender":"M","address":"826 Fillmore Place","employer":"Reversus","email":"[email protected]","city":"Tooleville","state":"OK" }
{ "create":{ } }
{ "account_number":44,"balance":34487,"firstname":"Aurelia","lastname":"Harding","age":37,"gender":"M","address":"502 Baycliff Terrace","employer":"Orbalix","email":"[email protected]","city":"Yardville","state":"DE" }
{ "create":{ } }
{ "account_number":49,"balance":29104,"firstname":"Fulton","lastname":"Holt","age":23,"gender":"F","address":"451 Humboldt Street","employer":"Anocha","email":"[email protected]","city":"Sunriver","state":"RI" }
Step 4: Search and sort data
editIndexed documents are available for search in near real-time.
To search for specific terms within a field, you can use a match query.
For example, the following request searches the address field
to find customers whose addresses contain mill or lane:
GET /bank/_search
{
  "query": { "match": { "address": "mill lane" } }
}
To construct more complex queries, you can use a bool query to combine multiple query criteria. You can designate criteria as required (must match), desirable (should match), or undesirable (must not match).
For example, the following request searches the bank index for accounts that belong to customers who are 39 years old, but excludes anyone who lives in Pennsylvania (PA):
GET /bank/_search
{
  "query": {
    "bool": {
      "must": [
        { "match": { "age": "39" } }
      ],
      "must_not": [
        { "match": { "state": "PA" } }
      ]
    }
  }
}
Step 5: Search and explore your data with Discover
editInstead of constructing and submitting REST requests directly to Elasticsearch, you can use Discover to search and filter your data, get information about the structure of the fields, and display your findings.
Kibana requires a data view in order to access the Elasticsearch data that you want to explore. A data view selects the data to use, and allows you to define properties of the fields.
A data view can point to one or more indices, data streams, or index aliases. For example, a data view can point to your log data from yesterday, or all indices that contain your data.
In order to use Discover and many more of the features and tools available in the Elastic Stack your data should be associated with a data view.
-
Select the data you want to work with:
- Open the Kibana main menu, and select Stack Management > Kibana > Data Views.
- Select Create data view.
-
Enter any name for your data view, and add an index pattern that matches one or more Elasticsearch index. You can create a data view over multiple indices by using the * wildcard. For this example, try a
b*index pattern.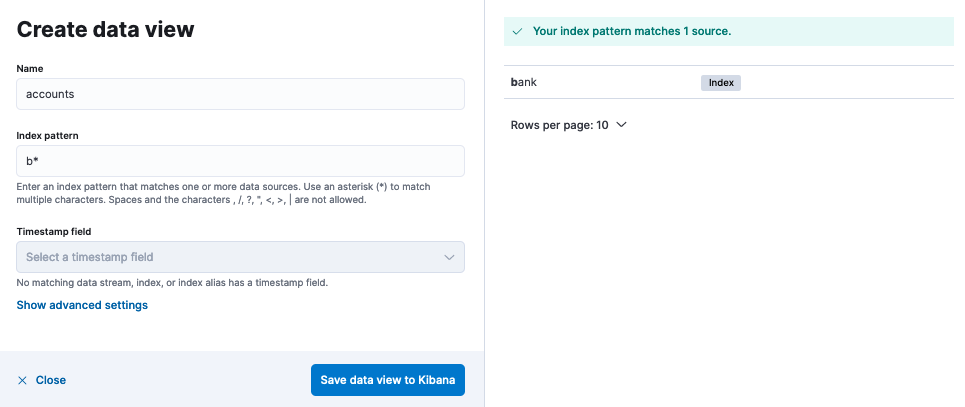
- Select Save data view to Kibana.
- Select Discover from the main menu.
-
Specify query criteria by adding filters.
- Select the + icon to add a filter.
-
Select a field and an operator, enter a value, and select Save. For this example, you can select to filter by:
-
The
agefield with operatorisand value39. -
The
statefield with operatoris notand valuePA.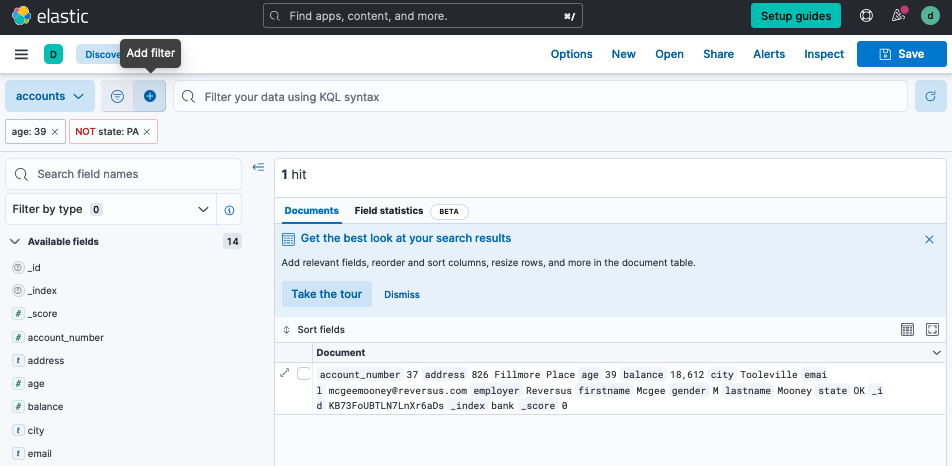
-
The
You can also directly specify your query criteria in the query bar using either Kibana Query Language (KQL) or Lucene syntax.
Step 6: Visualize your data
editYou can create visualizations and build dashboards in Kibana to understand your data and share information.
- Open the Kibana main menu, then select Dashboard.
- Select Create a Dashboard > Create visualization.
-
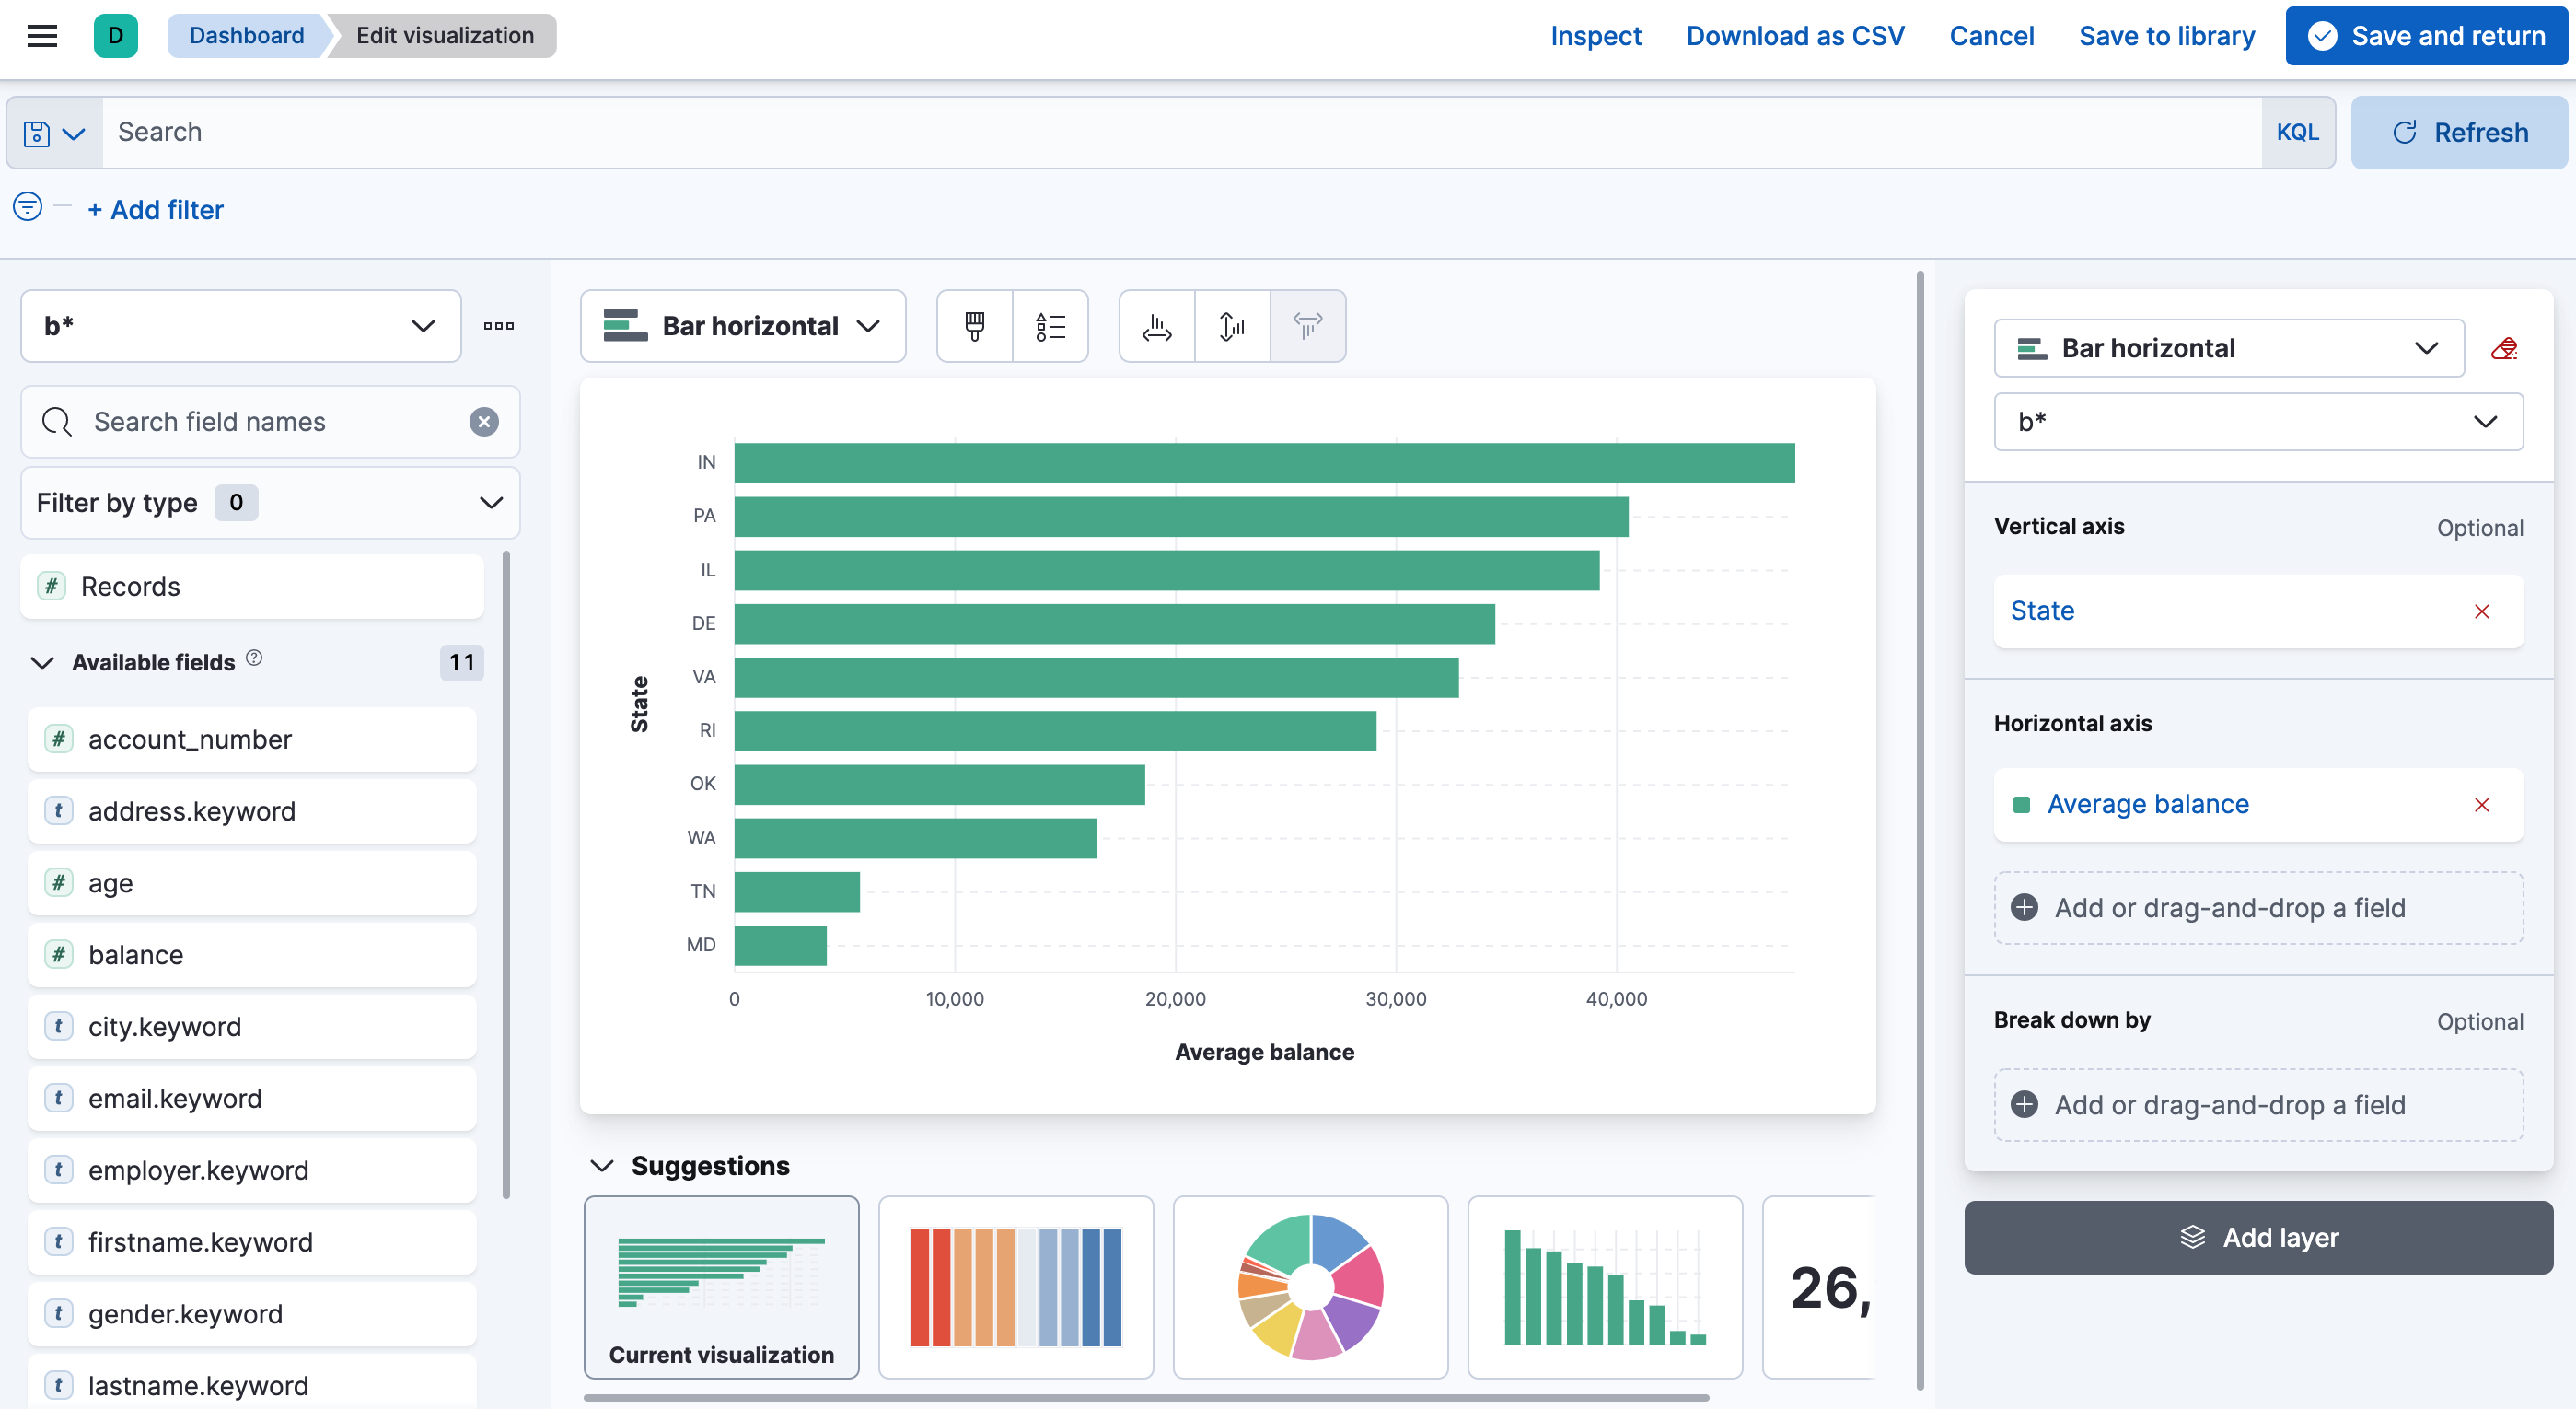
Drag and drop fields to create a visualization and then select Save and return. For example, to create a bar chart that shows the average balance by state:
-
Drag the
state.keywordfield onto the workspace. -
Drag the
balancefield onto the workspace. - Select Bar horizontal as the visualization type.
- In the layer pane, select Top 5 values of state.keyword, edit the Name of the vertical axis, increase the number of states that are shown, then select Close.
- In the layer pane, select Median of balance, change the function to Average, edit the Name of the horizontal axis, then select Close.
-
In the layer pane, remove Count of records from the horizontal axis if it is present.
-
Drag the
- Create more visualizations or select Save and return to save the dashboard.
Watch How-to Series: Kibana to learn more about creating visualizations with Kibana Lens and building dashboards.
What’s next?
editLearn more about Elasticsearch
- Mapping is the process of defining how a document, and the fields it contains, are stored and indexed.
- You performed some simple searches in this guide, learn more about searching your data.
- An aggregation summarizes your data as metrics, statistics, or other analytics.
Learn more about Kibana
- Get to know the details about data views.
- Lean about the Kibana Query Language (KQL), a simple syntax for filtering Elasticsearch data using free text search or field-based search.
- Create functional and beautiful maps from your geographical data. Use the maps to visualize, filter, and interact with your data.
- Model, detect, and predict behavior with Machine Learning.
Learn about Elastic solutions
- Want to monitor your infrastructure, applications, or user experience? Try out Elastic Observability.
- Want to add search to your website, applications, or organization data? Try out Enterprise Search.
- Want Elastic to do the heavy lifting? Use machine learning to detect anomalies.
- Want to protect your endpoints from security threats? Try Elastic Security.