Synthetic monitoring
editSynthetic monitoring
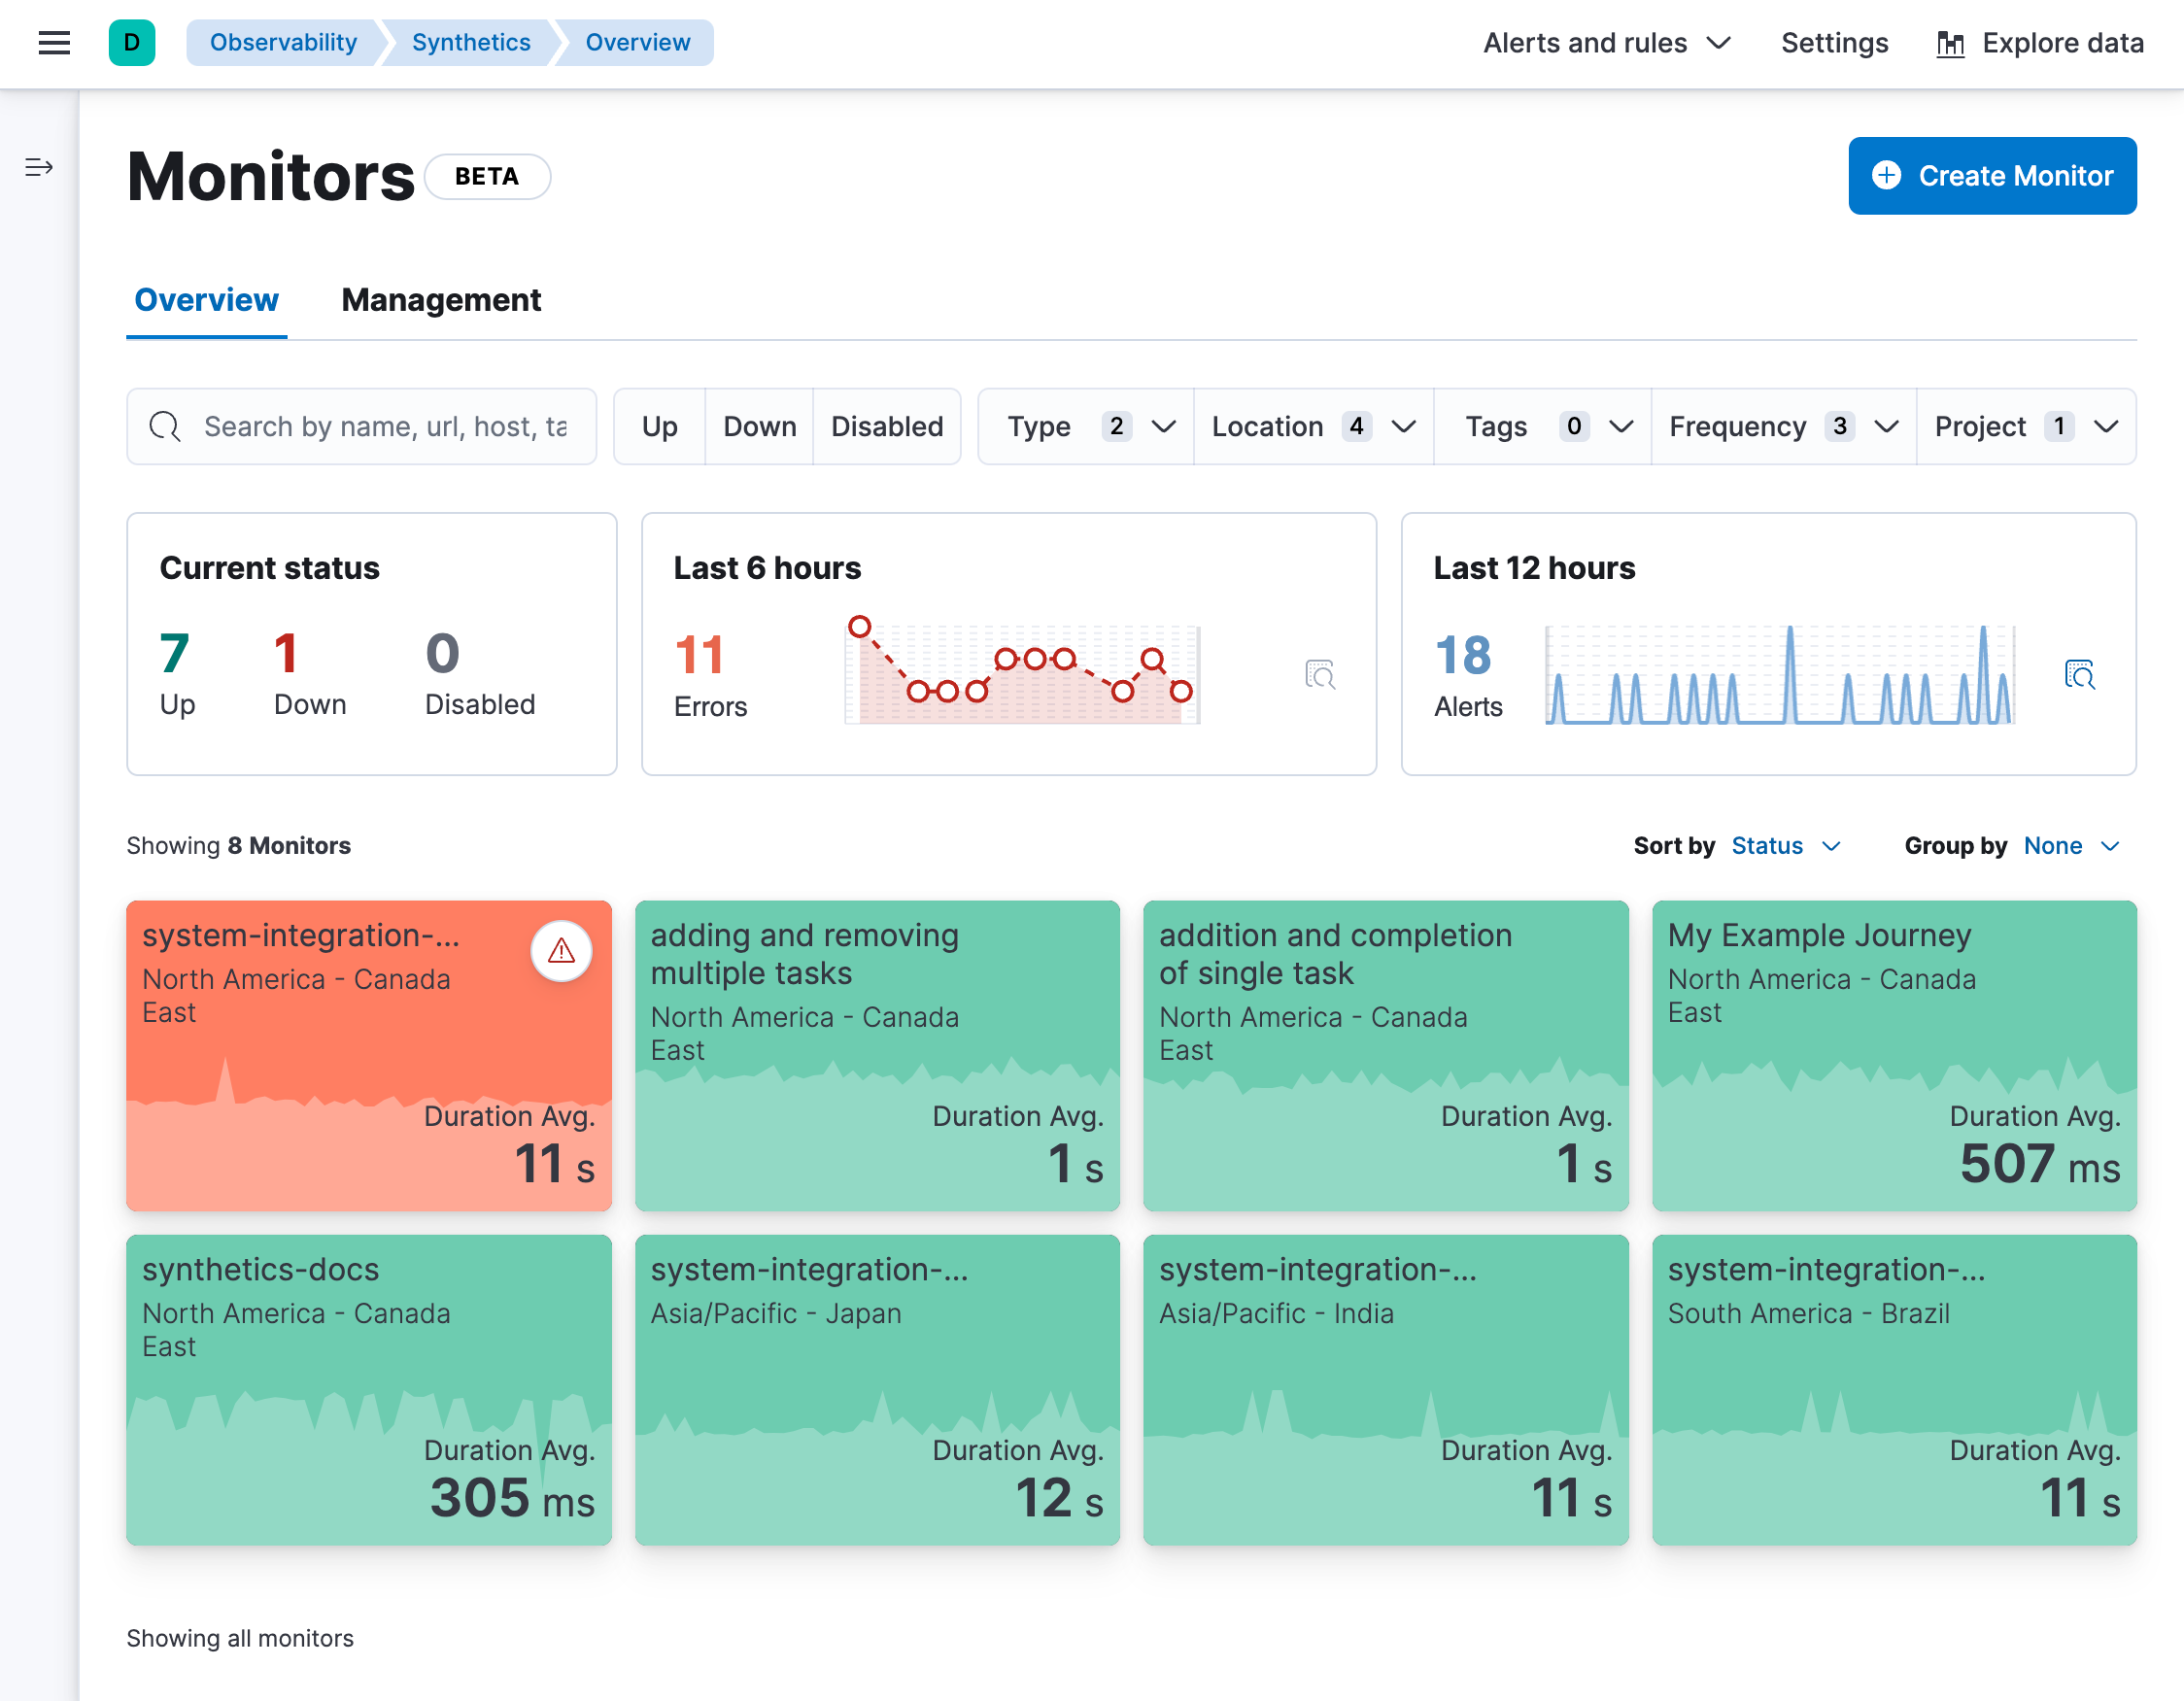
editThe Synthetics app is for viewing result data from monitors created and managed directly in the Synthetics app or managed externally using projects. This can include both lightweight and browser-based monitors, and can include monitors running from either Elastic’s global managed testing infrastructure or from Private Locations.
To view result data from lightweight monitors running through Heartbeat and configured with
a traditional heartbeat.yml file, use the Uptime app instead of the Synthetics app.
Synthetics periodically checks the status of your services and applications. Monitor the availability of network endpoints and services using the following types of monitors:
Lightweight HTTP/S, TCP, and ICMP monitors
editYou can monitor the status of network endpoints using the following lightweight checks:
HTTP monitor |
Monitor your website. The HTTP monitor checks to make sure specific endpoints return the correct status code and display the correct text. |
ICMP monitor |
Check the availability of your hosts. The ICMP monitor uses ICMP (v4 and v6) Echo Requests to check the network reachability of the hosts you are pinging. This will tell you whether the host is available and connected to the network, but doesn’t tell you if a service on the host is running or not. |
TCP monitor |
Monitor the services running on your hosts. The TCP monitor checks individual ports to make sure the service is accessible and running. |
To set up your first monitor, refer to Get started.
Browser monitors
editReal browser synthetic monitoring enables you to test critical actions and requests that an end-user would make on your site at predefined intervals and in a controlled environment. Synthetic monitoring extends traditional end-to-end testing techniques because it allows your tests to run continuously on the cloud. The result is rich, consistent, and repeatable data that you can trend and alert on.
For example, you can test popular user journeys, like logging in, adding items to a cart, and checking out — actions that need to work for your users consistently.
You can run automated synthetic monitoring projects on a real Chromium browser and view each synthetic monitoring journey in Kibana side-by-side with your other monitors.
Alerting helps you detect degraded performance or broken actions before your users do. By receiving alerts early, you can fix issues before they impact your bottom line or customer experience.
To set up your first monitor, refer to Get started.