- Machine Learning: other versions:
- What is Elastic Machine Learning?
- Setup and security
- Anomaly detection
- Finding anomalies
- Tutorial: Getting started with anomaly detection
- Advanced concepts
- API quick reference
- How-tos
- Generating alerts for anomaly detection jobs
- Aggregating data for faster performance
- Altering data in your datafeed with runtime fields
- Customizing detectors with custom rules
- Detecting anomalous categories of data
- Performing population analysis
- Reverting to a model snapshot
- Detecting anomalous locations in geographic data
- Mapping anomalies by location
- Adding custom URLs to machine learning results
- Anomaly detection jobs from visualizations
- Exporting and importing machine learning jobs
- Resources
- Function reference
- Supplied configurations
- Apache anomaly detection configurations
- APM anomaly detection configurations
- Auditbeat anomaly detection configurations
- Logs anomaly detection configurations
- Metricbeat anomaly detection configurations
- Metrics anomaly detection configurations
- Nginx anomaly detection configurations
- Security anomaly detection configurations
- Uptime anomaly detection configurations
- Data frame analytics
- Natural language processing
Creating anomaly detection jobs from Lens visualizations
editCreating anomaly detection jobs from Lens visualizations
editYou can create anomaly detection jobs from the compatible Lens charts on Dashboard.
Prerequisites and limitations
edit-
Only chart-like visualizations are compatible. Supported chart types are
area,area_percentage_stacked,area_stacked,bar,bar_horizontal,bar_horizontal_stacked,bar_percentage_stacked,bar_stacked, andline. -
Supported anomaly detection functions are
average,count,max,median,min,sum,unique_count. - The chart must contain a date field on one axis and it must be the same as the default date field for the data view.
- In case of a multi-layered chart, only the compatible layers can be used to create an anomaly detection job.
-
Chart layers which contain a field that uses a
time shift
or a field that has a
filter bysetting applied cannot be used to create an anomaly detection job.
Creating the job
editYou need to have a compatible visualization on Dashboard to create an
anomaly detection job. If you don’t have one but you want to try the feature out, go to
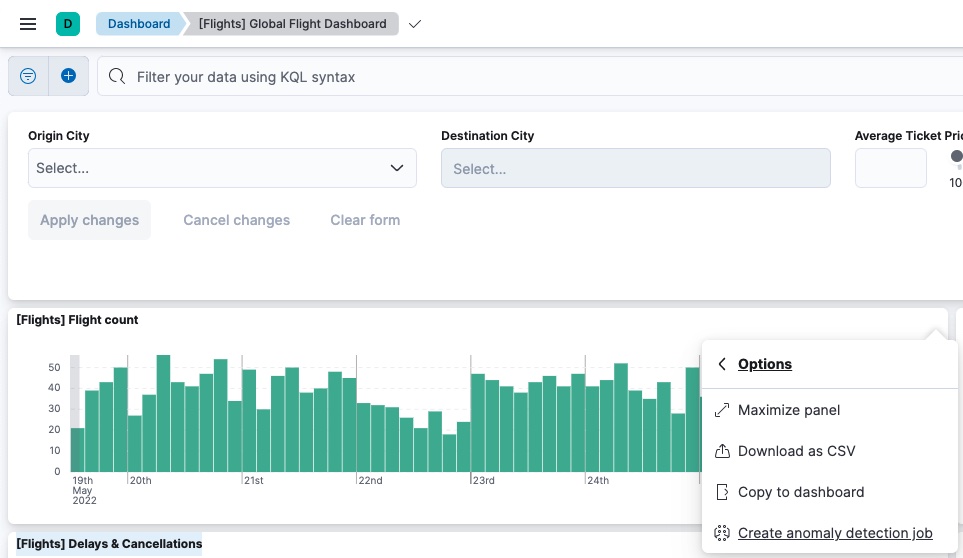
Analytics > Dashboard and select the [Flight] Global Flight Dashboard
which is based on the Kibana sample flight data set. Select the Flight count
visualization from the dashboard.
- Go to Analytics > Dashboard from the main menu, or use the global search field. Select a dashboard with a compatible visualization.
- Open the Options (…) menu for the panel, then select More.
- Select Create anomaly detection job. The option is only displayed if the visualization can be converted to an anomaly detection job configuration.
- (Optional) Select the layer from which the anomaly detection job is created.
If the visualization has multiple compatible layers, you can select which layer to use for creating the anomaly detection job.
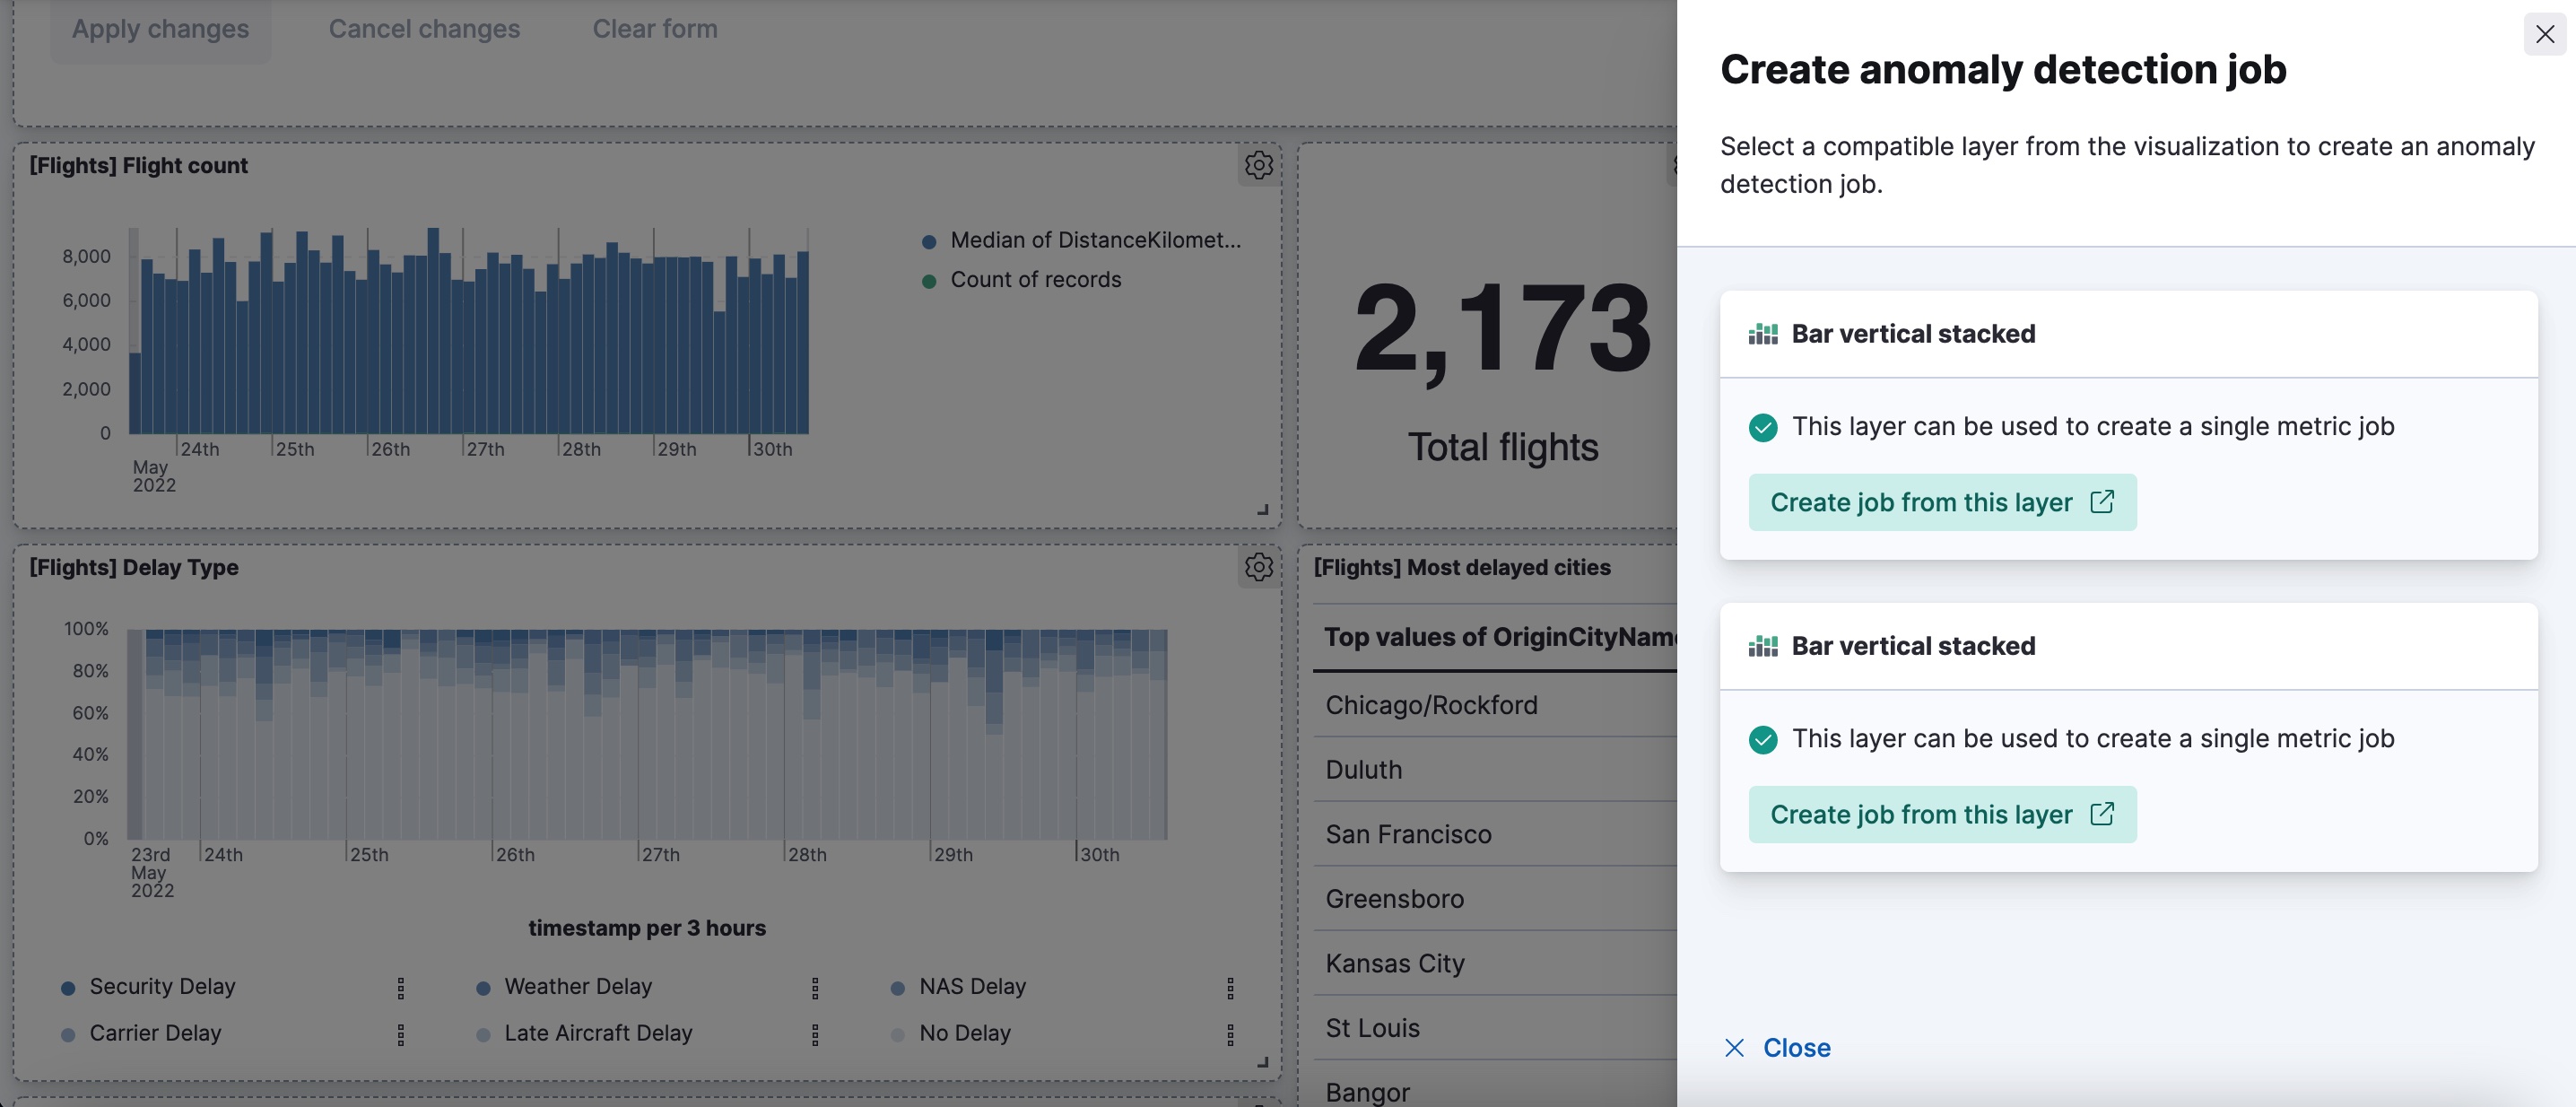
If multiple fields are added to the chart or you selected a Break down by
field, the multi metric job wizard is used for creating the job. For a single
metric chart, the single metric wizard is used.
If the configured time range of the chart is relative, it is converted to absolute start and end times in the job configuration. If the conversion of these times fails, the whole time range from the index is used.