- Kibana Guide: other versions:
- What is Kibana?
- What’s new in 8.16
- Kibana concepts
- Quick start
- Set up
- Install Kibana
- Configure Kibana
- Alerting and action settings
- APM settings
- Banners settings
- Cases settings
- Enterprise Search settings
- Fleet settings
- i18n settings
- Logging settings
- Logs settings
- Metrics settings
- Monitoring settings
- Reporting settings
- Search sessions settings
- Secure settings
- Security settings
- Spaces settings
- Task Manager settings
- Telemetry settings
- URL drilldown settings
- Start and stop Kibana
- Access Kibana
- Securing access to Kibana
- Add data
- Upgrade Kibana
- Configure security
- Configure reporting
- Configure logging
- Configure monitoring
- Command line tools
- Production considerations
- Discover
- Dashboards
- Canvas
- Maps
- Build a map to compare metrics by country or region
- Track, visualize, and alert on assets in real time
- Map custom regions with reverse geocoding
- Heat map layer
- Tile layer
- Vector layer
- Plot big data
- Search geographic data
- Configure map settings
- Connect to Elastic Maps Service
- Import geospatial data
- Troubleshoot
- Reporting and sharing
- Machine learning
- Graph
- Alerting
- Observability
- Search
- Security
- Dev Tools
- Fleet
- Osquery
- Stack Monitoring
- Stack Management
- Cases
- Connectors
- Amazon Bedrock
- Cases
- CrowdStrike
- D3 Security
- Google Gemini
- IBM Resilient
- Index
- Jira
- Microsoft Teams
- Observability AI Assistant
- OpenAI
- Opsgenie
- PagerDuty
- SentinelOne
- Server log
- ServiceNow ITSM
- ServiceNow SecOps
- ServiceNow ITOM
- Swimlane
- Slack
- TheHive
- Tines
- Torq
- Webhook
- Webhook - Case Management
- xMatters
- Preconfigured connectors
- License Management
- Maintenance windows
- Manage data views
- Numeral Formatting
- Rollup Jobs
- Manage saved objects
- Security
- Spaces
- Advanced Settings
- Tags
- Upgrade Assistant
- Watcher
- REST API
- Get features API
- Kibana spaces APIs
- Kibana role management APIs
- User session management APIs
- Saved objects APIs
- Data views API
- Index patterns APIs
- Alerting APIs
- Action and connector APIs
- Cases APIs
- Import and export dashboard APIs
- Logstash configuration management APIs
- Machine learning APIs
- Osquery manager API
- Short URLs APIs
- Get Task Manager health
- Upgrade assistant APIs
- Synthetics APIs
- Uptime APIs
- Kibana plugins
- Troubleshooting
- Accessibility
- Release notes
- Upgrade notes
- Kibana 8.16.4
- Kibana 8.16.3
- Kibana 8.16.2
- Kibana 8.16.1
- Kibana 8.16.0
- Kibana 8.15.5
- Kibana 8.15.4
- Kibana 8.15.3
- Kibana 8.15.2
- Kibana 8.15.1
- Kibana 8.15.0
- Kibana 8.14.3
- Kibana 8.14.2
- Kibana 8.14.1
- Kibana 8.14.0
- Kibana 8.13.4
- Kibana 8.13.3
- Kibana 8.13.2
- Kibana 8.13.1
- Kibana 8.13.0
- Kibana 8.12.2
- Kibana 8.12.1
- Kibana 8.12.0
- Kibana 8.11.4
- Kibana 8.11.3
- Kibana 8.11.2
- Kibana 8.11.1
- Kibana 8.11.0
- Kibana 8.10.4
- Kibana 8.10.3
- Kibana 8.10.2
- Kibana 8.10.1
- Kibana 8.10.0
- Kibana 8.9.2
- Kibana 8.9.1
- Kibana 8.9.0
- Kibana 8.8.2
- Kibana 8.8.1
- Kibana 8.8.0
- Kibana 8.7.1
- Kibana 8.7.0
- Kibana 8.6.1
- Kibana 8.6.0
- Kibana 8.5.2
- Kibana 8.5.1
- Kibana 8.5.0
- Kibana 8.4.3
- Kibana 8.4.2
- Kibana 8.4.1
- Kibana 8.4.0
- Kibana 8.3.3
- Kibana 8.3.2
- Kibana 8.3.1
- Kibana 8.3.0
- Kibana 8.2.3
- Kibana 8.2.2
- Kibana 8.2.1
- Kibana 8.2.0
- Kibana 8.1.3
- Kibana 8.1.2
- Kibana 8.1.1
- Kibana 8.1.0
- Kibana 8.0.0
- Kibana 8.0.0-rc2
- Kibana 8.0.0-rc1
- Kibana 8.0.0-beta1
- Kibana 8.0.0-alpha2
- Kibana 8.0.0-alpha1
- Developer guide
IMPORTANT: No additional bug fixes or documentation updates
will be released for this version. For the latest information, see the
current release documentation.
Create a dashboard
editCreate a dashboard
edit- Open the Dashboards page in Kibana.
-
Select Create dashboard to start with an empty dashboard.
When you create a dashboard, you are automatically in edit mode and can make changes to the dashboard.
-
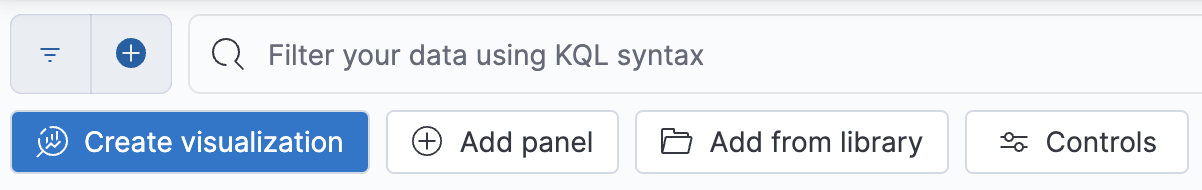
Add content to the dashboard. You have several options covered in more detail in the Visualizations section:
- Create visualization. This option is a shortcut to create a chart using Lens, the default visualization editor in Kibana.
- Add panel. Choose one of the available panels to add and configure content to your dashboard.
- Add from library. Select existing content that has already been configured and saved to the Visualize Library.
-
Controls. Add controls to help filter the content of your dashboard.
- Organize your dashboard by organizing the various panels.
-
Define the main settings of your dashboard from the Settings menu located in the toolbar.
- A meaningful title, description, and tags allow you to find the dashboard quickly later when browsing your list of dashboards or using the Kibana search bar.
-
Additional display options allow you unify the look and feel of the dashboard’s panels:
- Store time with dashboard — Saves the specified time filter.
- Use margins between panels — Adds a margin of space between each panel.
- Show panel titles — Displays the titles in the panel headers.
- Sync color palettes across panels — Applies the same color palette to all panels on the dashboard.
- Sync cursor across panels — When you hover your cursor over a time series chart or a heatmap, the cursor on all other related dashboard charts automatically appears.
- Sync tooltips across panels — When you hover your cursor over a Lens chart, the tooltips on all other related dashboard charts automatically appear.
-
Click Apply.
- Click Save to save the dashboard.
Was this helpful?
Thank you for your feedback.