Service overview
editService overview
editSelecting a non-mobile service brings you to the Service overview. The Service overview contains a wide variety of charts and tables that provide high-level visibility into how a service is performing across your infrastructure:
- Service details like service version, runtime version, framework, and APM agent name and version
- Container and orchestration information
- Cloud provider, machine type, service name, region, and availability zone
- Serverless function names and event trigger type
- Latency, throughput, and errors over time
- Service dependencies
Time series and expected bounds comparison
editFor insight into the health of your services, you can compare how a service performs relative to a previous time frame or to the expected bounds from the corresponding anomaly detection job. For example, has latency been slowly increasing over time, did the service experience a sudden spike, is the throughput similar to what the machine learning job expects – enabling a comparison can provide the answer.
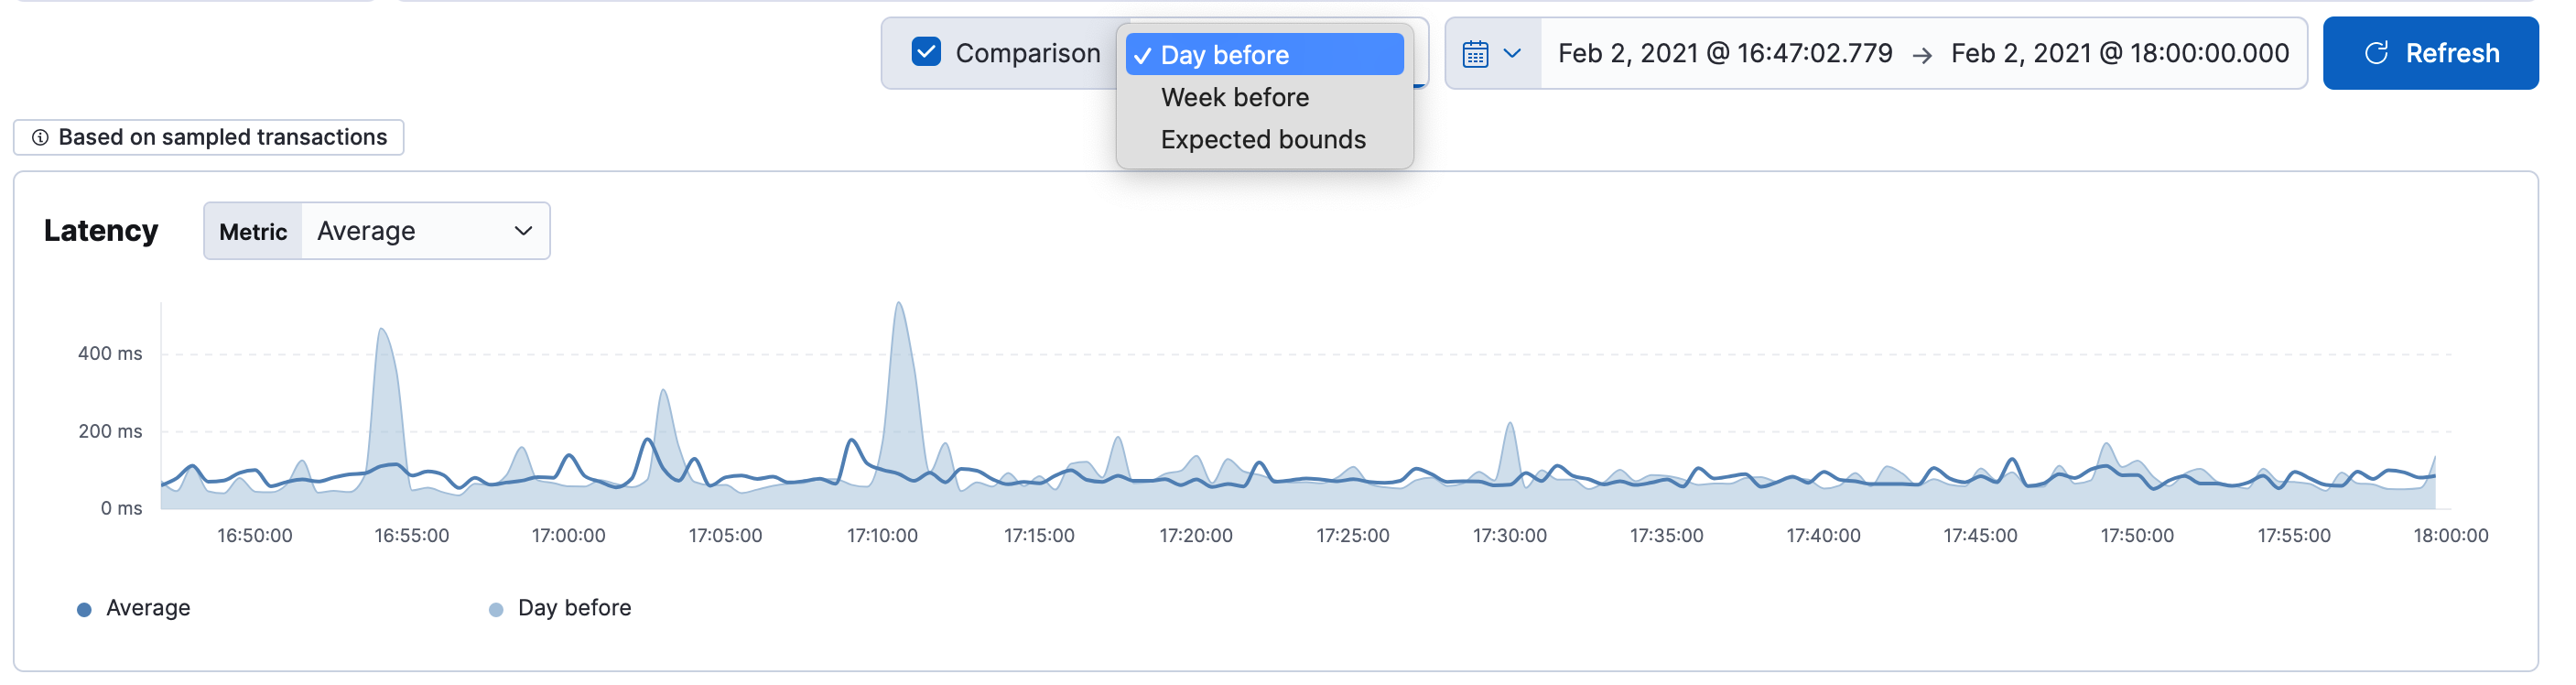
Select the Comparison box to apply a time-based or expected bounds comparison. The time-based comparison options are based on the selected time filter range:
| Time filter | Time comparison options |
|---|---|
≤ 24 hours |
One day or one week |
> 24 hours and ≤ 7 days |
One week |
> 7 days |
An identical amount of time immediately before the selected time range |
You can use the expected bounds comparison if machine learning jobs exist in your selected environment and you have access to the machine learning features.
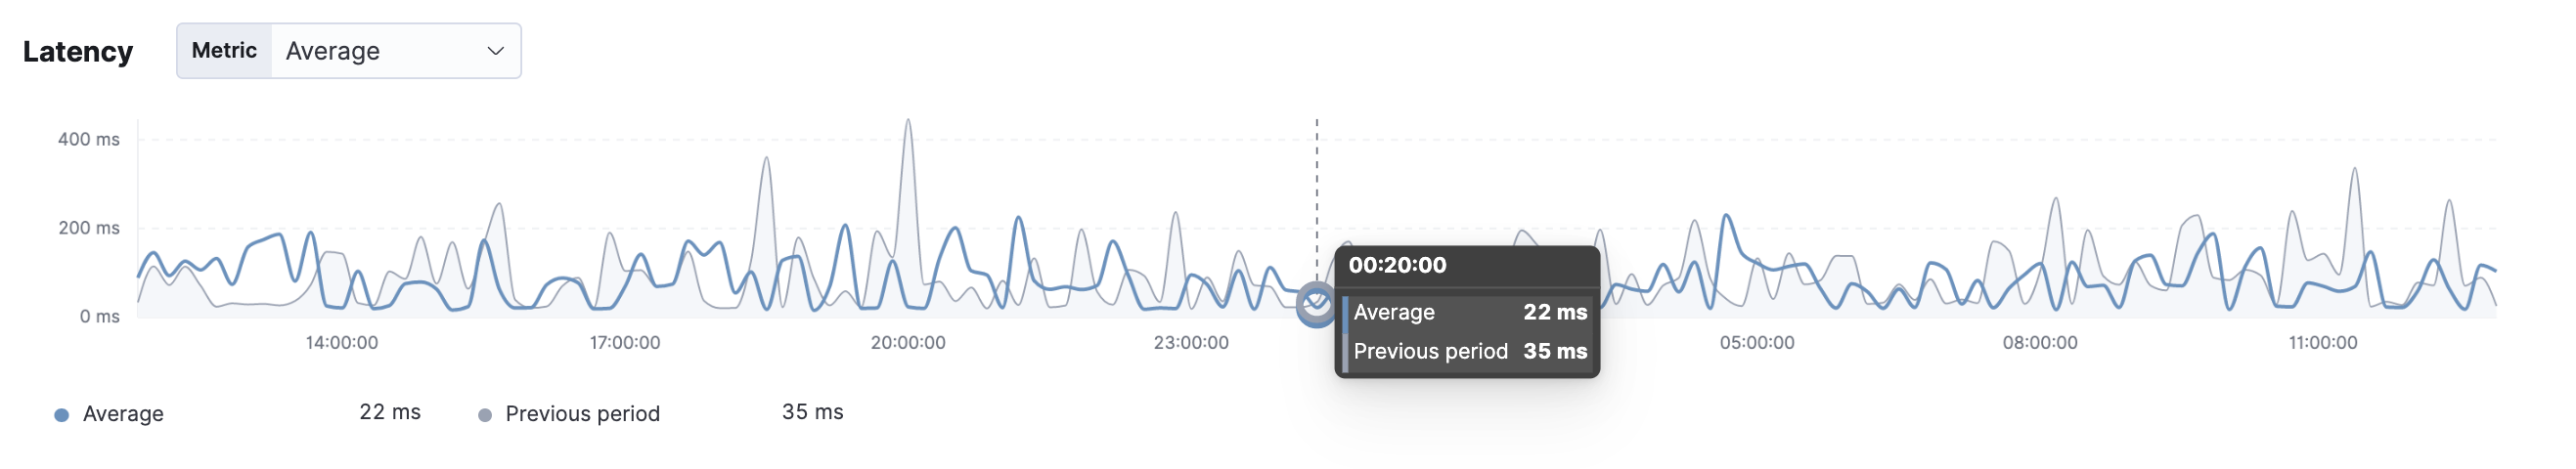
Latency
editResponse times for the service. You can filter the Latency chart to display the average, 95th, or 99th percentile latency times for the service.
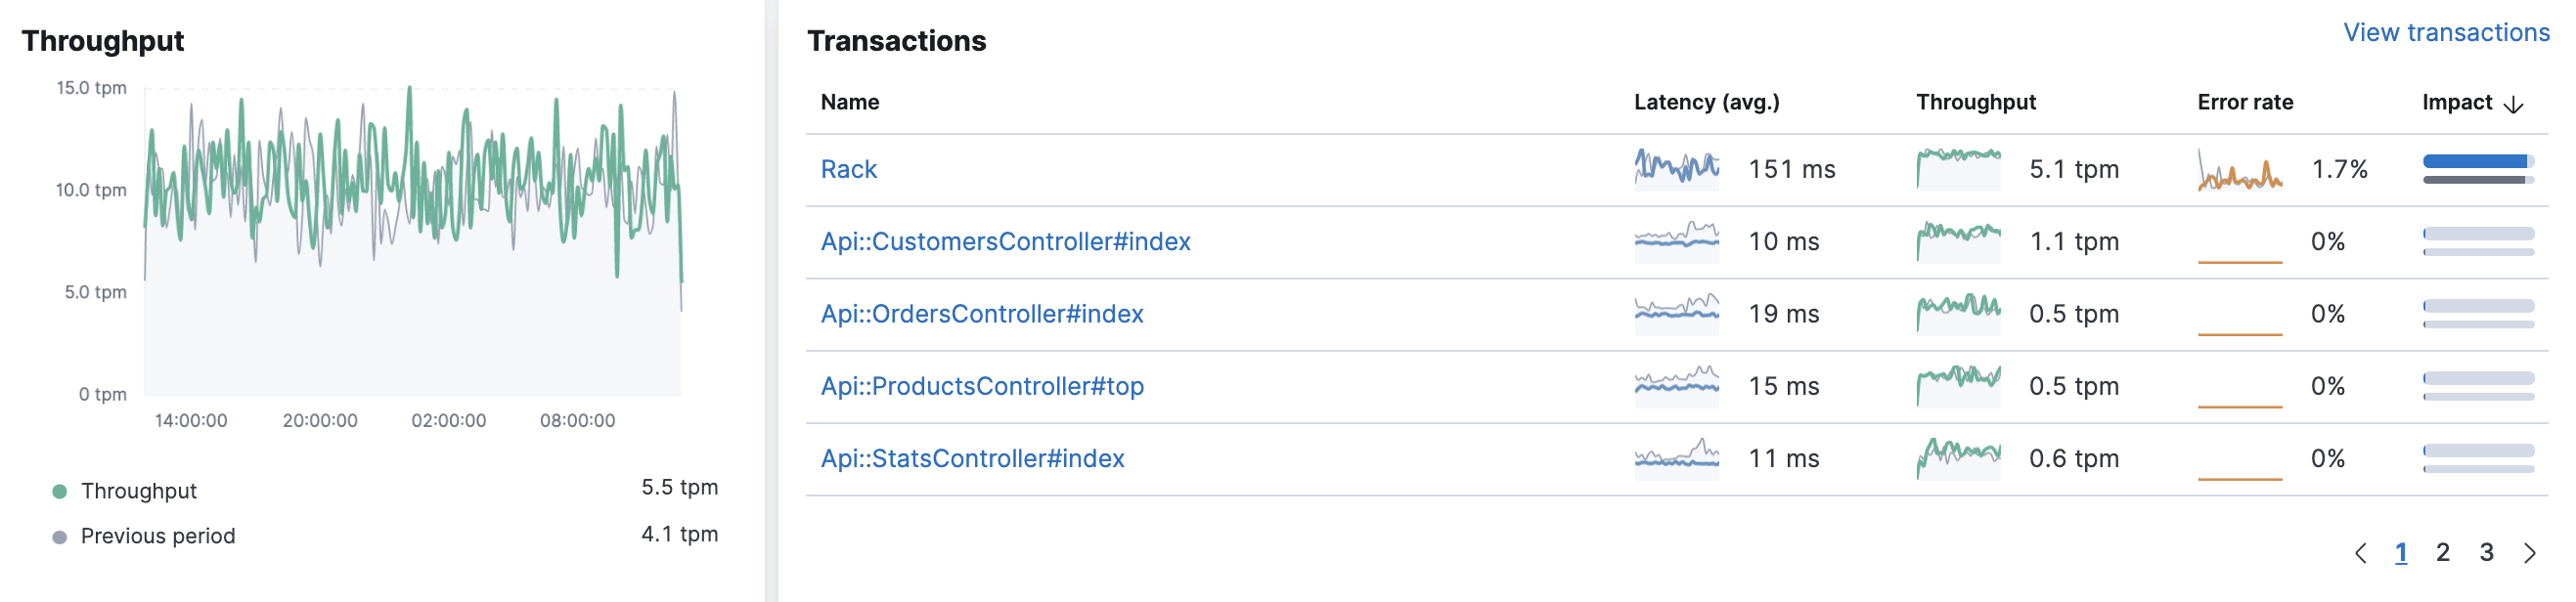
Throughput and transactions
editThe Throughput chart visualizes the average number of transactions per minute for the selected service.
The Transactions table displays a list of transaction groups for the selected service and includes the latency, traffic, error rate, and the impact for each transaction. Transactions that share the same name are grouped, and only one entry is displayed for each group.
By default, transaction groups are sorted by Impact to show the most used and slowest endpoints in your service. If there is a particular endpoint you are interested in, click View transactions to view a list of similar transactions on the transactions overview page.
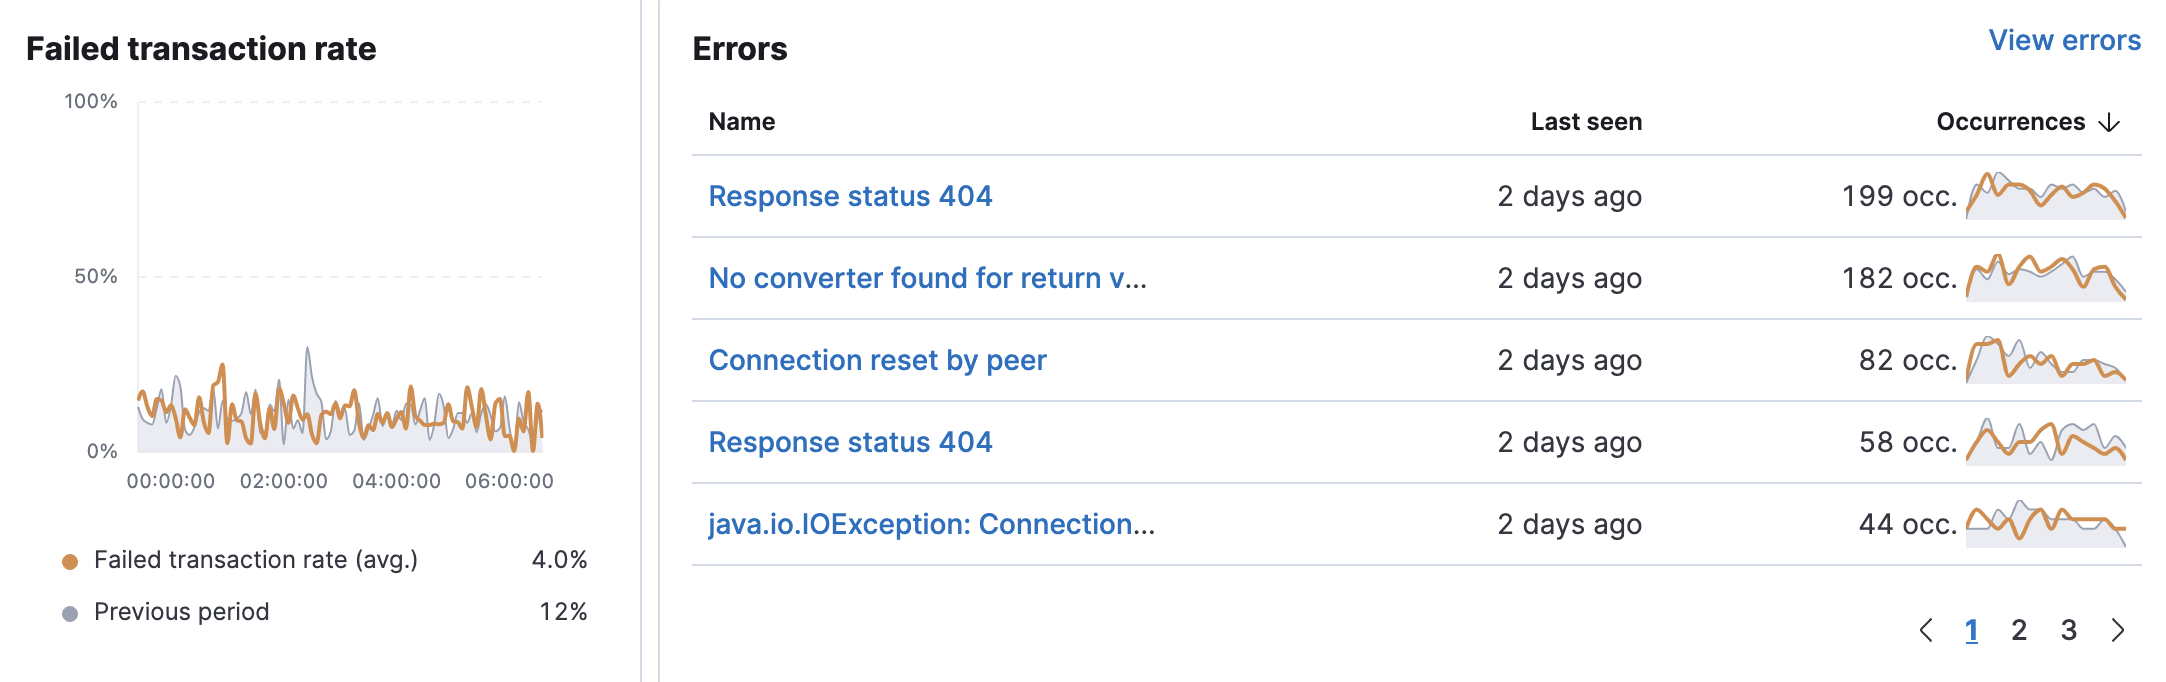
Failed transaction rate and errors
editThe failed transaction rate represents the percentage of failed transactions from the perspective of the selected service. It’s useful for visualizing unexpected increases, decreases, or irregular patterns in a service’s transactions.
HTTP transactions from the HTTP server perspective do not consider a 4xx status code (client error) as a failure
because the failure was caused by the caller, not the HTTP server. Thus, event.outcome=success and there will be no increase in failed transaction rate.
HTTP spans from the client perspective however, are considered failures if the HTTP status code is ≥ 400.
These spans will set event.outcome=failure and increase the failed transaction rate.
If there is no HTTP status, both transactions and spans are considered successful unless an error is reported.
The Errors table provides a high-level view of each error message when it first and last occurred, along with the total number of occurrences. This makes it very easy to quickly see which errors affect your services and take actions to rectify them. To do so, click View errors.
Span types average duration and dependencies
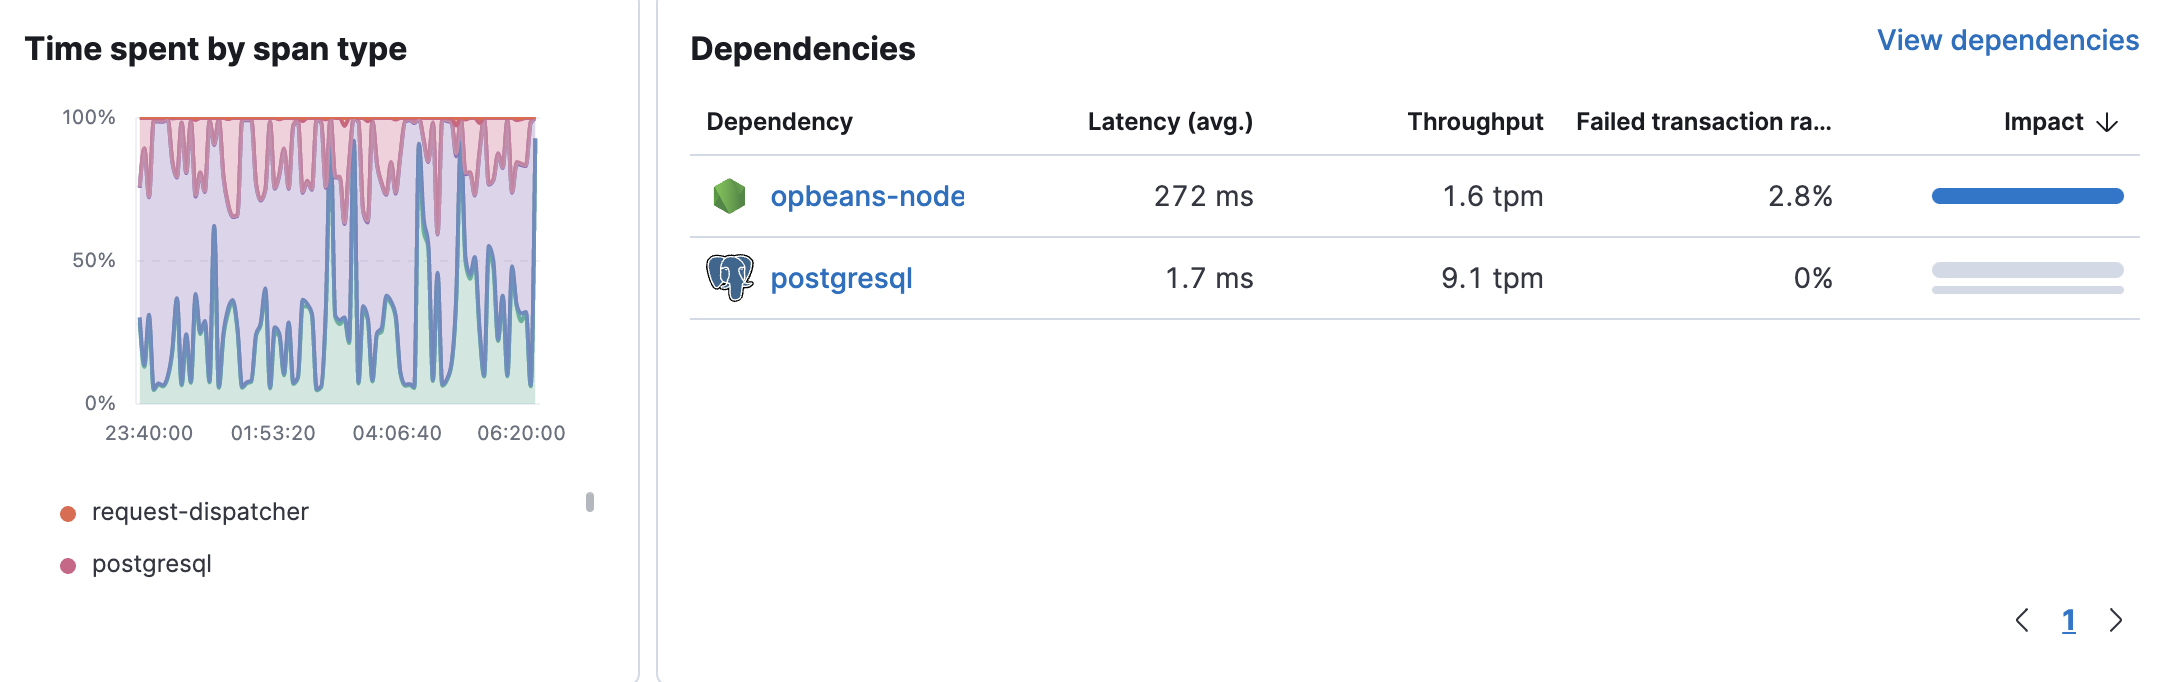
editThe Time spent by span type chart visualizes each span type’s average duration and helps you determine which spans could be slowing down transactions. The "app" label displayed under the chart indicates that something was happening within the application. This could signal that the APM agent does not have auto-instrumentation for whatever was happening during that time or that the time was spent in the application code and not in database or external requests.
The Dependencies table displays a list of downstream services or external connections relevant to the service at the selected time range. The table displays latency, throughput, failed transaction rate, and the impact of each dependency. By default, dependencies are sorted by Impact to show the most used and the slowest dependency. If there is a particular dependency you are interested in, click View dependencies to learn more about it.
Displaying dependencies for services instrumented with the Real User Monitoring (RUM) agent requires an agent version ≥ v5.6.3.
Cold start rate
editThe cold start rate chart is specific to serverless services, and displays the percentage of requests that trigger a cold start of a serverless function. A cold start occurs when a serverless function has not been used for a certain period of time. Analyzing the cold start rate can be useful for deciding how much memory to allocate to a function, or when to remove a large dependency.
The cold start rate chart is currently supported for AWS Lambda functions and Azure functions.
Instances
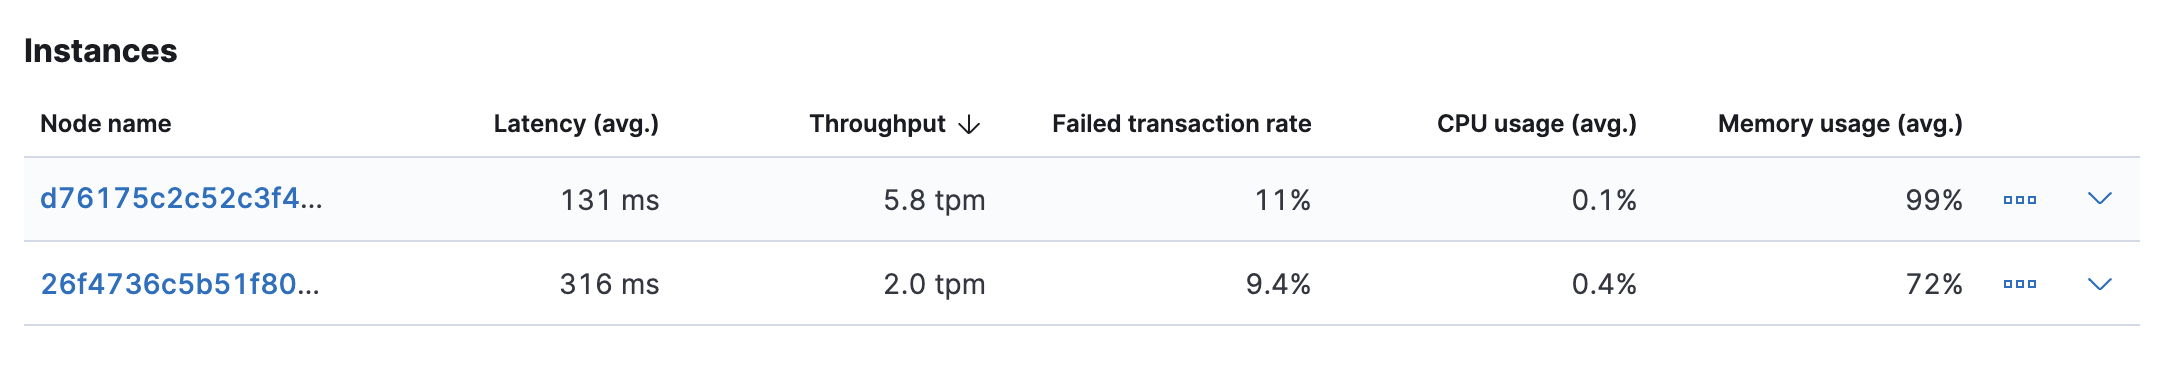
editThe Instances table displays a list of all the available service instances within the selected time range. Depending on how the service runs, the instance could be a host or a container. The table displays latency, throughput, failed transaction, CPU usage, and memory usage for each instance. By default, instances are sorted by Throughput.
Service metadata
editTo view metadata relating to the service agent, and if relevant, the container and cloud provider, click on each icon located at the top of the page beside the service name.
Service information
- Service version
- Runtime name and version
- Framework name
- APM agent name and version
Container information
- Operating system
- Containerized - Yes or no.
- Total number of instances
- Orchestration
Cloud provider information
- Cloud provider
- Cloud service name
- Availability zones
- Machine types
- Project ID
- Region
Serverless information
- Function name(s)
- Event trigger type
Alerts
- Recently fired alerts