- Kibana Guide: other versions:
- What is Kibana?
- What’s new in 8.13
- Kibana concepts
- Quick start
- Set up
- Install Kibana
- Configure Kibana
- Alerting and action settings
- APM settings
- Banners settings
- Cases settings
- Enterprise Search settings
- Fleet settings
- i18n settings
- Logging settings
- Logs settings
- Metrics settings
- Monitoring settings
- Reporting settings
- Search sessions settings
- Secure settings
- Security settings
- Spaces settings
- Task Manager settings
- Telemetry settings
- URL drilldown settings
- Start and stop Kibana
- Access Kibana
- Securing access to Kibana
- Add data
- Upgrade Kibana
- Configure security
- Configure reporting
- Configure logging
- Configure monitoring
- Command line tools
- Production considerations
- Discover
- Dashboard and visualizations
- Canvas
- Maps
- Build a map to compare metrics by country or region
- Track, visualize, and alert on assets in real time
- Map custom regions with reverse geocoding
- Heat map layer
- Tile layer
- Vector layer
- Plot big data
- Search geographic data
- Configure map settings
- Connect to Elastic Maps Service
- Import geospatial data
- Troubleshoot
- Reporting and sharing
- Machine learning
- Graph
- Alerting
- Observability
- APM
- Set up
- Get started
- How-to guides
- Configure APM agents with central config
- Control access to APM data
- Create an alert
- Create custom links
- Filter data
- Find transaction latency and failure correlations
- Identify deployment details for APM agents
- Integrate with machine learning
- Exploring mobile sessions with Discover
- Viewing sessions with Discover
- Observe Lambda functions
- Query your data
- Storage Explorer
- Track deployments with annotations
- Users and privileges
- Settings
- REST API
- Troubleshooting
- Security
- Dev Tools
- Fleet
- Osquery
- Stack Monitoring
- Stack Management
- REST API
- Get features API
- Kibana spaces APIs
- Kibana role management APIs
- User session management APIs
- Saved objects APIs
- Data views API
- Get all data views
- Get data view
- Create data view
- Update data view
- Delete data view
- Swap references preview
- Swap references
- Get default data view
- Set default data view
- Update data view fields metadata
- Get runtime field
- Create runtime field
- Upsert runtime field
- Update runtime field
- Delete runtime field
- Index patterns APIs
- Alerting APIs
- Action and connector APIs
- Cases APIs
- Add comment
- Create case
- Delete cases
- Delete comments
- Find case activity
- Find cases
- Find connectors
- Get alerts
- Get case activity
- Get case
- Get case status
- Get cases by alert
- Get comments
- Get configuration
- Get reporters
- Get tags
- Push case
- Set configuration
- Update cases
- Update comment
- Update configuration
- Import and export dashboard APIs
- Logstash configuration management APIs
- Machine learning APIs
- Osquery manager API
- Short URLs APIs
- Get Task Manager health
- Upgrade assistant APIs
- Synthetics APIs
- Uptime APIs
- Kibana plugins
- Troubleshooting
- Accessibility
- Release notes
- Kibana 8.13.4
- Kibana 8.13.3
- Kibana 8.13.2
- Kibana 8.13.1
- Kibana 8.13.0
- Kibana 8.12.2
- Kibana 8.12.1
- Kibana 8.12.0
- Kibana 8.11.4
- Kibana 8.11.3
- Kibana 8.11.2
- Kibana 8.11.1
- Kibana 8.11.0
- Kibana 8.10.4
- Kibana 8.10.3
- Kibana 8.10.2
- Kibana 8.10.1
- Kibana 8.10.0
- Kibana 8.9.2
- Kibana 8.9.1
- Kibana 8.9.0
- Kibana 8.8.2
- Kibana 8.8.1
- Kibana 8.8.0
- Kibana 8.7.1
- Kibana 8.7.0
- Kibana 8.6.1
- Kibana 8.6.0
- Kibana 8.5.2
- Kibana 8.5.1
- Kibana 8.5.0
- Kibana 8.4.3
- Kibana 8.4.2
- Kibana 8.4.1
- Kibana 8.4.0
- Kibana 8.3.3
- Kibana 8.3.2
- Kibana 8.3.1
- Kibana 8.3.0
- Kibana 8.2.3
- Kibana 8.2.2
- Kibana 8.2.1
- Kibana 8.2.0
- Kibana 8.1.3
- Kibana 8.1.2
- Kibana 8.1.1
- Kibana 8.1.0
- Kibana 8.0.0
- Kibana 8.0.0-rc2
- Kibana 8.0.0-rc1
- Kibana 8.0.0-beta1
- Kibana 8.0.0-alpha2
- Kibana 8.0.0-alpha1
- Developer guide
Services
editServices
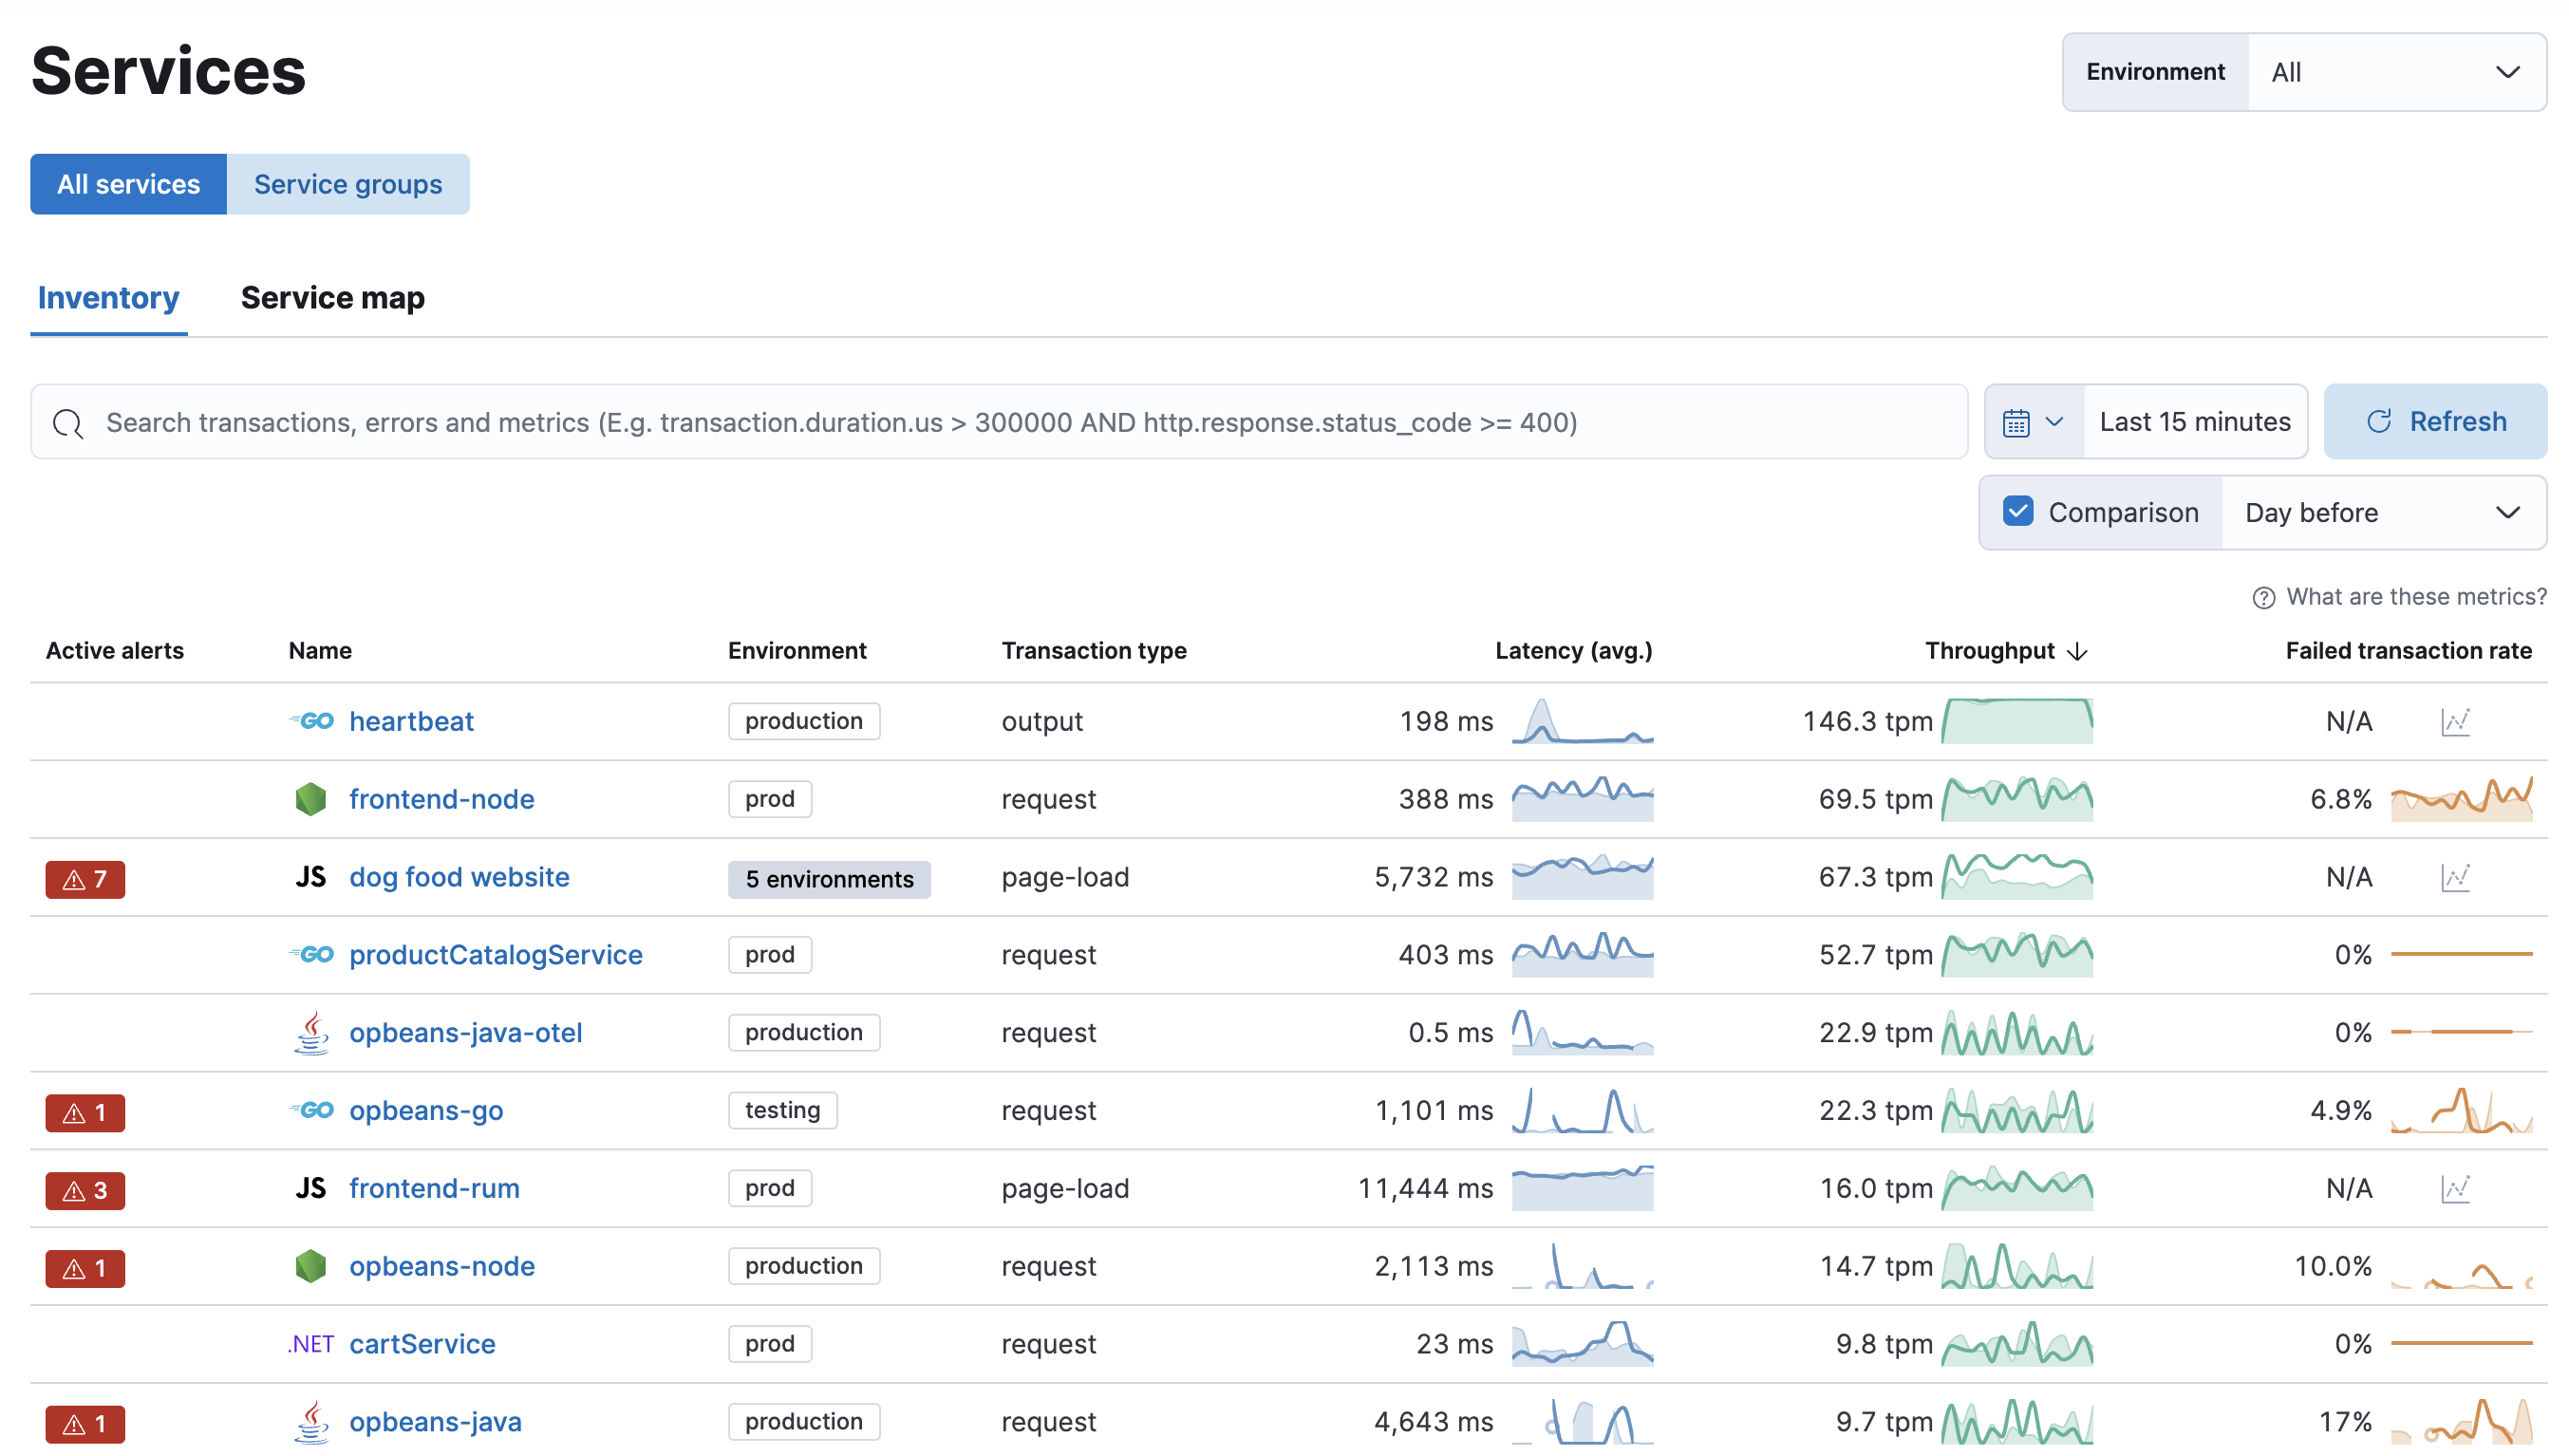
editService inventory provides a quick, high-level overview of the health and general performance of all instrumented services.
To help surface potential issues, services are sorted by their health status: critical > warning > healthy > unknown. Health status is powered by machine learning and requires anomaly detection to be enabled.
In addition to health status, active alerts for each service are prominently displayed in the service inventory table. Selecting an active alert badge brings you to the Alerts tab where you can learn more about the active alert and take action.
Service groups
editThis functionality is in beta and is subject to change. The design and code is less mature than official GA features and is being provided as-is with no warranties. Beta features are not subject to the support SLA of official GA features.
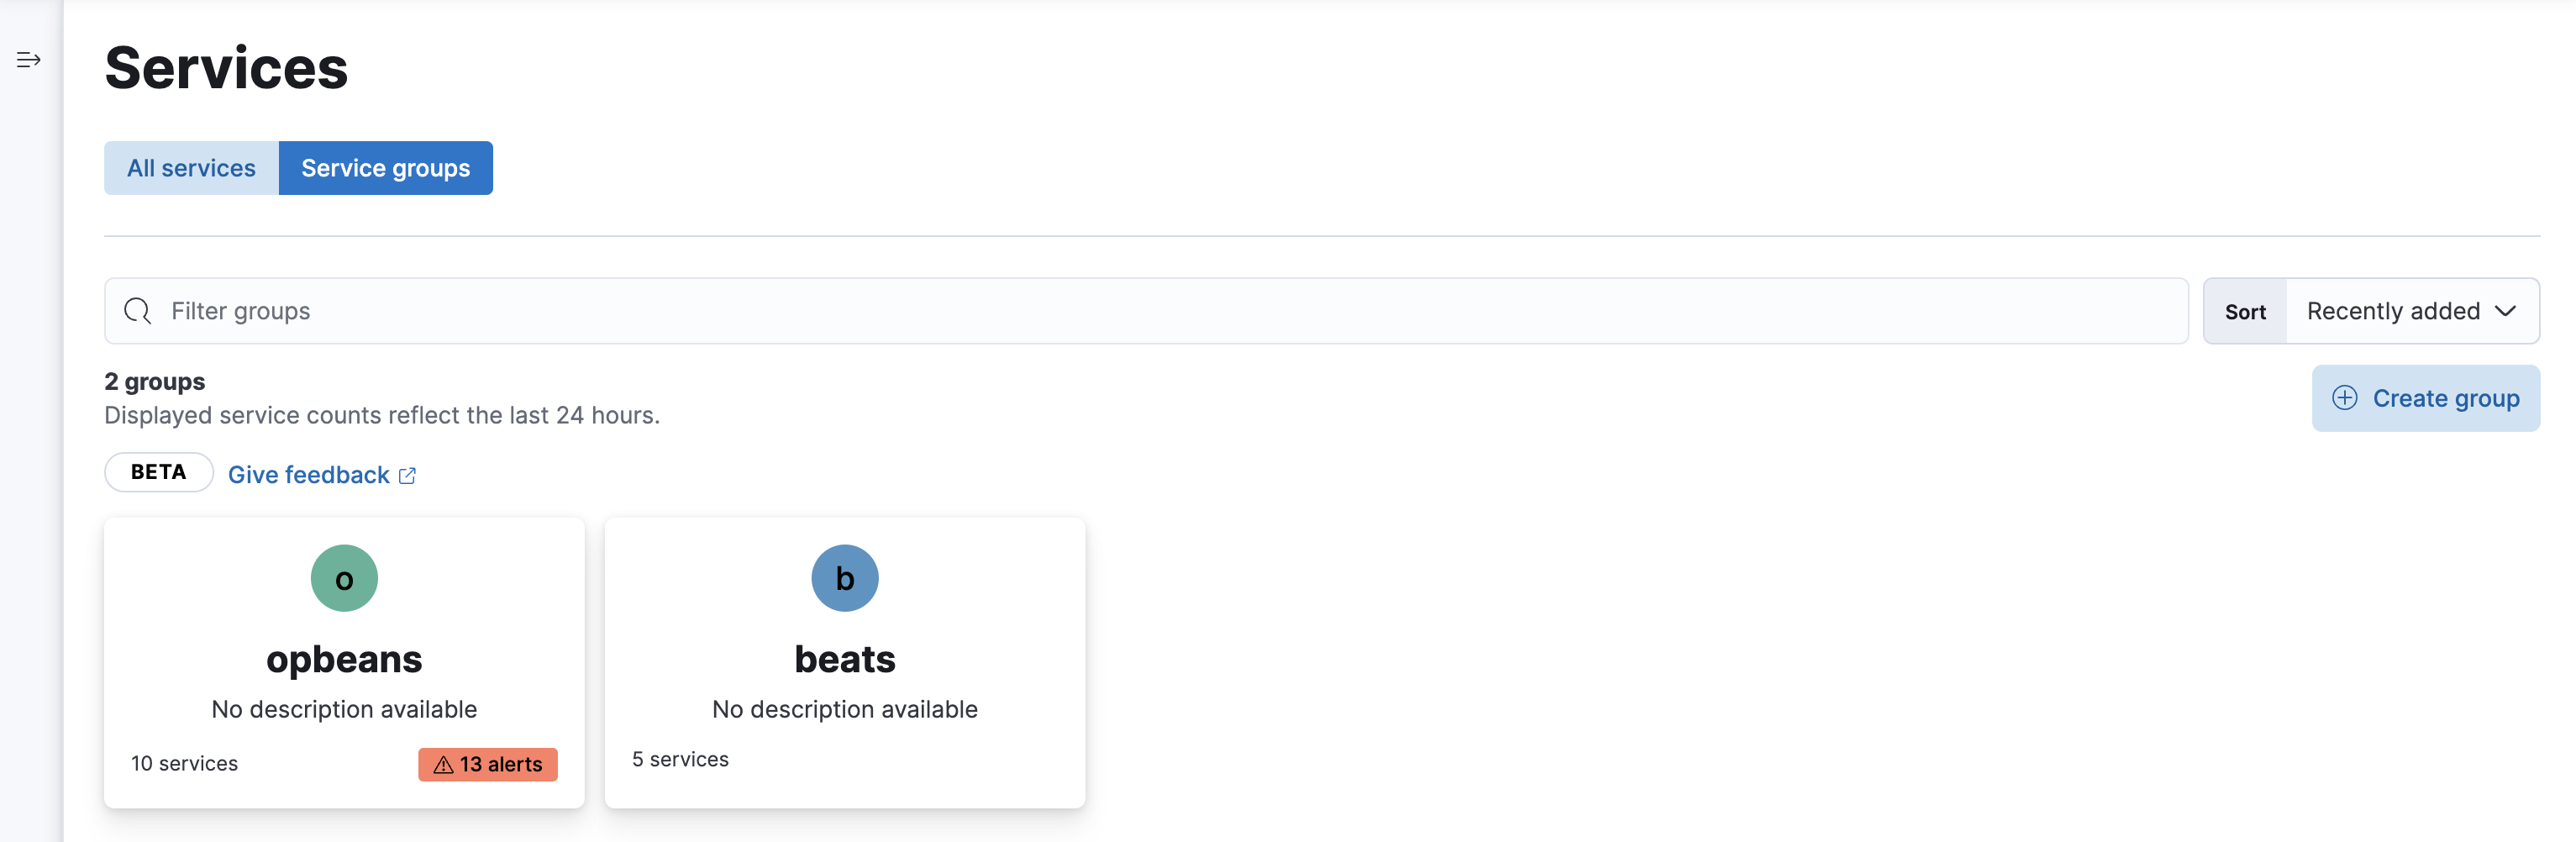
Group services together to build meaningful views that remove noise, simplify investigations across services, and combine related alerts. Service groups are Kibana space-specific and available for any users with appropriate access.
To enable Service groups, open Kibana and navigate to Stack Management > Advanced Settings > Observability, and enable the Service groups feature.
To create a service group:
- Navigate to Observability > APM > Services.
- Switch to Service groups.
- Click Create group.
- Specify a name, color, and description.
- Click Select services.
- Specify a Kibana Query Language (KQL) query to select services for the group. Services that match the query within the last 24 hours will be assigned to the group.
Once a service group has been saved, this list of services within it is static. If a newly added service matches the KQL query, it will not be automatically added to the service group. Similarly, if a service stops matching the KQL query, it will not be removed from the group.
To update the list of services within a group, edit the service group, click Refresh next to the KQL query, and click Save group.
Examples
Not sure where to get started? Here are some sample queries you can build from:
-
Group services by environment—in this example, "production":
service.environment : "production"
-
Group services by name—this example groups those that end in "beat":
service.name : *beat
(matches services named "Auditbeat", "Heartbeat", "Filebeat", etc.)
On this page