What’s new in 7.16
editWhat’s new in 7.16
editHere are the highlights of what’s new and improved in 7.16. For detailed information about this release, check out the release notes.
Other versions: 7.15 | 7.14 | 7.13 | 7.12 | 7.11 | 7.10 | 7.9 | 7.8 | 7.7 | 7.6 | 7.5 | 7.4 | 7.3 | 7.2 | 7.1 | 7.0
Upgrade Assistant for 8.x
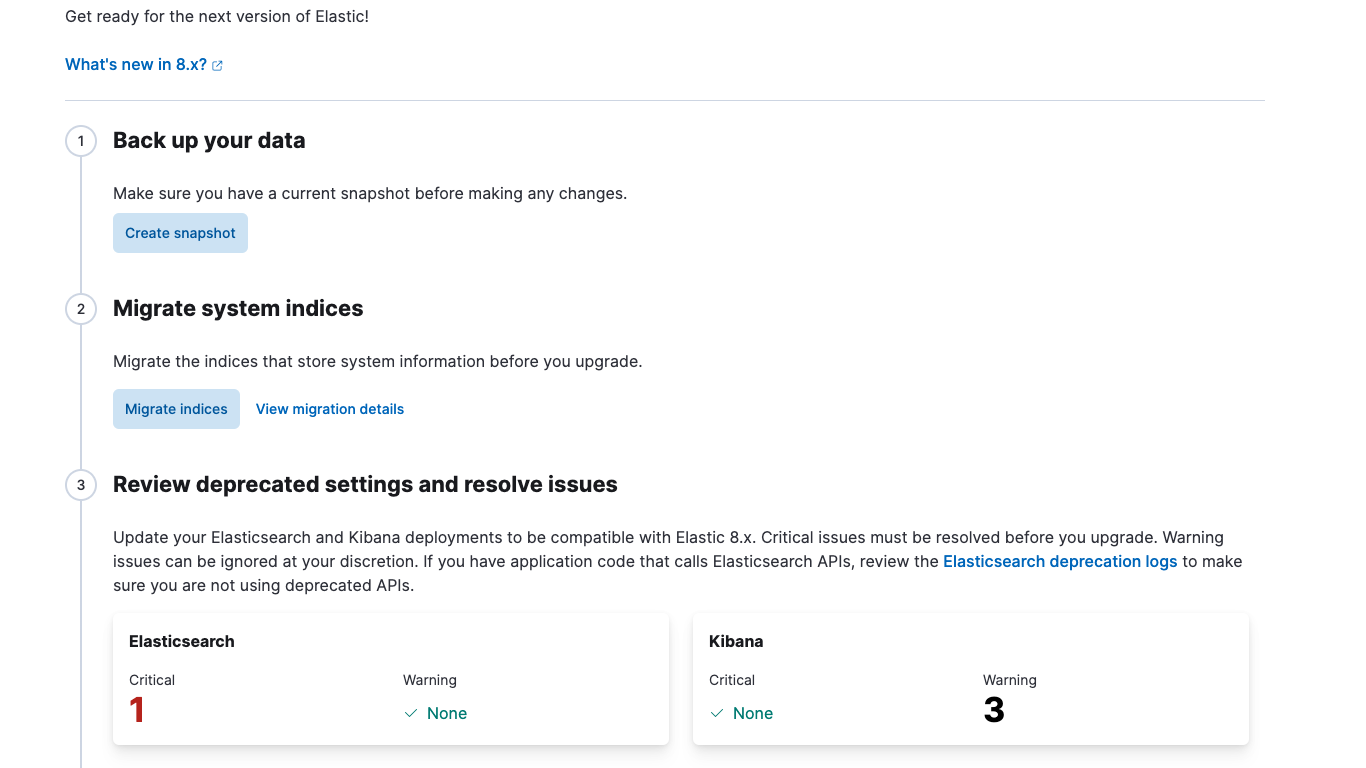
editUpgrade Assistant is your one-stop shop to help you prepare for upgrading to 8.x. Review and address Elasticsearch and Kibana deprecation issues, analyze Elasticsearch deprecation logs, migrate system indices, and back up your data before upgrading, all from this app.
Unified integrations view
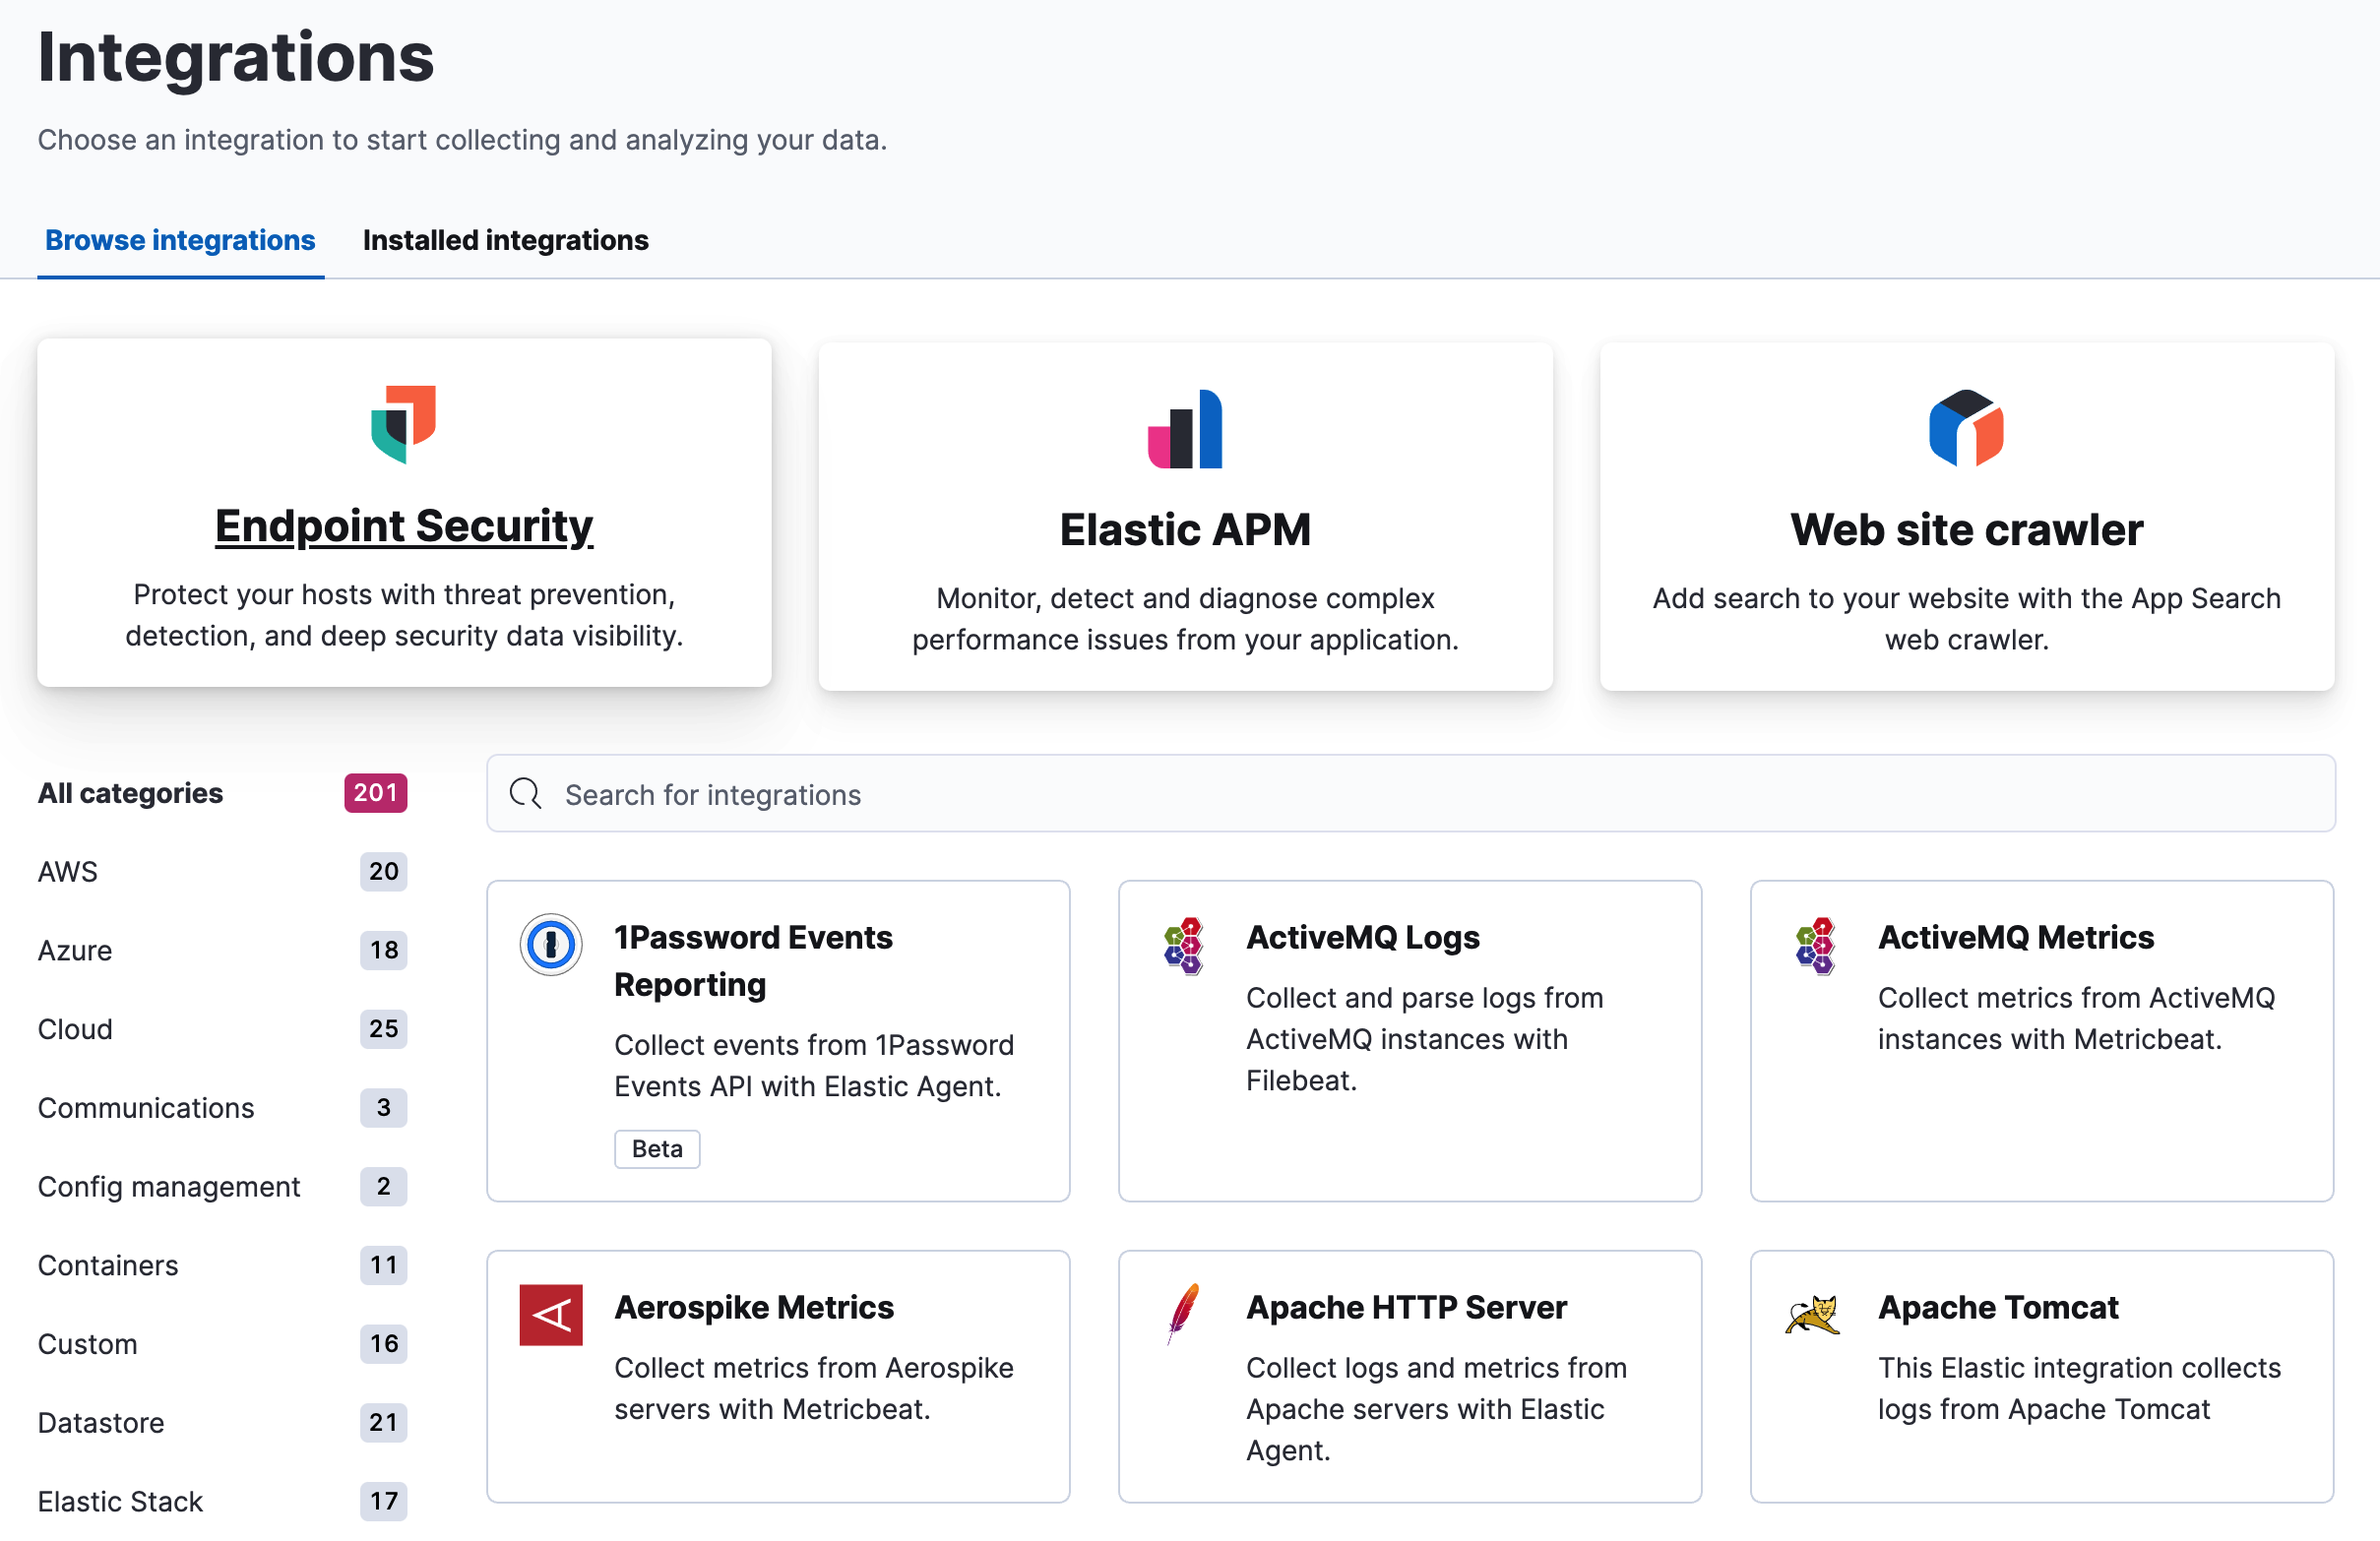
editAll ingest options for Elastic have been moved to a single Integrations view. This provides a more consistent experience for onboarding to Elastic and increases the discoverability of integrations. All entry points for adding integrations now route to this page.
Reference lines in Lens
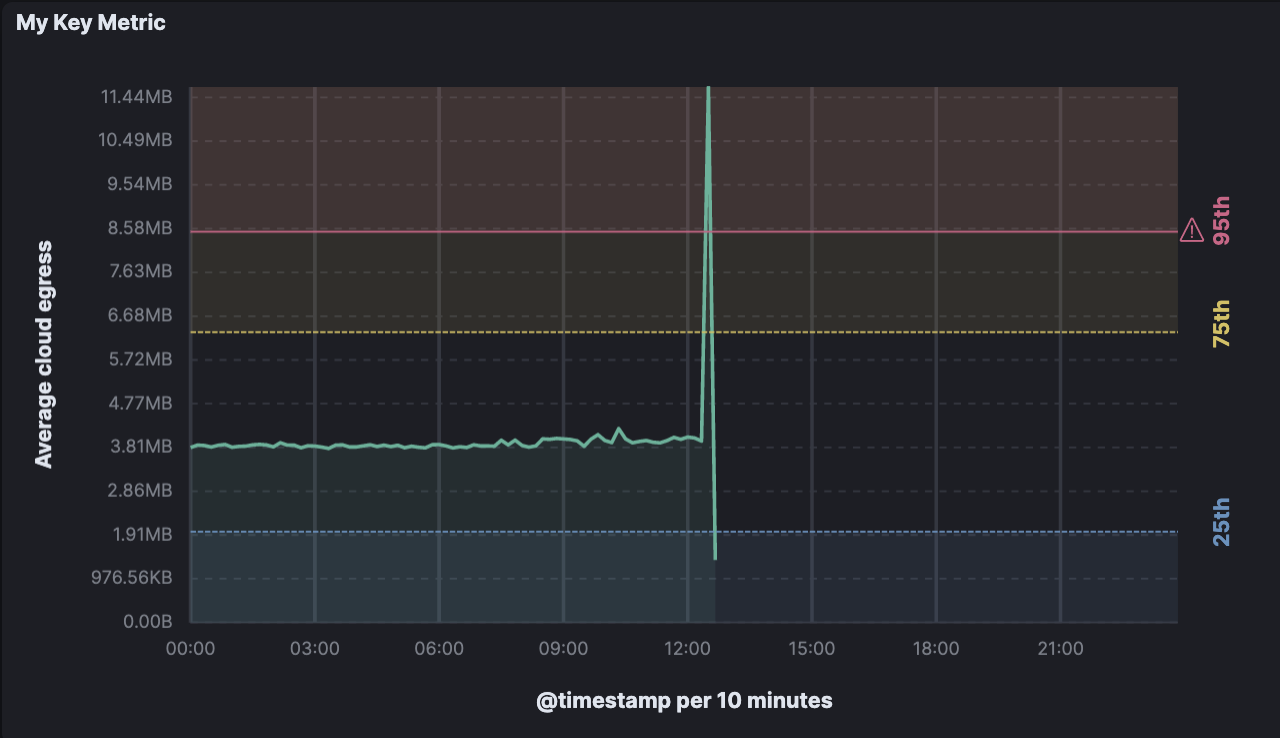
editReference lines are now available in Lens to help you easily identify important values in your visualizations. Create reference lines with static values, dynamic data using Elasticsearch Quick Functions, or define with a custom Formula. Reference lines can come from separate index patterns, such as a goal dataset that is independent of the source data.
With reference lines, you can:
- Track metrics against goals, warning zones, and more.
- Add display options, such as color, icons, and labels.
-
Apply color to the area above or below the reference line.
Enhancements to visualization editors
editKibana offers even more ways to work with your visualizations:
- Apply custom field formats in TSVB. Take advantage of the field formatters from your index pattern in TSVB—or override the format for a specific visualization.
- Filter in TSVB. You always had the ability to ignore global filters in TSVB layers, and now you can also change them. This makes it easier to explore your data in TSVB without having to edit the filters for each series.
- View data and requests in Lens. View the data in visualizations and the requests that collected the data right in the Lens editor.
- View requests in Console. View the requests that collect the data in visualizations in Console.
- Auto fit rows to content. Automatically resize Aggregation-based data table rows so that text and images are fully visible.
New and updated connectors in Alerting
editAlerting has grown its collection of connectors with the addition of the ServiceNow ITOM connector, which allows for easy integration with ServiceNow event management. In addition, Kibana provides a more efficient integration for ServiceNow ITSM and SecOps connectors with certified applications on the ServiceNow store. Also added is the ability to authenticate the email connector with OAuth 2.0 Client Credentials for the MS Exchange email service.
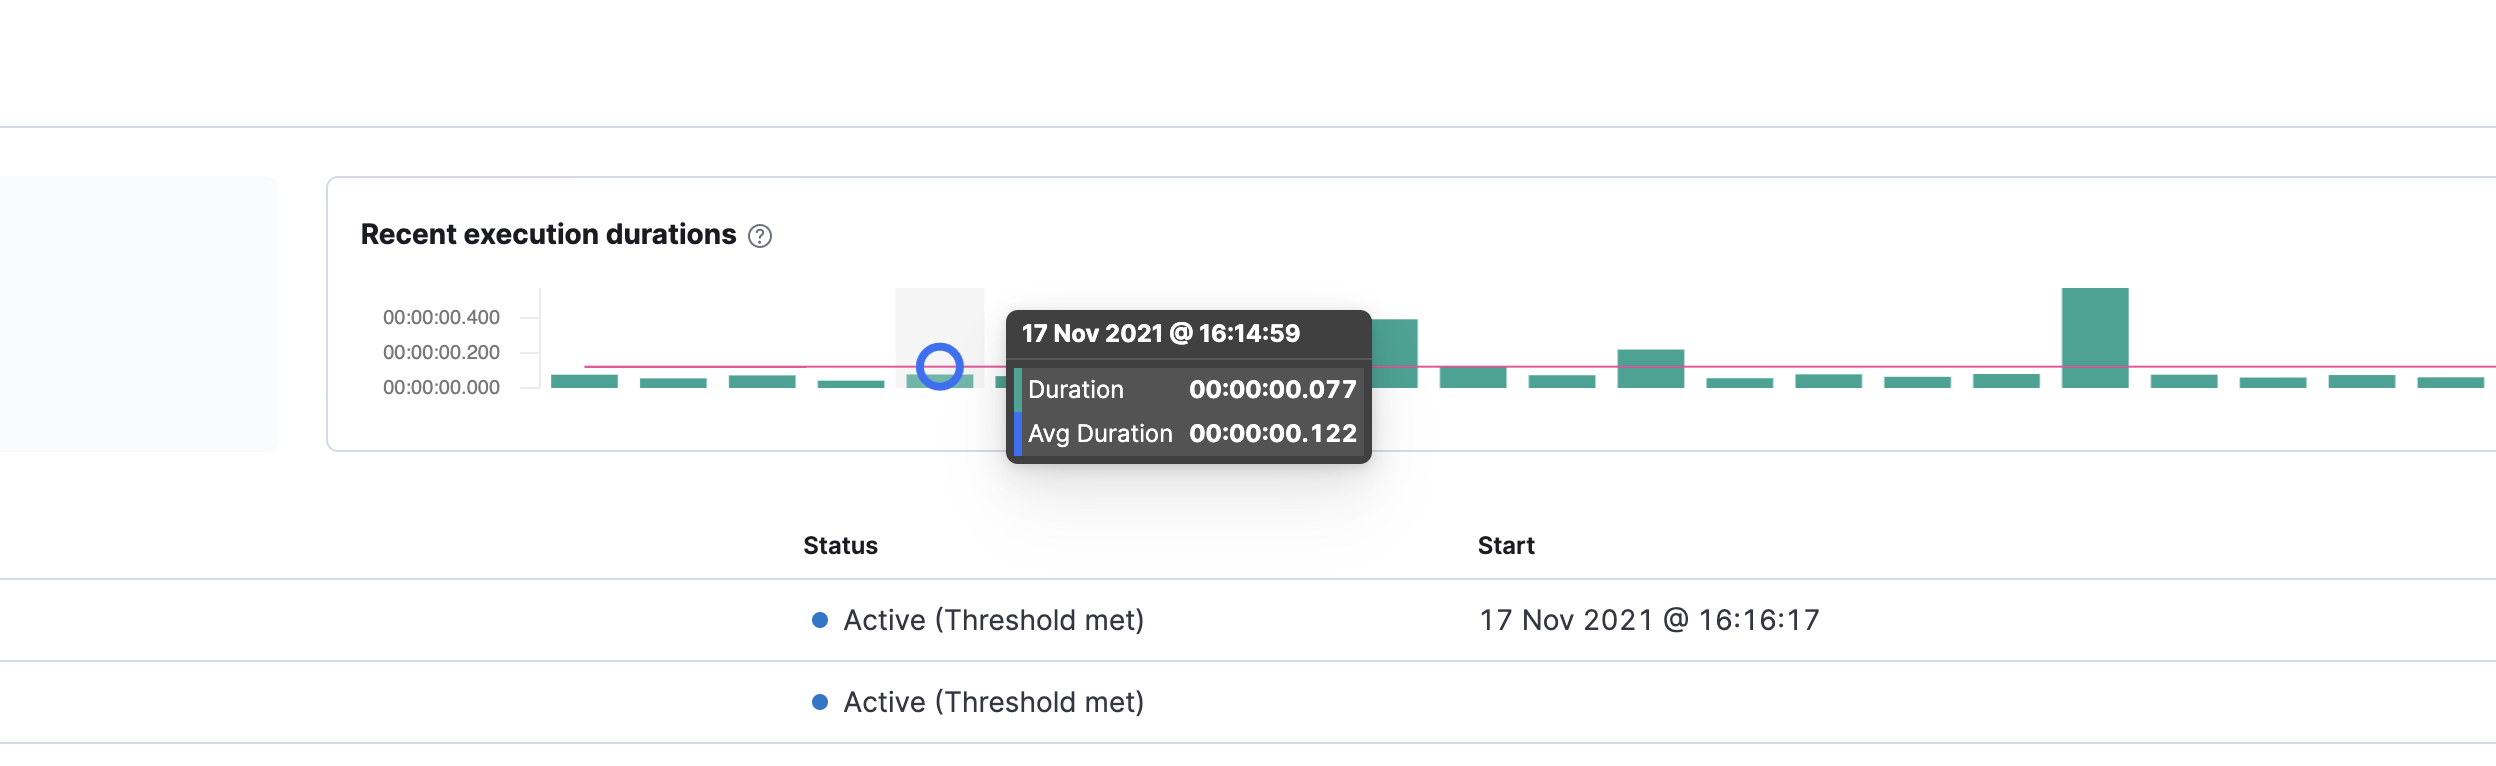
Rule duration on display
editIn Rules and Connectors, the Rules view now includes the rule duration field, which shows how long a rule is taking to complete execution. This helps you identify rules that run longer than you anticipate.
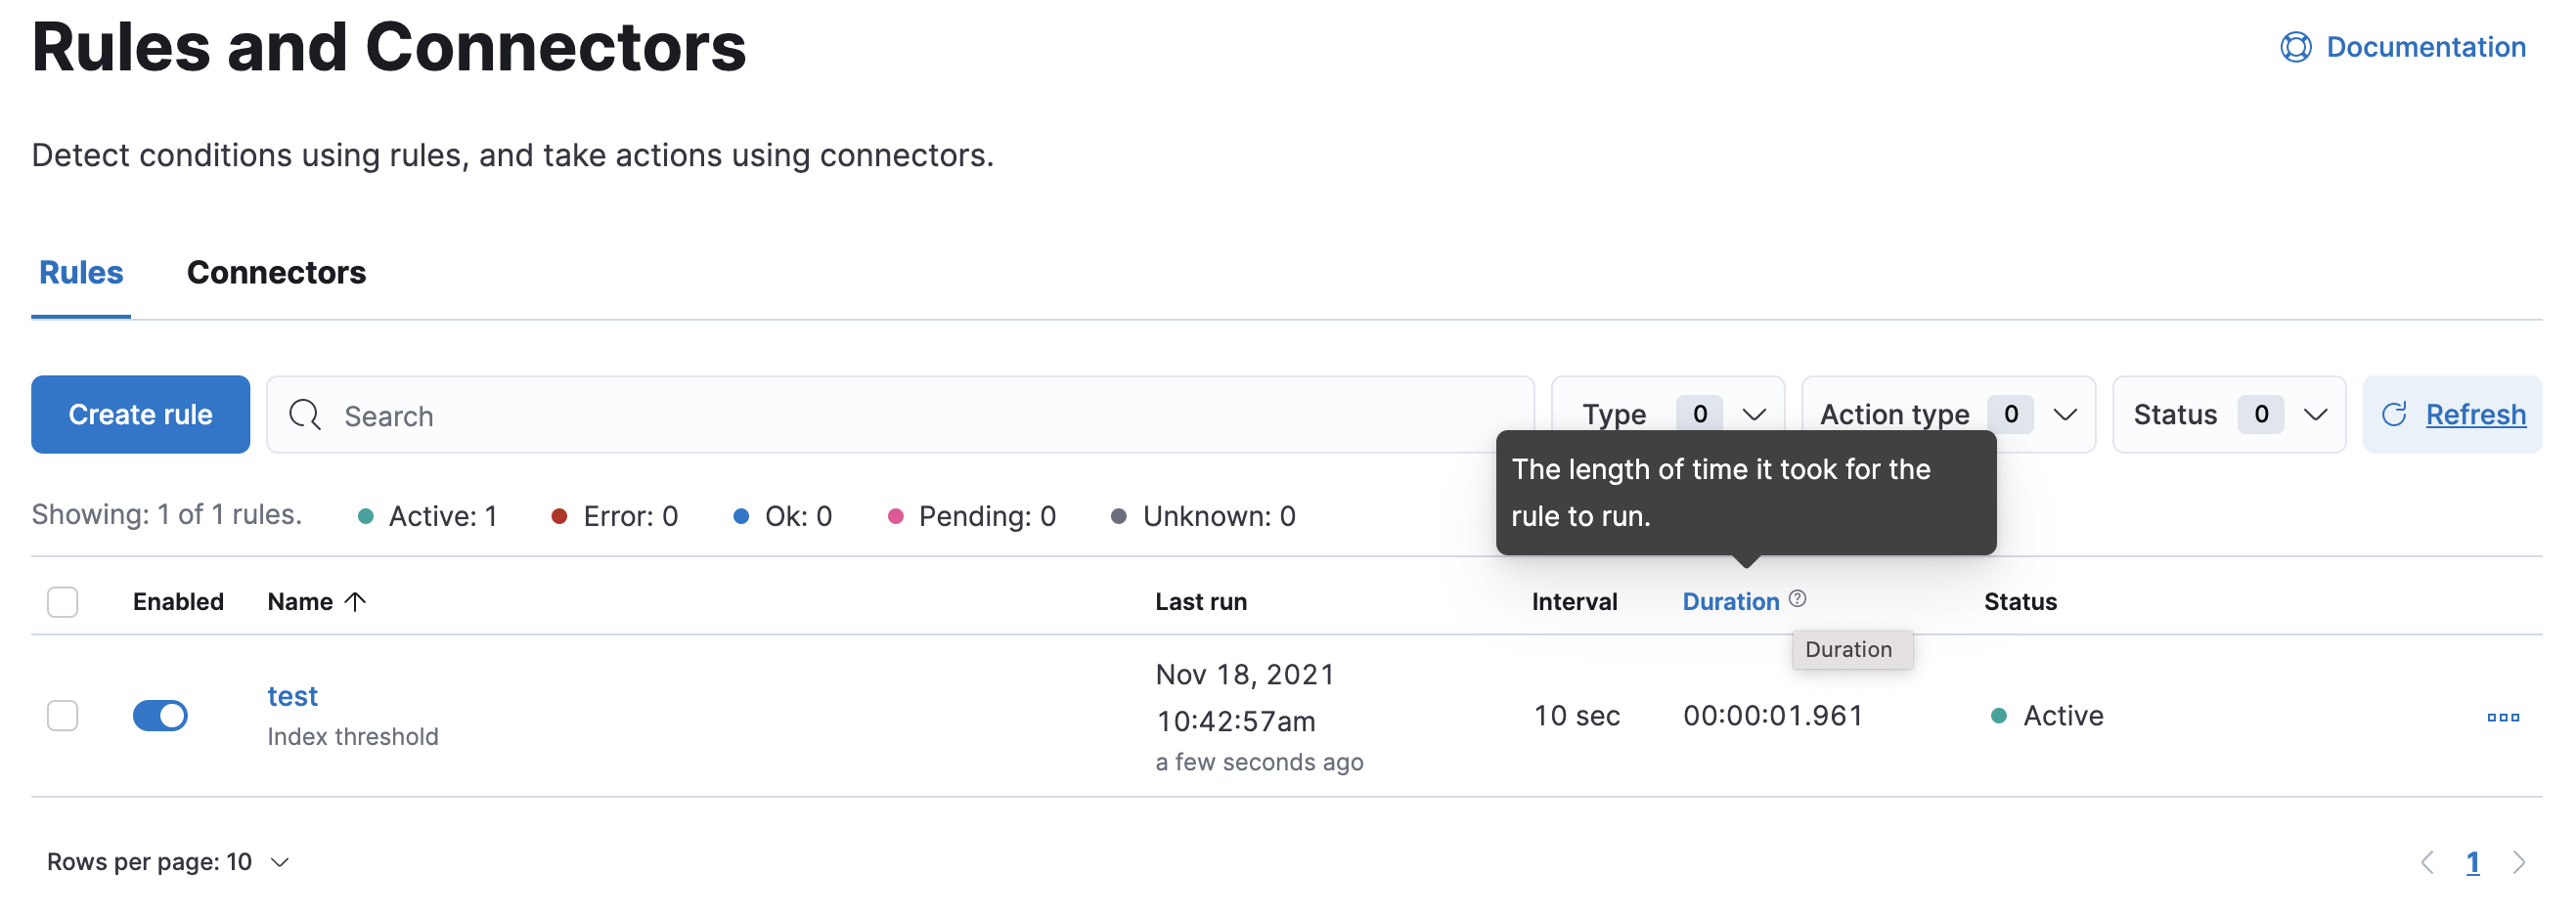
You can observe the duration for the last 30 executions on the rules detail page.
Osquery Manager now generally available
editWith the GA release, Osquery Manager is now fully supported and available for use in production. In addition, the 7.16 release offers the following new capabilities:
- Customize the osquery configuration.
- Map saved query results to ECS.
- Test out queries when editing saved queries.
- Map static values to ECS.
- Schedule query packs for one or more agent policies.
- Set custom namespace values for the integration.
- Query three new Kubernetes tables.
For more information, refer to Osquery.
Transform health alerting rules
edit[beta] This functionality is in beta and is subject to change. The design and code is less mature than official GA features and is being provided as-is with no warranties. Beta features are not subject to the support SLA of official GA features. A new rule type notifies you when continuous transforms experience operational issues. It enables you to detect when a transform stops indexing data or is in a failed state. For more details, refer to Generating alerts for transforms.