- Metricbeat Reference: other versions:
- Metricbeat overview
- Quick start: installation and configuration
- Set up and run
- Upgrade Metricbeat
- How Metricbeat works
- Configure
- Modules
- General settings
- Project paths
- Config file loading
- Output
- Kerberos
- SSL
- Index lifecycle management (ILM)
- Elasticsearch index template
- Kibana endpoint
- Kibana dashboards
- Processors
- Define processors
- add_cloud_metadata
- add_cloudfoundry_metadata
- add_docker_metadata
- add_fields
- add_host_metadata
- add_id
- add_kubernetes_metadata
- add_labels
- add_locale
- add_network_direction
- add_nomad_metadata
- add_observer_metadata
- add_process_metadata
- add_tags
- community_id
- convert
- copy_fields
- decode_base64_field
- decode_json_fields
- decode_xml
- decode_xml_wineventlog
- decompress_gzip_field
- detect_mime_type
- dissect
- dns
- drop_event
- drop_fields
- extract_array
- fingerprint
- include_fields
- rate_limit
- registered_domain
- rename
- script
- syslog
- translate_sid
- truncate_fields
- urldecode
- Autodiscover
- Internal queue
- Logging
- HTTP endpoint
- Regular expression support
- Instrumentation
- metricbeat.reference.yml
- How to guides
- Modules
- ActiveMQ module
- Aerospike module
- Airflow module
- Apache module
- AWS module
- AWS billing metricset
- AWS cloudwatch metricset
- AWS dynamodb metricset
- AWS ebs metricset
- AWS ec2 metricset
- AWS elb metricset
- AWS kinesis metricset
- AWS lambda metricset
- AWS natgateway metricset
- AWS rds metricset
- AWS s3_daily_storage metricset
- AWS s3_request metricset
- AWS sns metricset
- AWS sqs metricset
- AWS transitgateway metricset
- AWS usage metricset
- AWS vpn metricset
- AWS Fargate module
- Azure module
- Azure app_insights metricset
- Azure app_state metricset
- Azure billing metricset
- Azure compute_vm metricset
- Azure compute_vm_scaleset metricset
- Azure container_instance metricset
- Azure container_registry metricset
- Azure container_service metricset
- Azure database_account metricset
- Azure monitor metricset
- Azure storage metricset
- Beat module
- Ceph module
- Ceph cluster_disk metricset
- Ceph cluster_health metricset
- Ceph cluster_status metricset
- Ceph mgr_cluster_disk metricset
- Ceph mgr_cluster_health metricset
- Ceph mgr_osd_perf metricset
- Ceph mgr_osd_pool_stats metricset
- Ceph mgr_osd_tree metricset
- Ceph mgr_pool_disk metricset
- Ceph monitor_health metricset
- Ceph osd_df metricset
- Ceph osd_tree metricset
- Ceph pool_disk metricset
- Cloudfoundry module
- CockroachDB module
- Consul module
- Containerd module
- Coredns module
- Couchbase module
- CouchDB module
- Docker module
- Dropwizard module
- Elasticsearch module
- Elasticsearch ccr metricset
- Elasticsearch cluster_stats metricset
- Elasticsearch enrich metricset
- Elasticsearch index metricset
- Elasticsearch index_recovery metricset
- Elasticsearch index_summary metricset
- Elasticsearch ml_job metricset
- Elasticsearch node metricset
- Elasticsearch node_stats metricset
- Elasticsearch pending_tasks metricset
- Elasticsearch shard metricset
- Enterprise Search module
- Envoyproxy module
- Etcd module
- Google Cloud Platform module
- Google Cloud Platform billing metricset
- Google Cloud Platform compute metricset
- Google Cloud Platform dataproc metricset
- Google Cloud Platform firestore metricset
- Google Cloud Platform gke metricset
- Google Cloud Platform loadbalancing metricset
- Google Cloud Platform metrics metricset
- Google Cloud Platform pubsub metricset
- Google Cloud Platform storage metricset
- Golang module
- Graphite module
- HAProxy module
- HTTP module
- IBM MQ module
- IIS module
- Istio module
- Jolokia module
- Kafka module
- Kibana module
- Kubernetes module
- Kubernetes apiserver metricset
- Kubernetes container metricset
- Kubernetes controllermanager metricset
- Kubernetes event metricset
- Kubernetes node metricset
- Kubernetes pod metricset
- Kubernetes proxy metricset
- Kubernetes scheduler metricset
- Kubernetes state_container metricset
- Kubernetes state_cronjob metricset
- Kubernetes state_daemonset metricset
- Kubernetes state_deployment metricset
- Kubernetes state_job metricset
- Kubernetes state_node metricset
- Kubernetes state_persistentvolumeclaim metricset
- Kubernetes state_pod metricset
- Kubernetes state_replicaset metricset
- Kubernetes state_resourcequota metricset
- Kubernetes state_service metricset
- Kubernetes state_statefulset metricset
- Kubernetes state_storageclass metricset
- Kubernetes system metricset
- Kubernetes volume metricset
- KVM module
- Linux module
- Logstash module
- Memcached module
- MongoDB module
- MSSQL module
- Munin module
- MySQL module
- NATS module
- Nginx module
- Openmetrics module
- Oracle module
- PHP_FPM module
- PostgreSQL module
- Prometheus module
- RabbitMQ module
- Redis module
- Redis Enterprise module
- SQL module
- Stan module
- Statsd module
- SyncGateway module
- System module
- System core metricset
- System cpu metricset
- System diskio metricset
- System entropy metricset
- System filesystem metricset
- System fsstat metricset
- System load metricset
- System memory metricset
- System network metricset
- System network_summary metricset
- System process metricset
- System process_summary metricset
- System raid metricset
- System service metricset
- System socket metricset
- System socket_summary metricset
- System uptime metricset
- System users metricset
- Tomcat module
- Traefik module
- uWSGI module
- vSphere module
- Windows module
- ZooKeeper module
- Exported fields
- ActiveMQ fields
- Aerospike fields
- Airflow fields
- Apache fields
- AWS fields
- AWS Fargate fields
- Azure fields
- Beat fields
- Beat fields
- Ceph fields
- Cloud provider metadata fields
- Cloudfoundry fields
- CockroachDB fields
- Common fields
- Consul fields
- Containerd fields
- Coredns fields
- Couchbase fields
- CouchDB fields
- Docker fields
- Docker fields
- Dropwizard fields
- ECS fields
- Elasticsearch fields
- Enterprise Search fields
- Envoyproxy fields
- Etcd fields
- Google Cloud Platform fields
- Golang fields
- Graphite fields
- HAProxy fields
- Host fields
- HTTP fields
- IBM MQ fields
- IIS fields
- Istio fields
- Jolokia fields
- Jolokia Discovery autodiscover provider fields
- Kafka fields
- Kibana fields
- Kubernetes fields
- Kubernetes fields
- KVM fields
- Linux fields
- Logstash fields
- Memcached fields
- MongoDB fields
- MSSQL fields
- Munin fields
- MySQL fields
- NATS fields
- Nginx fields
- Openmetrics fields
- Oracle fields
- PHP_FPM fields
- PostgreSQL fields
- Process fields
- Prometheus fields
- Prometheus typed metrics fields
- RabbitMQ fields
- Redis fields
- Redis Enterprise fields
- SQL fields
- Stan fields
- Statsd fields
- SyncGateway fields
- System fields
- Tomcat fields
- Traefik fields
- uWSGI fields
- vSphere fields
- Windows fields
- ZooKeeper fields
- Monitor
- Secure
- Troubleshoot
- Get help
- Debug
- Common problems
- "open /compat/linux/proc: no such file or directory" error on FreeBSD
- Metricbeat collects system metrics for interfaces you didn’t configure
- Metricbeat uses too much bandwidth
- Error loading config file
- Found unexpected or unknown characters
- Logstash connection doesn’t work
- Publishing to Logstash fails with "connection reset by peer" message
- @metadata is missing in Logstash
- Not sure whether to use Logstash or Beats
- SSL client fails to connect to Logstash
- Monitoring UI shows fewer Beats than expected
- Dashboard could not locate the index-pattern
- High RSS memory usage due to MADV settings
- Contribute to Beats
Google Cloud Platform module
editGoogle Cloud Platform module
editThis functionality is in beta and is subject to change. The design and code is less mature than official GA features and is being provided as-is with no warranties. Beta features are not subject to the support SLA of official GA features.
This module periodically fetches monitoring metrics from Google Cloud Platform using Stackdriver Monitoring API for Google Cloud Platform services.
Extra GCP charges on Stackdriver Monitoring API requests may be generated by this module. Please see rough estimation of the number of API calls for more details.
Module config and parameters
editThis is a list of the possible module parameters you can tune:
-
zone: A single string with the zone you want to monitor like
us-central1-a. Or you can specific a partial zone name likeus-central1-orus-central1-*, which will monitor all zones start withus-central1-:us-central1-a,us-central1-b,us-central1-candus-central1-f. Please see GCP zones for zones that are available in GCP. -
region: A single string with the region you want to monitor like
us-central1. This will enable monitoring for all zones under this region. Or you can specific a partial region name likeus-eastorus-east*, which will monitor all regions start withus-east:us-east1andus-east4. If both region and zone are configured, only region will be used. Please see GCP regions for regions that are available in GCP. If bothregionandzoneare not specified, metrics will be collected from all regions/zones. - project_id: A single string with your GCP Project ID
- credentials_file_path: A single string pointing to the JSON file path reachable by Metricbeat that you have created using IAM.
-
exclude_labels: (
true/falsedefaultfalse) Do not extract extra labels and metadata information from metricsets and fetch metrics only. At the moment, labels and metadata extraction is only supported incomputemetricset. - period: A single time duration specified for this module collection frequency.
Example configuration
edit-
computemetricset is enabled to collect metrics fromus-central1-azone inelastic-observabilityproject.- module: gcp metricsets: - compute zone: "us-central1-a" project_id: "elastic-observability" credentials_file_path: "your JSON credentials file path" exclude_labels: false period: 60s
-
computeandpubsubmetricsets are enabled to collect metrics from all zones underus-central1region inelastic-observabilityproject.- module: gcp metricsets: - compute - pubsub region: "us-central1" project_id: "elastic-observability" credentials_file_path: "your JSON credentials file path" exclude_labels: false period: 60s
-
computemetricset is enabled to collect metrics from all regions starts withus-westinelastic-observabilityproject, which includes all zones underus-west1,us-west2,us-west3andus-west4.- module: gcp metricsets: - compute - pubsub region: "us-west" project_id: "elastic-observability" credentials_file_path: "your JSON credentials file path" exclude_labels: false period: 60s
Authentication, authorization and permissions.
editAuthentication and authorization in Google Cloud Platform can be achieved in many ways. For the current version of the Google Cloud Platform module for Metricbeat, the only supported method is using Service Account JSON files. A typical JSON with a private key looks like this:
Example Credentials
edit{ "type": "service_account", "project_id": "your-project-id", "private_key_id": "a_private_key_id", "private_key": "-----BEGIN PRIVATE KEY-----your private key\n-----END PRIVATE KEY-----\n", "client_email": "some-email@your-project-id.iam.gserviceaccount.com", "client_id": "123456", "auth_uri": "https://accounts.google.com/o/oauth2/auth", "token_uri": "https://oauth2.googleapis.com/token", "auth_provider_x509_cert_url": "https://www.googleapis.com/oauth2/v1/certs", "client_x509_cert_url": "https://www.googleapis.com/robot/v1/metadata/x509/metricbeat-testing%40your-project-id.iam.gserviceaccount.com" }
Generally, you have to create a Service Account and assign it the following roles or the permissions described on each role (applies to all metricsets):
-
Compute Viewer(1 permission in use of 138):-
monitoring.metricDescriptors.list -
monitoring.timeSeries.list
-
-
Monitoring Viewer(2 permissions in use of 13)-
compute.instances.get
-
You can play in IAM pretty much with your service accounts and Instance level access to your resources (for example, allowing that everything running in an Instance is authorized to use the Compute API). The module uses Google Cloud Platform libraries for authentication so many possibilities are open but the Module is only supported by using the method mentioned above.
Google Cloud Platform module: Under the hood
editGoogle Cloud Platform offers the Stackdriver Monitoring API to fetch metrics from its services. Those metrics are retrieved one by one.
If you also want to extract service labels (by setting exclude_labels to false, which is the default state). You also make a new API check on the corresponding service. Service labels requires a new API call to extract those metrics. In the worst case the number of API calls will be doubled. In the best case, all metrics come from the same GCP entity and 100% of the required information is included in the first API call (which is cached for subsequent calls).
If period value is set to 5-minute and sample period of the metric type is 60-second, then this module will collect data from this metric type once every 5 minutes with aggregation.
GCP monitoring data has a up to 240 seconds latency, which means latest monitoring data will be up to 4 minutes old. Please see Latency of GCP Monitoring Metric Data for more details.
In gcp module, metrics are collected based on this ingest delay, which is also obtained from ListMetricDescriptors API.
Rough estimation of the number of API calls
editGoogle Cloud Platform pricing depends of the number of requests you do to their API’s. Here you have some information that you can use to make an estimation of the pricing you should expect. For example, imagine that you have a Compute Metricset activated and you don’t want to exclude labels. You have a total of 20 instances running in a particular GCP project, region and zone.
For example, if Compute Metricset fetches 14 metrics (which is the number of metrics fetched in the early beta version). Each of those metrics will attempt an API call to Compute API to retrieve also their metadata. Because you have 20 different instances, the total number of API calls that will be done on each refresh period are: 14 metrics + 20 instances = 34 API requests every 5 minutes if that is your current Period. 9792 API requests per day with one zone. If you add 2 zones more with the same amount of instances you’ll have 19584 API requests per day (9792 on each zone) or around 587520 per month for the Compute Metricset. This maths must be done for each different Metricset with slight variations.
Metricsets
editCurrently, we have billing, compute, gke, loadbalancing, pubsub, metrics and
storage metricset in gcp module.
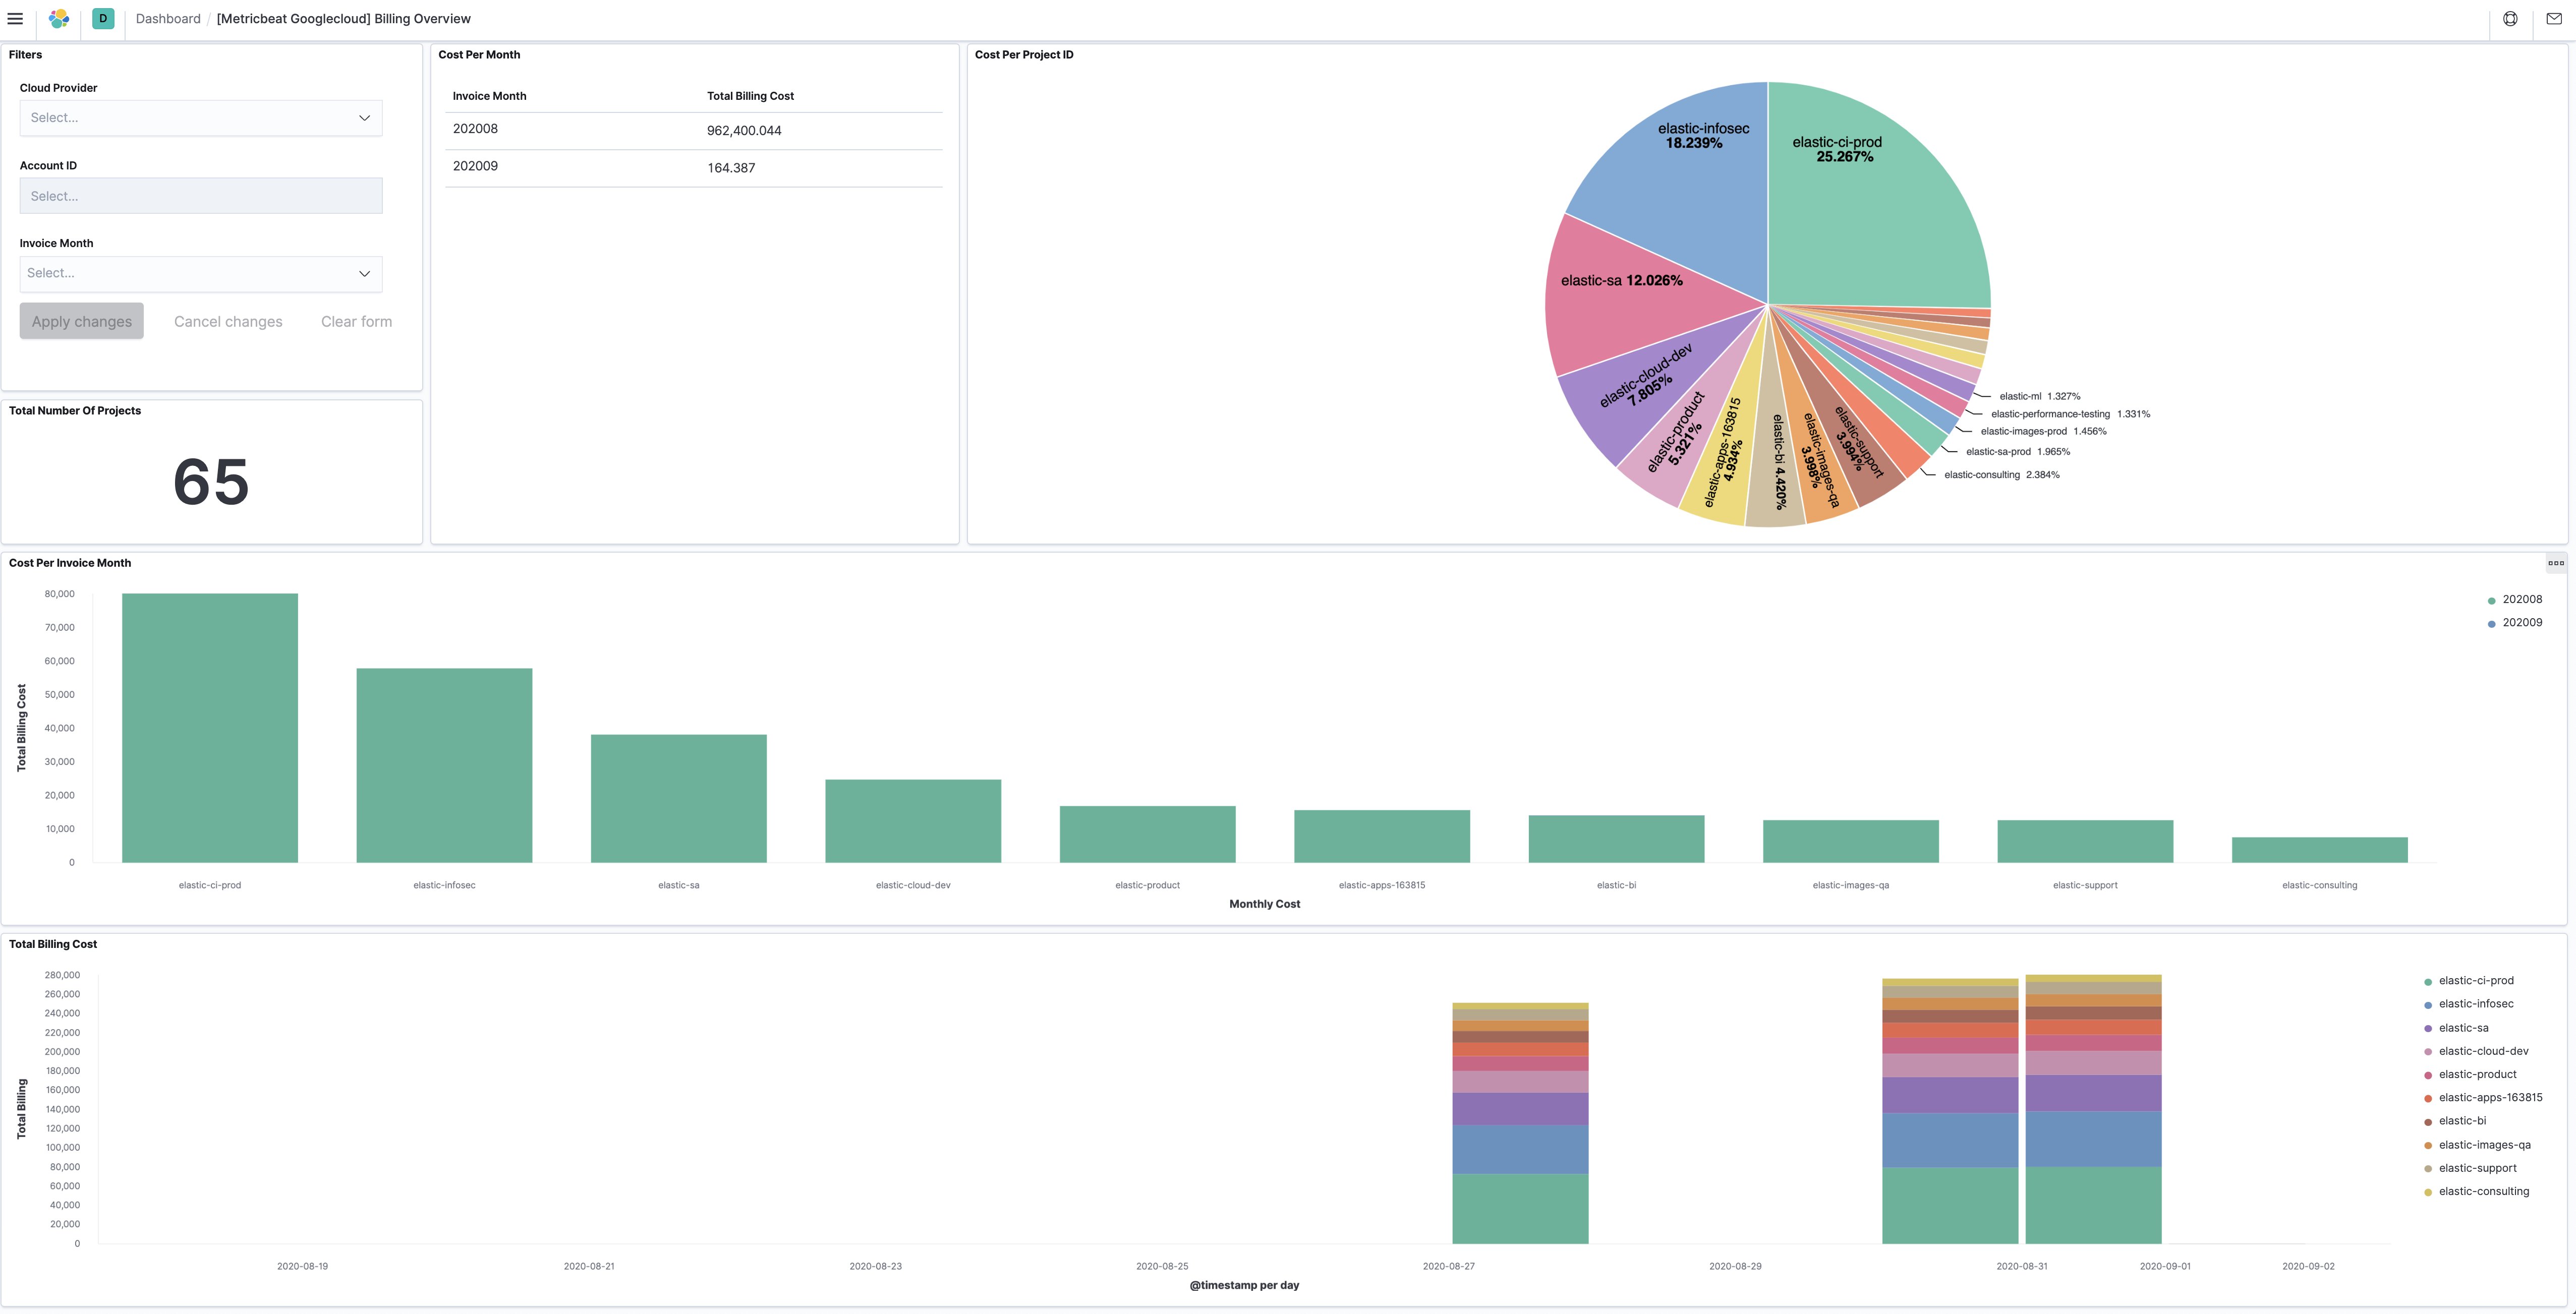
billing
editThis metricset fetches billing metrics from GCP BigQuery Cloud Billing allows users to export billing data into BigQuery automatically throughout the day. This metricset gets access to the daily cost detail table periodically to export billing metrics for further analysis.
The billing metricset comes with a predefined dashboard:
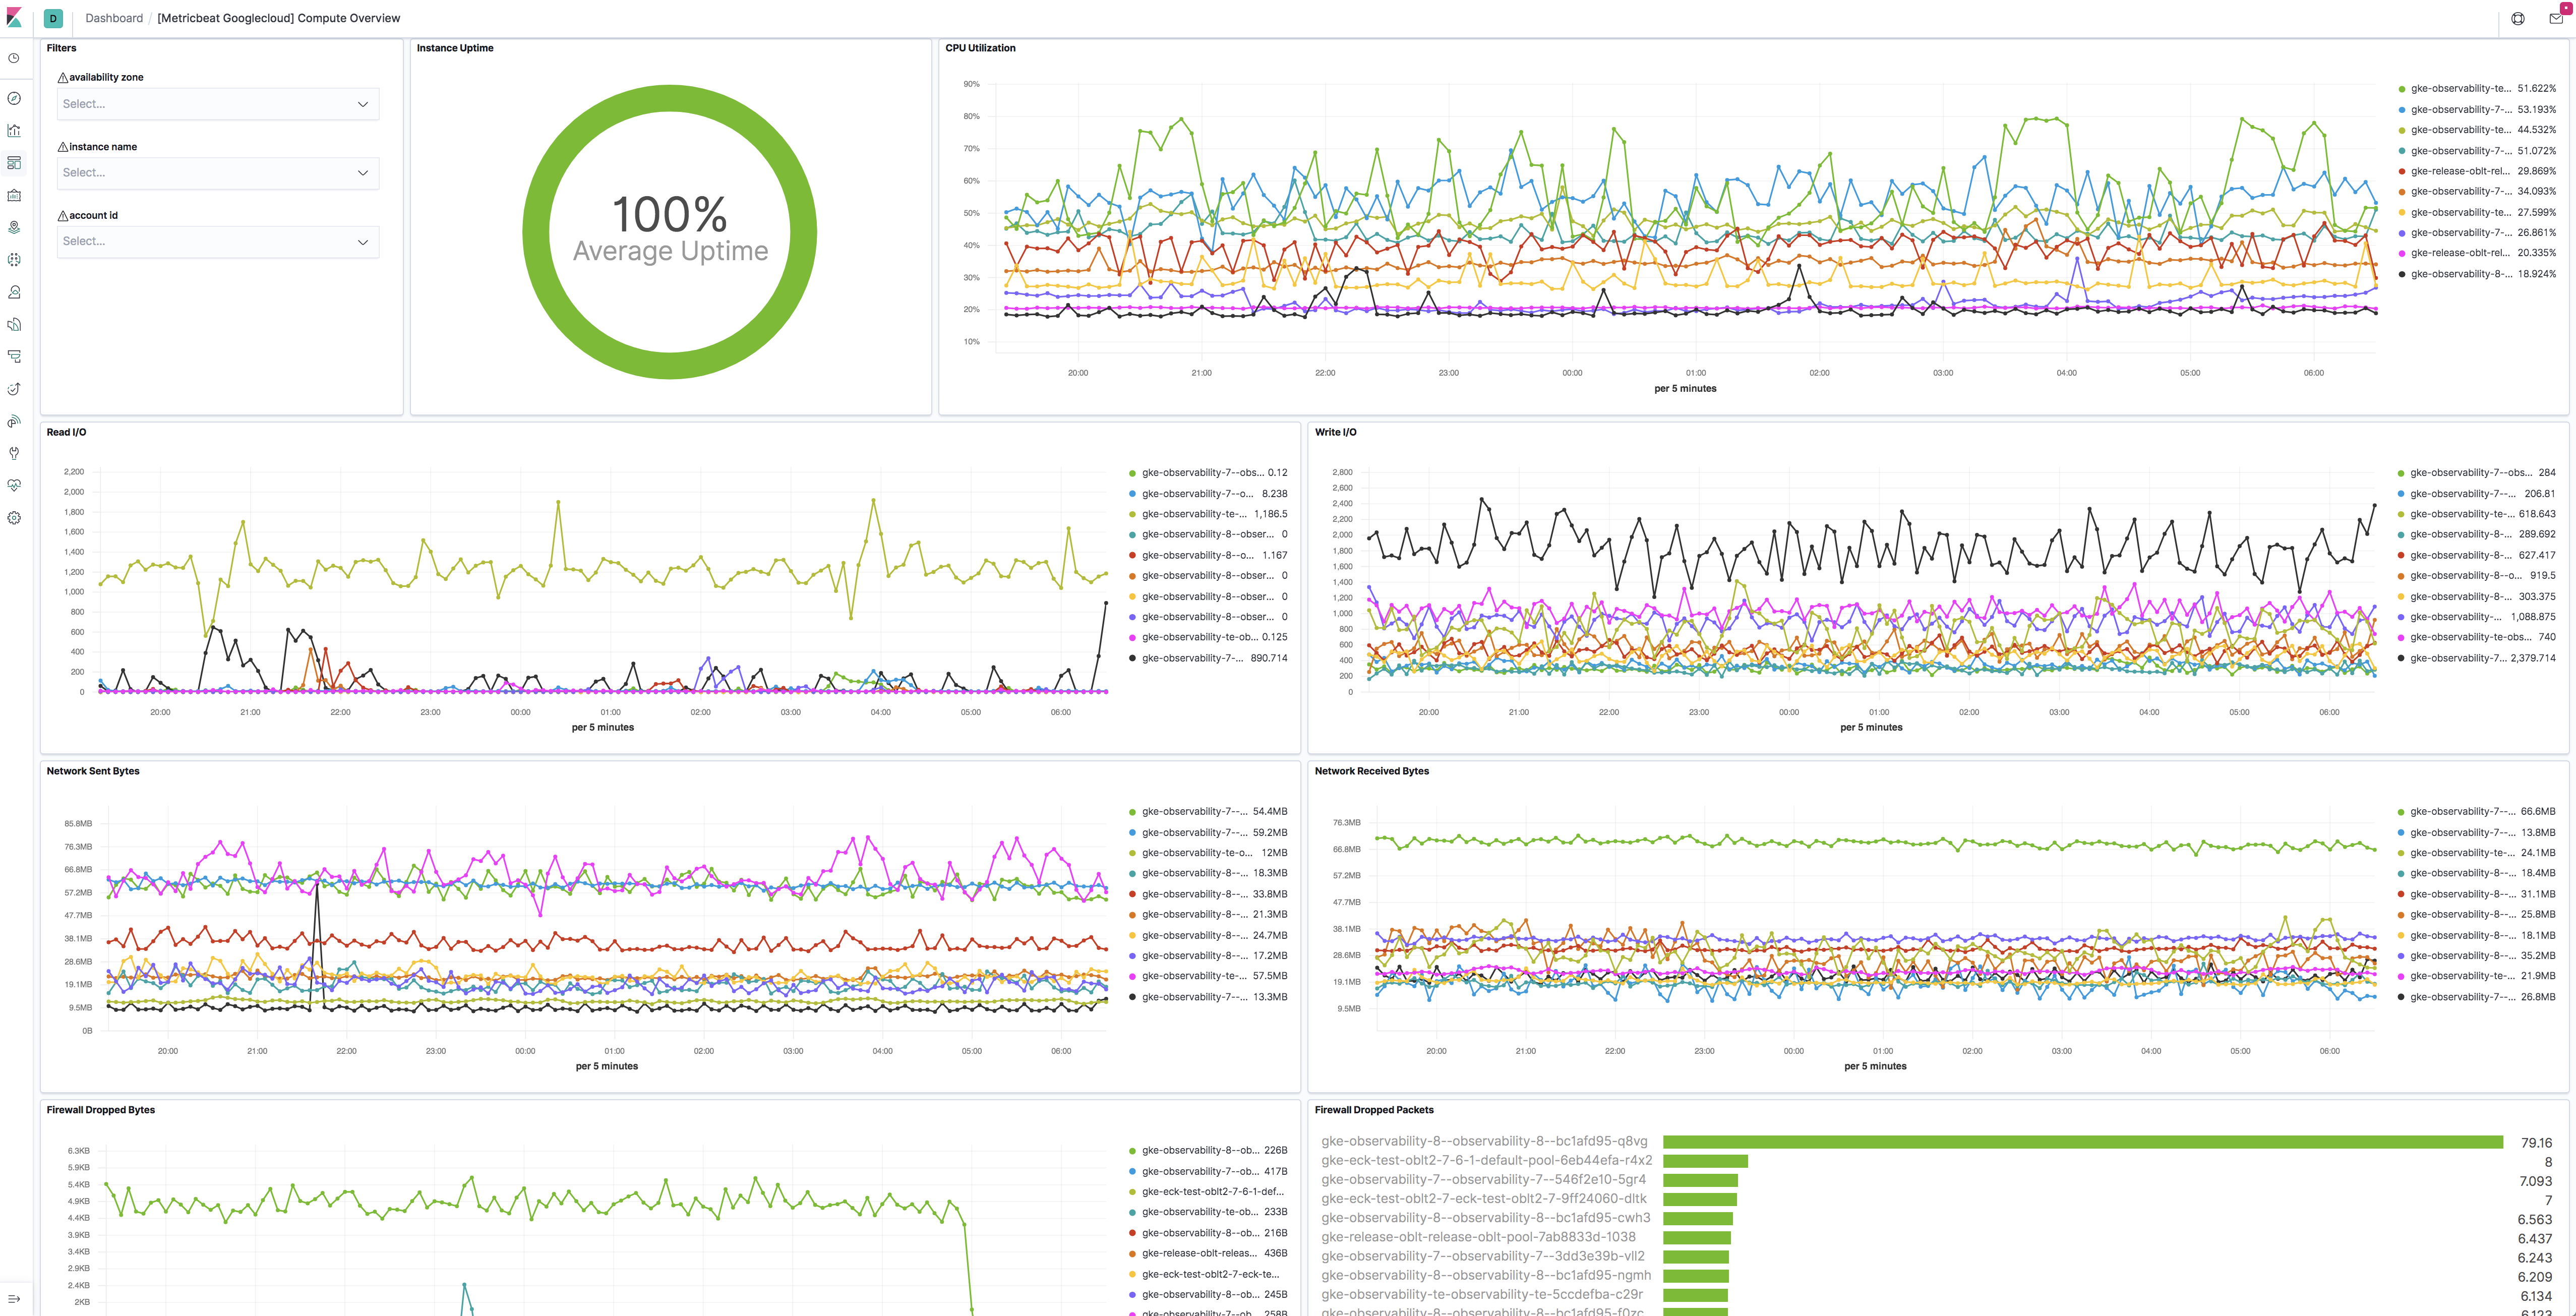
compute
editThis metricset fetches metrics from Compute Engine
Virtual Machines in Google Cloud Platform. The compute metricset contains some
of the metrics exported from the GCP Compute Monitoring API.
Extra labels and metadata are also extracted using the Compute API.
This is enough to get most of the info associated with a metric like compute
labels and metadata and metric specific Labels.
The compute metricset comes with a predefined dashboard:
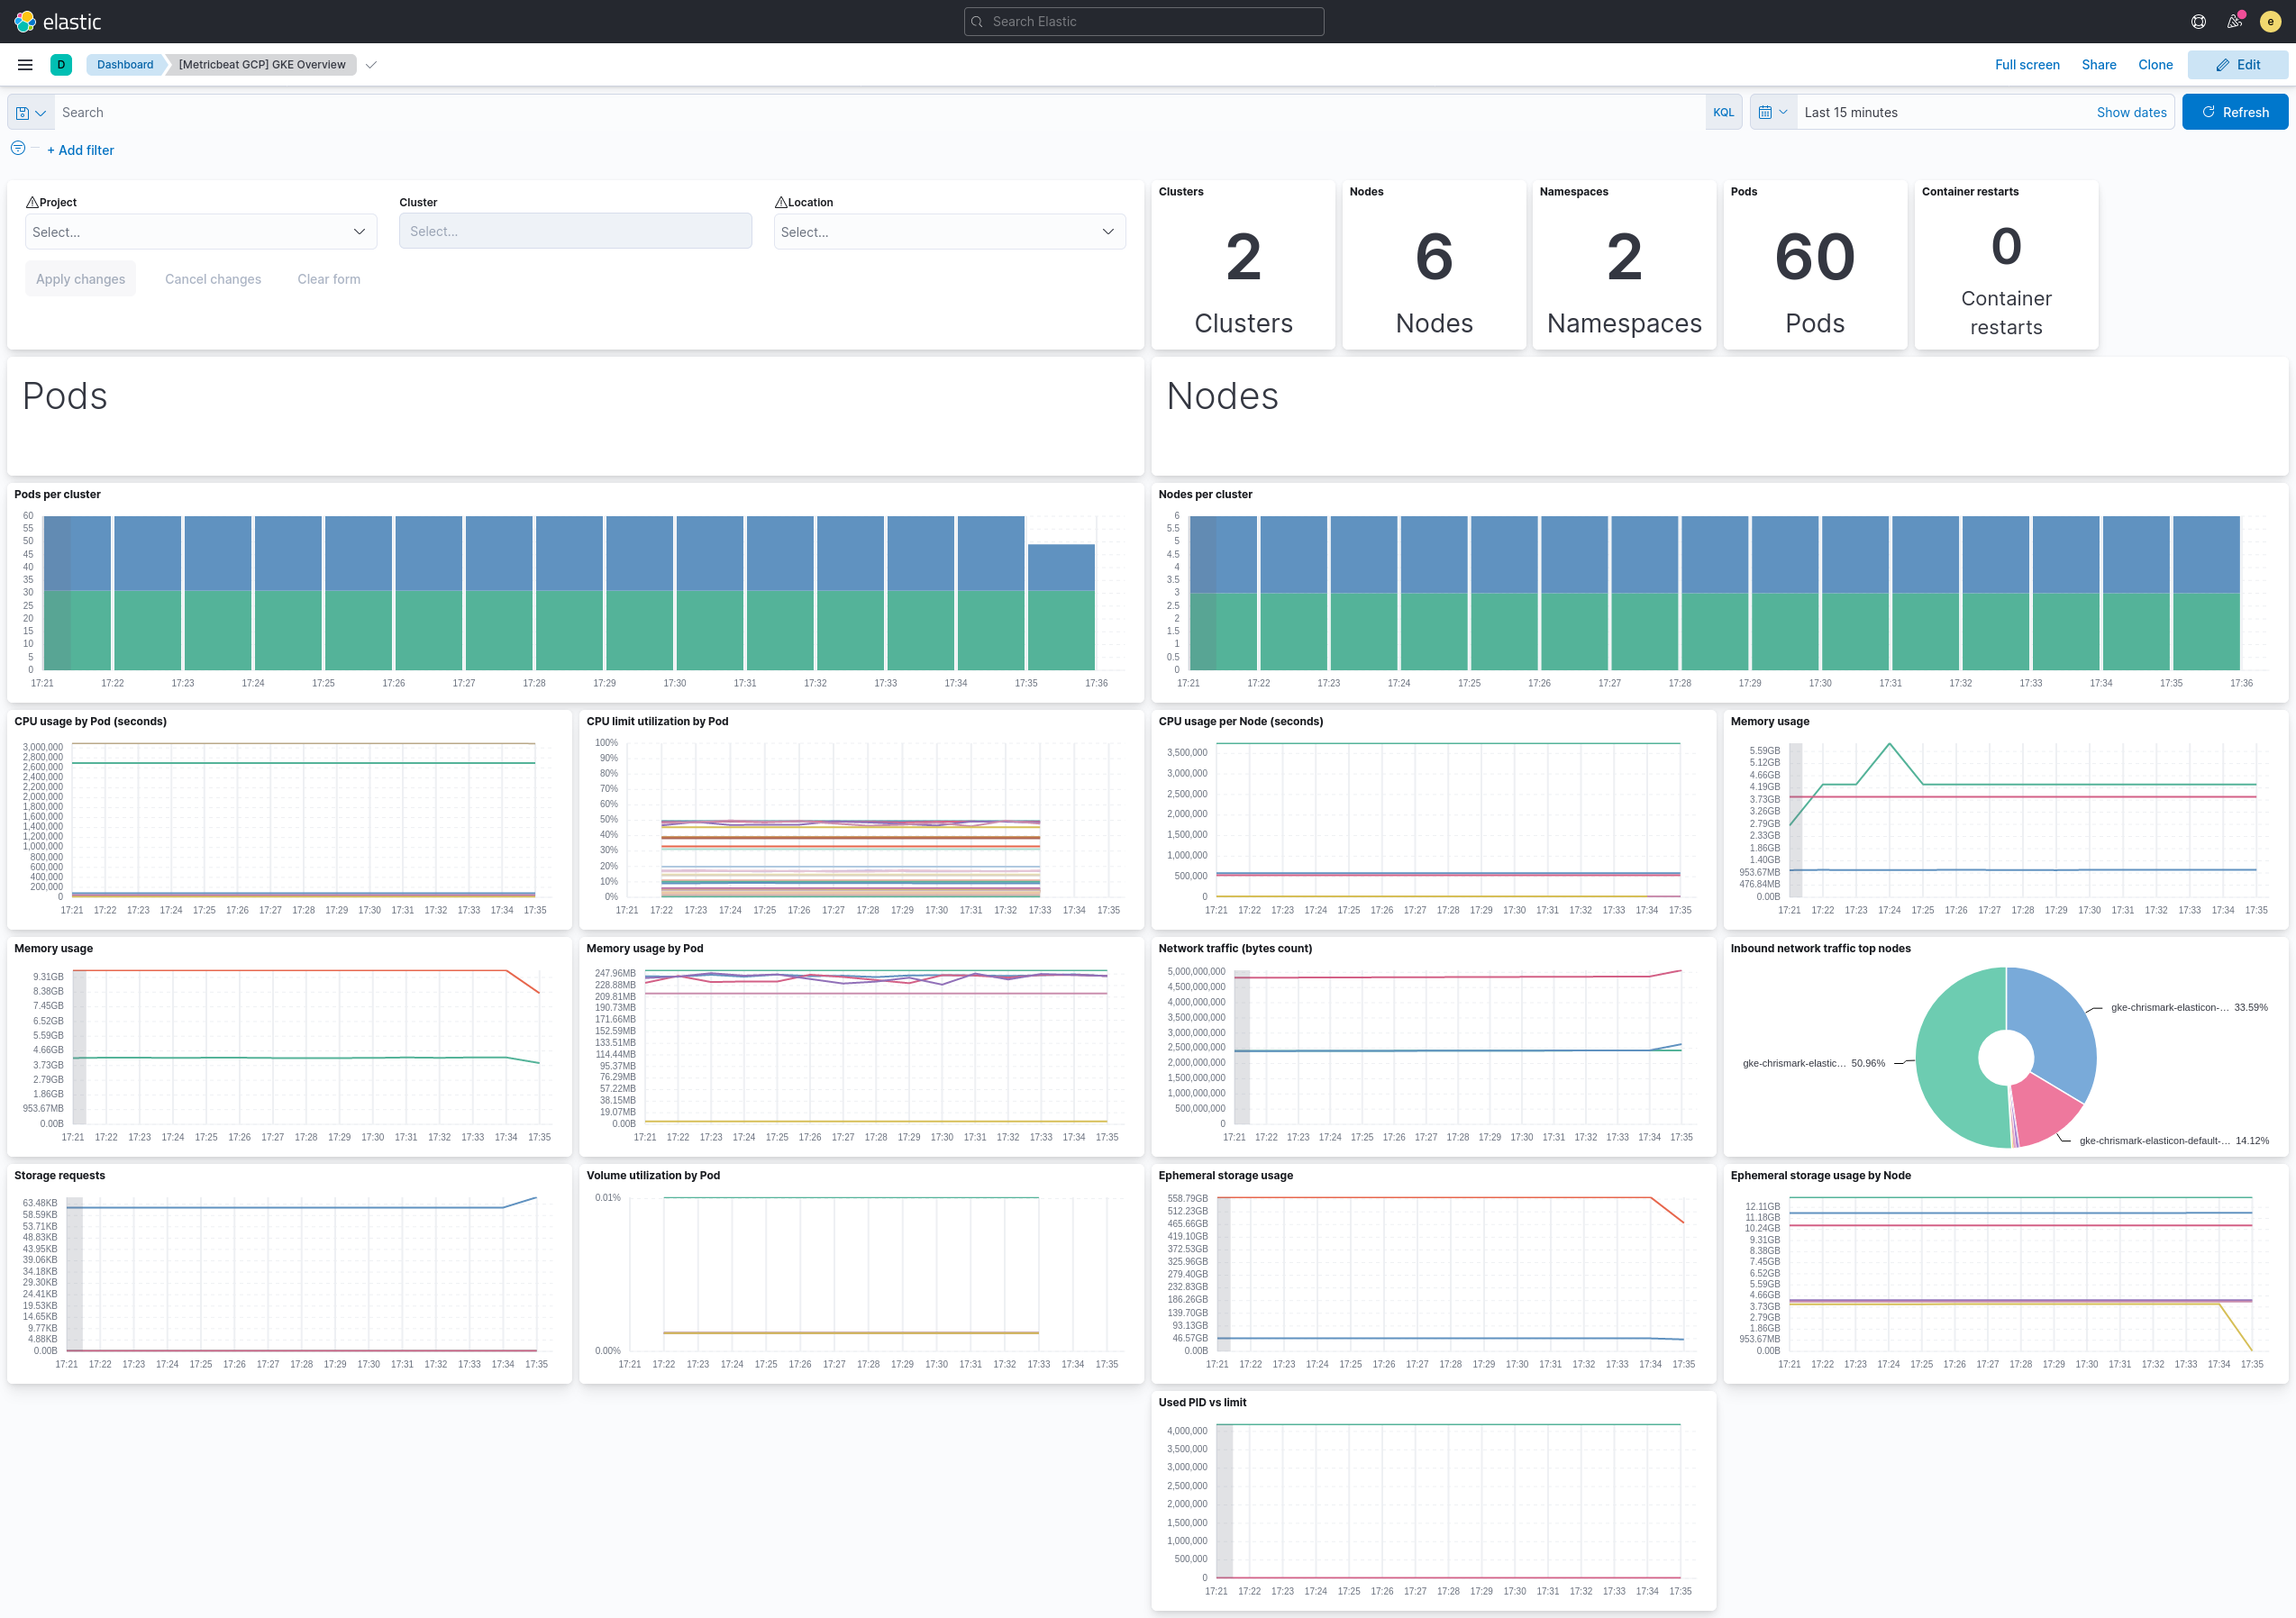
gke
editThis metricset fetches metrics for Kubernetes Engine.
The gke metricset contains all GA metrics exported by Cloud Monitoring Kubernetes metrics.
Extra labels and metadata are also extracted using the Compute API.
The gke metricset comes with a predefined dashboard:
loadbalancing
editThis metricset fetches metrics from Load Balancing
in Google Cloud Platform. The loadbalancing metricset contains all metrics
exported from the GCP Load Balancing Monitoring API.
The loadbalancing metricset comes with two predefined dashboards:
HTTPS
editFor HTTPS load balancing: image::./images/metricbeat-gcp-load-balancing-https-overview.png[]
L3
editFor L3 load balancing: image::./images/metricbeat-gcp-load-balancing-l3-overview.png[]
TCP/SSL/Proxy
editFor TCP/SSL/Proxy load balancing: image::./images/metricbeat-gcp-load-balancing-tcp-ssl-proxy-overview.png[]
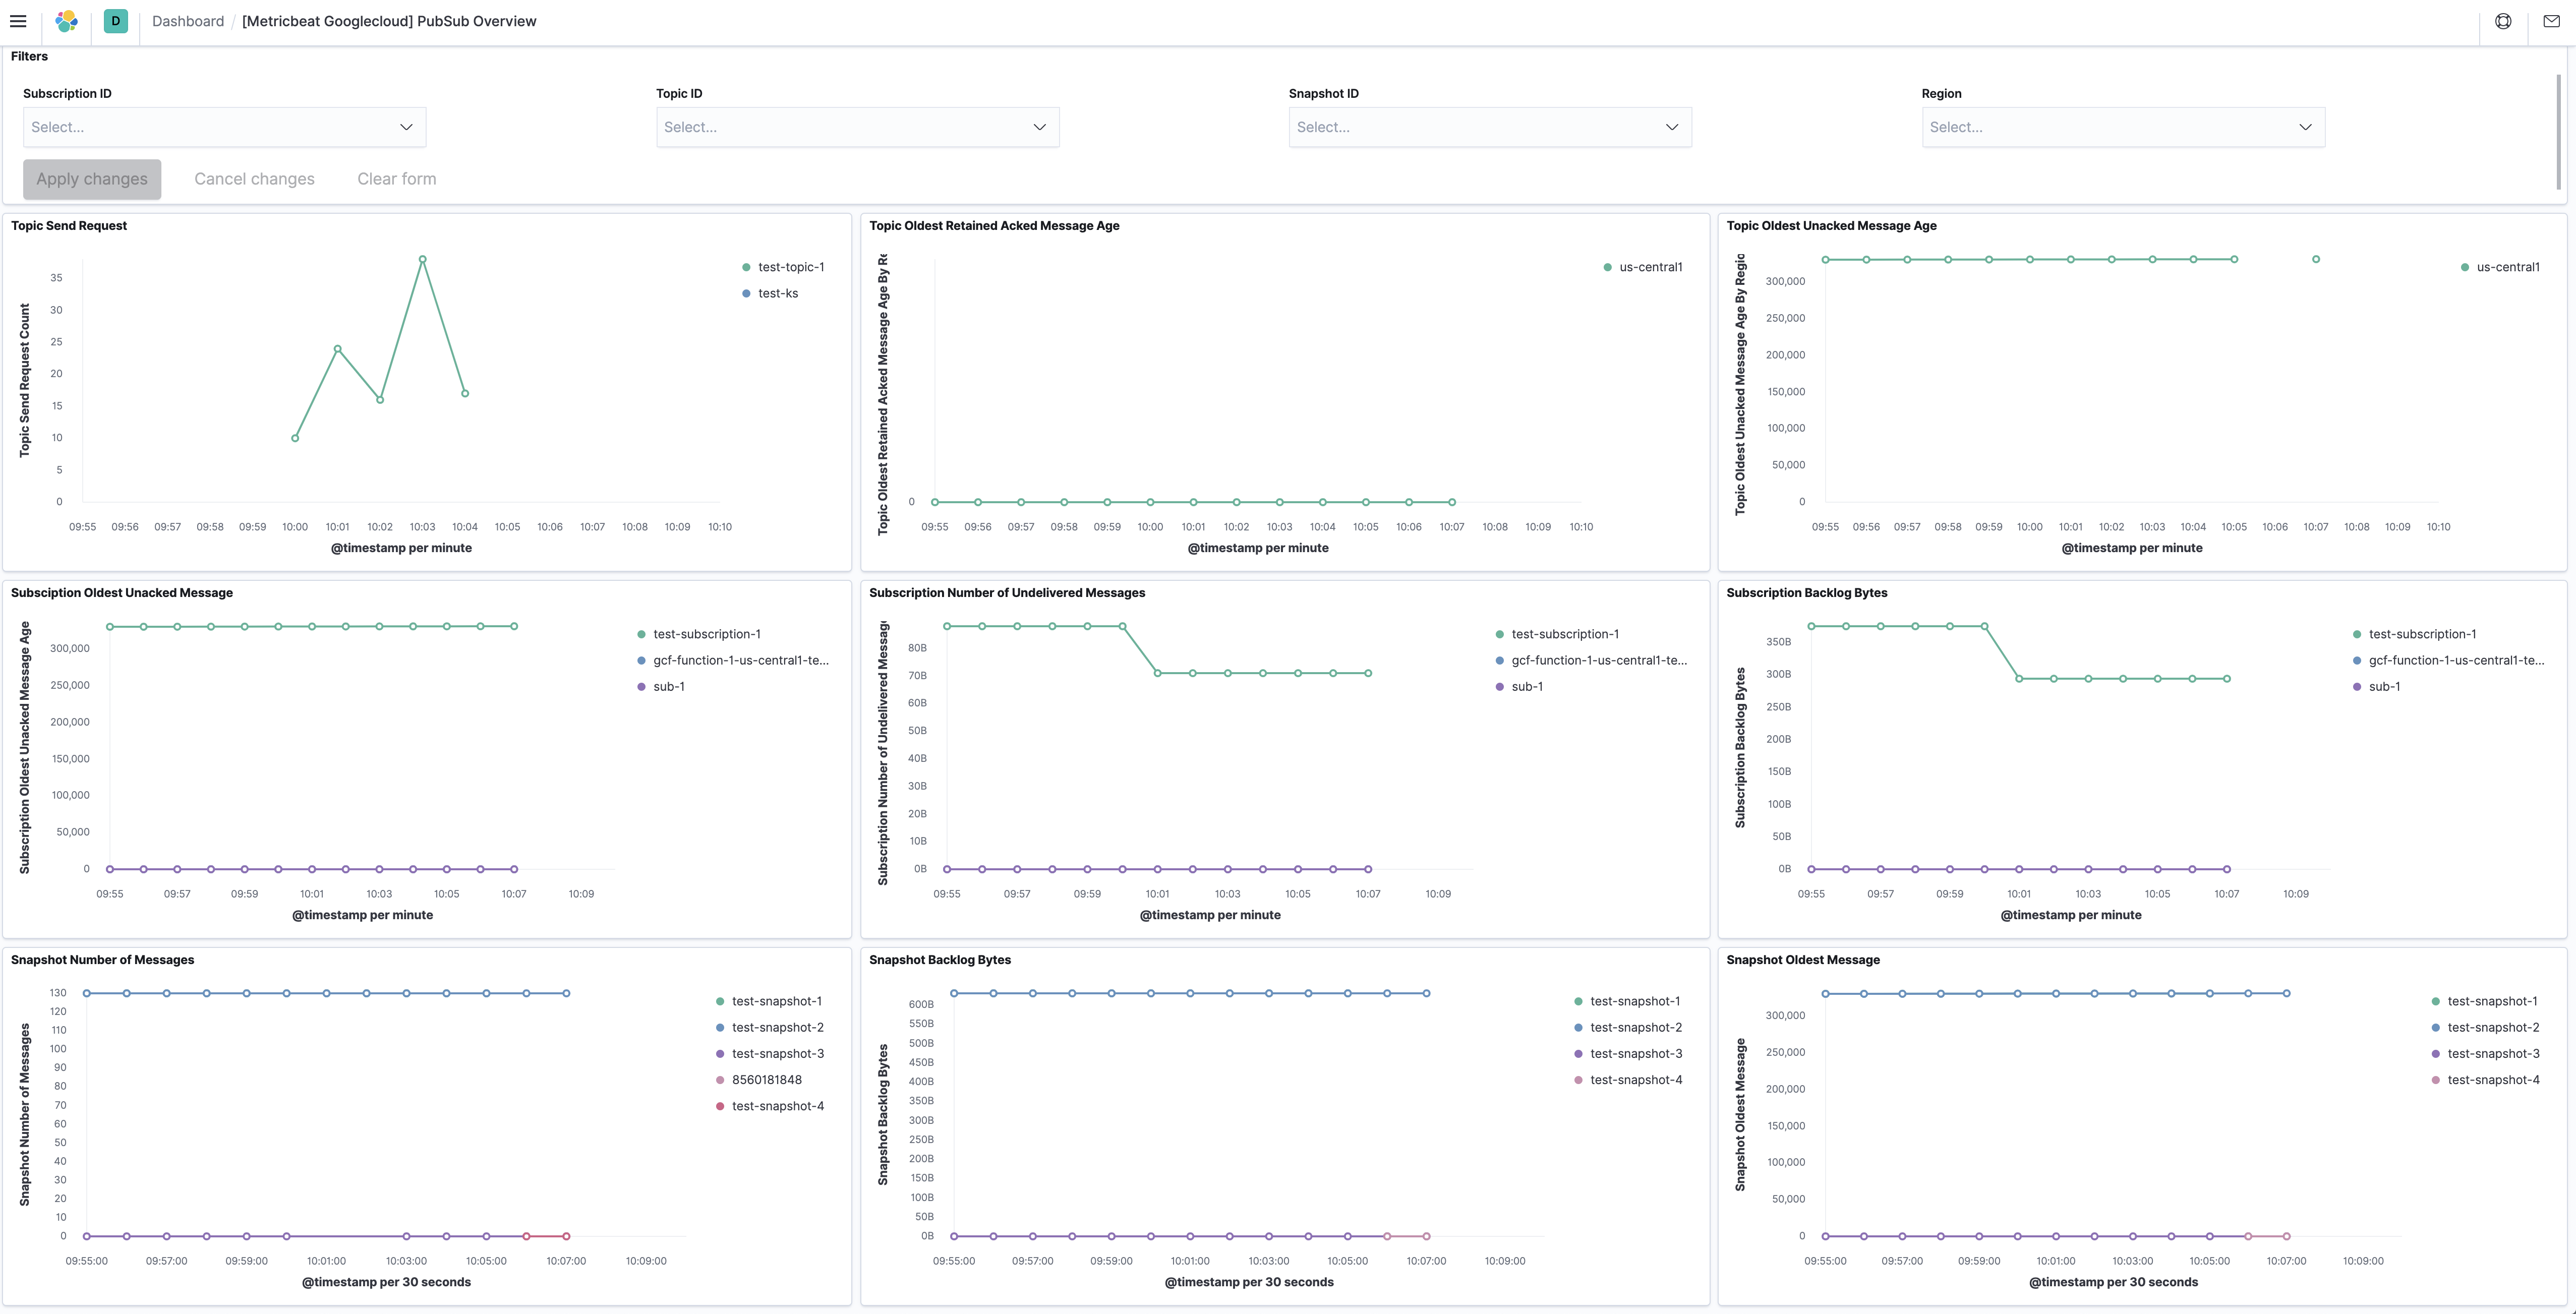
pubsub
editThis metricset fetches metrics from Pub/Sub
topics and subscriptions in Google Cloud Platform. The pubsub metricset
contains all GA stage metrics exported from the
GCP PubSub Monitoring API.
The pubsub metricset comes with a predefined dashboard:
metrics
editmetrics metricset uses Google Cloud Operations/Stackdriver, which provides
visibility into the performance, uptime, and overall health of cloud-powered
applications. It collects metrics, events, and metadata from different services
from Google Cloud.
This metricset is to collect monitoring metrics
from Google Cloud using ListTimeSeries API.
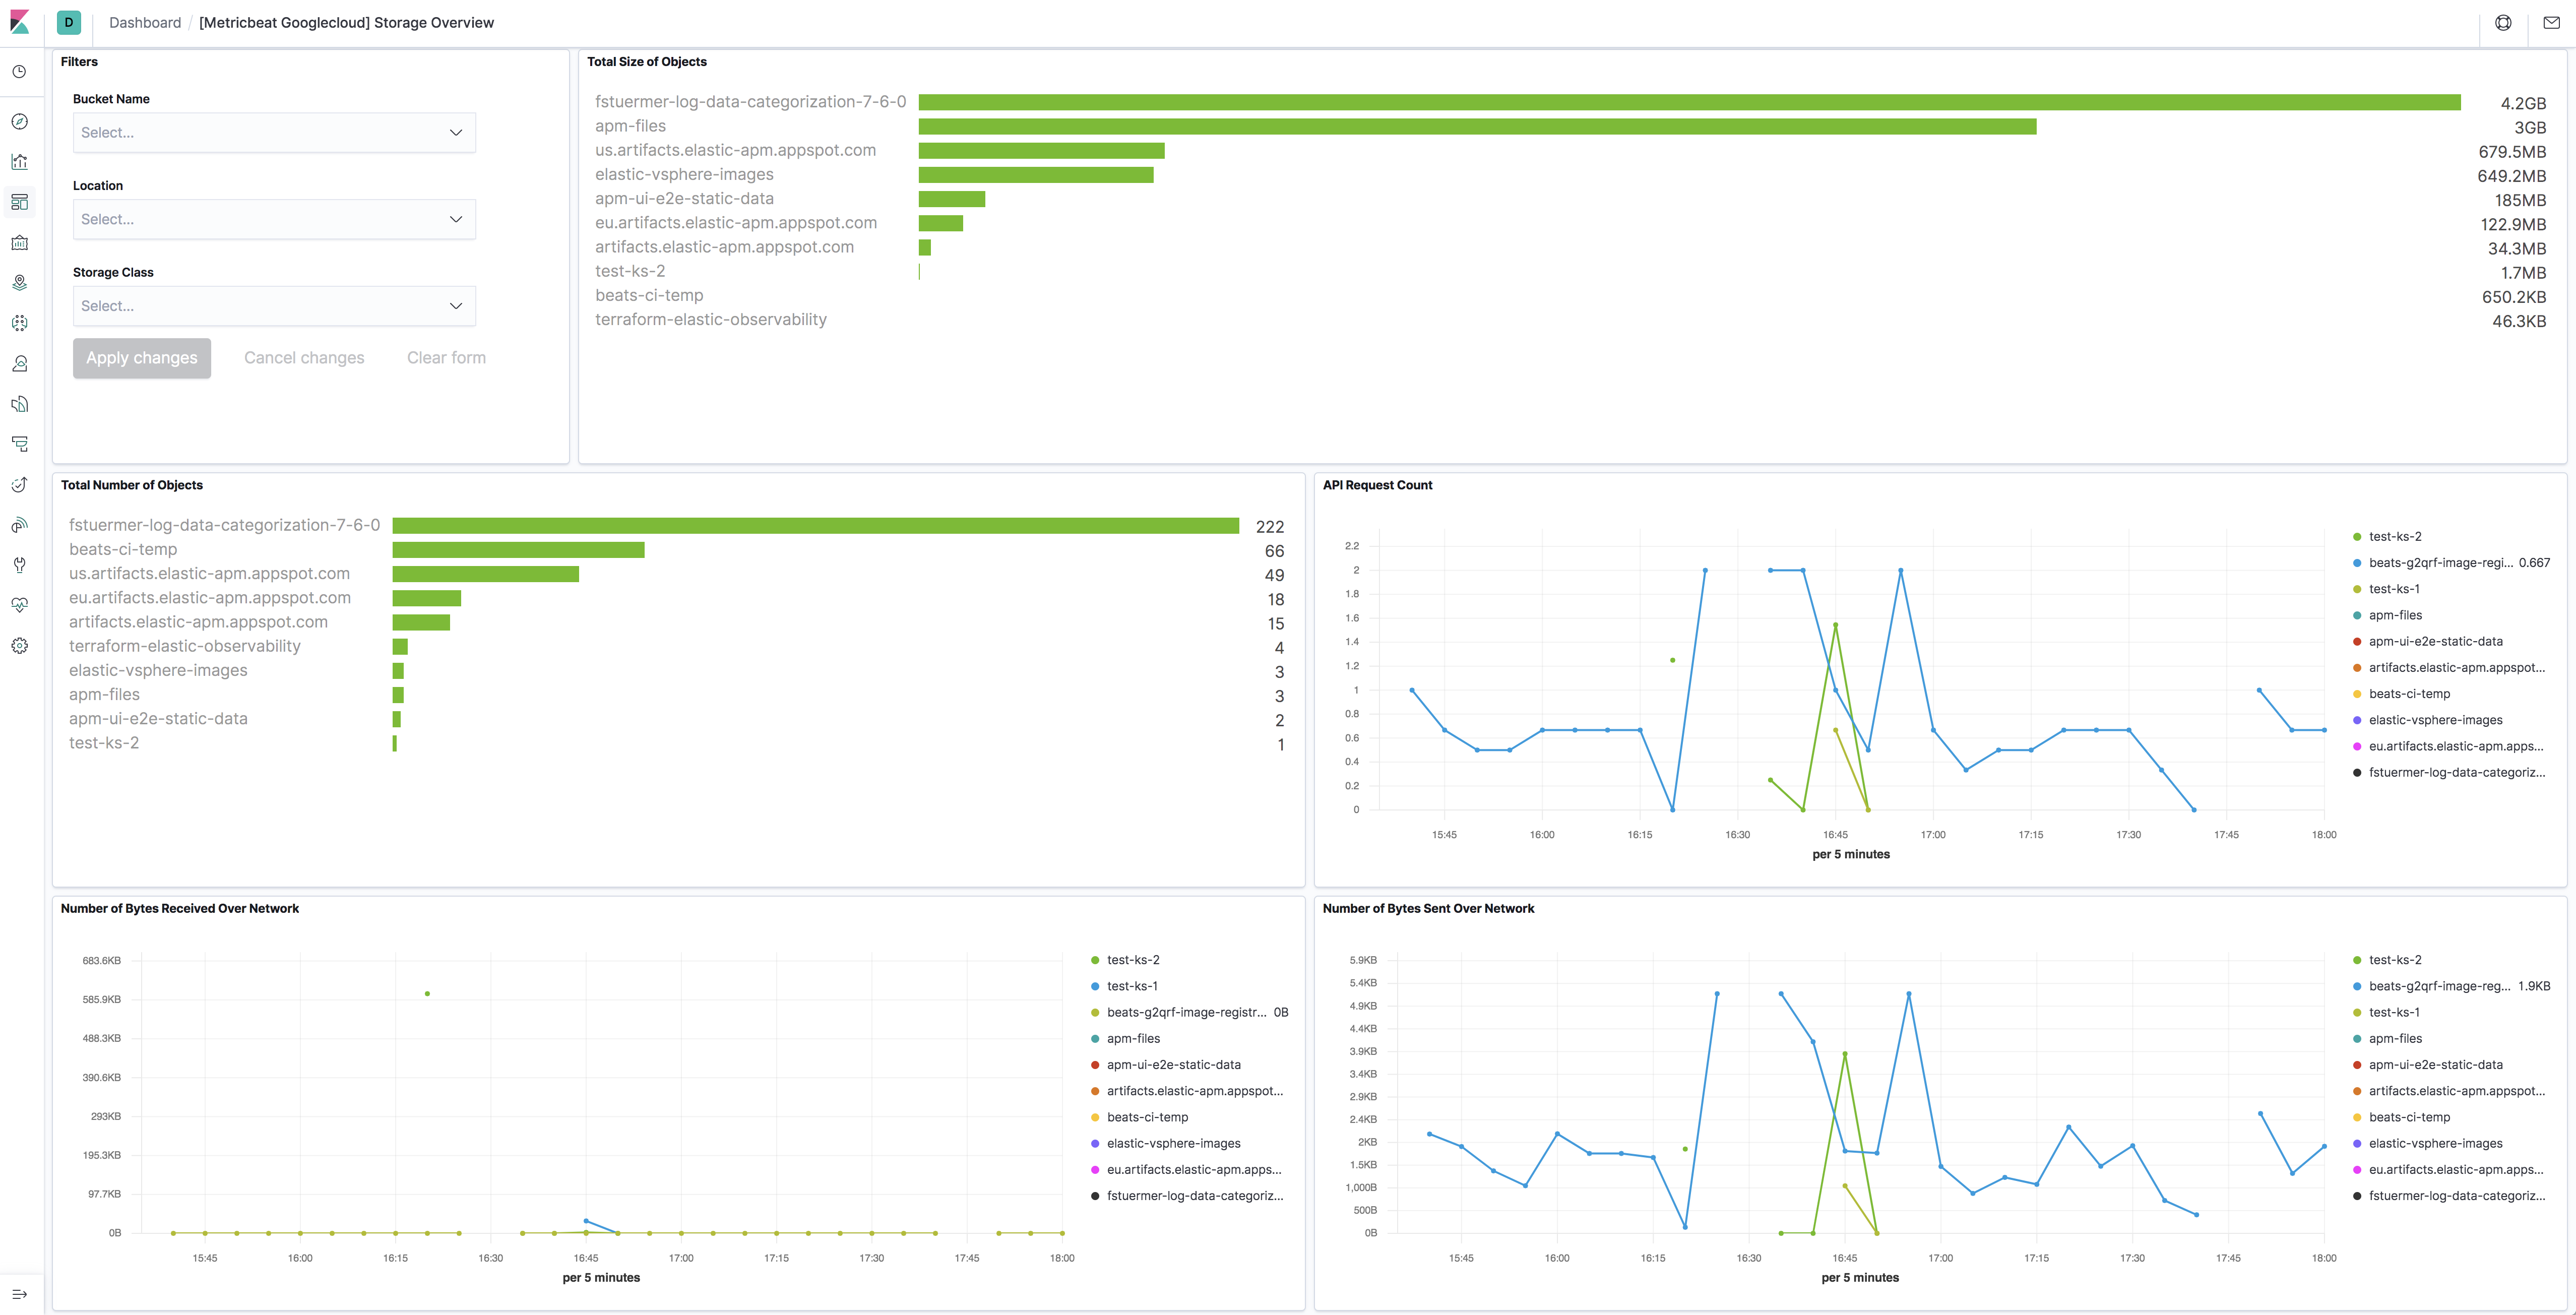
storage
editThis metricset fetches metrics from Storage
in Google Cloud Platform. The storage metricset contains all GA metrics
exported from the GCP Storage Monitoring API.
We recommend users to define period: 5m for this metricset because in Google
Cloud, storage monitoring metrics are written every 5-minute sample period with
a 10-minute ingest delay.
The storage metricset comes with a predefined dashboard:
Example configuration
editThe Google Cloud Platform module supports the standard configuration options that are described in Modules. Here is an example configuration:
metricbeat.modules:
- module: gcp
  metricsets:
    - compute
  region: "us-"
  project_id: "your project id"
  credentials_file_path: "your JSON credentials file path"
  exclude_labels: false
  period: 1m

- module: gcp
  metricsets:
    - pubsub
    - loadbalancing
    - firestore
    - dataproc
  zone: "us-central1-a"
  project_id: "your project id"
  credentials_file_path: "your JSON credentials file path"
  exclude_labels: false
  period: 1m

- module: gcp
  metricsets:
    - storage
  project_id: "your project id"
  credentials_file_path: "your JSON credentials file path"
  exclude_labels: false
  period: 5m

- module: gcp
  metricsets:
    - metrics
  project_id: "your project id"
  credentials_file_path: "your JSON credentials file path"
  exclude_labels: false
  period: 1m
  metrics:
    - aligner: ALIGN_NONE
      service: compute
      metric_types:
        - "instance/cpu/reserved_cores"
        - "instance/cpu/usage_time"
        - "instance/cpu/utilization"
        - "instance/uptime"

- module: gcp
  metricsets:
    - gke
  project_id: "your project id"
  credentials_file_path: "your JSON credentials file path"
  exclude_labels: false
  period: 1m

- module: gcp
  metricsets:
    - billing
  period: 24h
  project_id: "your project id"
  credentials_file_path: "your JSON credentials file path"
  dataset_id: "dataset id"
  table_pattern: "table pattern"
  cost_type: "regular"
Metricsets
editThe following metricsets are available:
On this page
- Module config and parameters
- Example configuration
- Authentication, authorization and permissions.
- Example Credentials
- Google Cloud Platform module: Under the hood
- Rough estimation of the number of API calls
- Metricsets
billingcomputegkeloadbalancing- HTTPS
- L3
- TCP/SSL/Proxy
pubsubmetricsstorage- Example configuration
- Metricsets