Azure module
editAzure module
editThe Azure Monitor feature collects and aggregates logs and metrics from a variety of sources into a common data platform where it can be used for analysis, visualization, and alerting.
The azure monitor metrics are numerical values that describe some aspect of a system at a particular point in time. They are collected at regular intervals and are identified with a timestamp, a name, a value, and one or more defining labels.
The azure module will periodically retrieve the azure monitor metrics using the Azure REST APIs as MetricList. Additional azure API calls will be executed in order to retrieve information regarding the resources targeted by the user.
Extra Azure charges on metric queries may be generated by this module. Please see additional notes about metrics and costs for more details.
Dashboards
editThe azure module comes with several predefined dashboards for virtual machines, VM guest metrics and virtual machine scale sets.
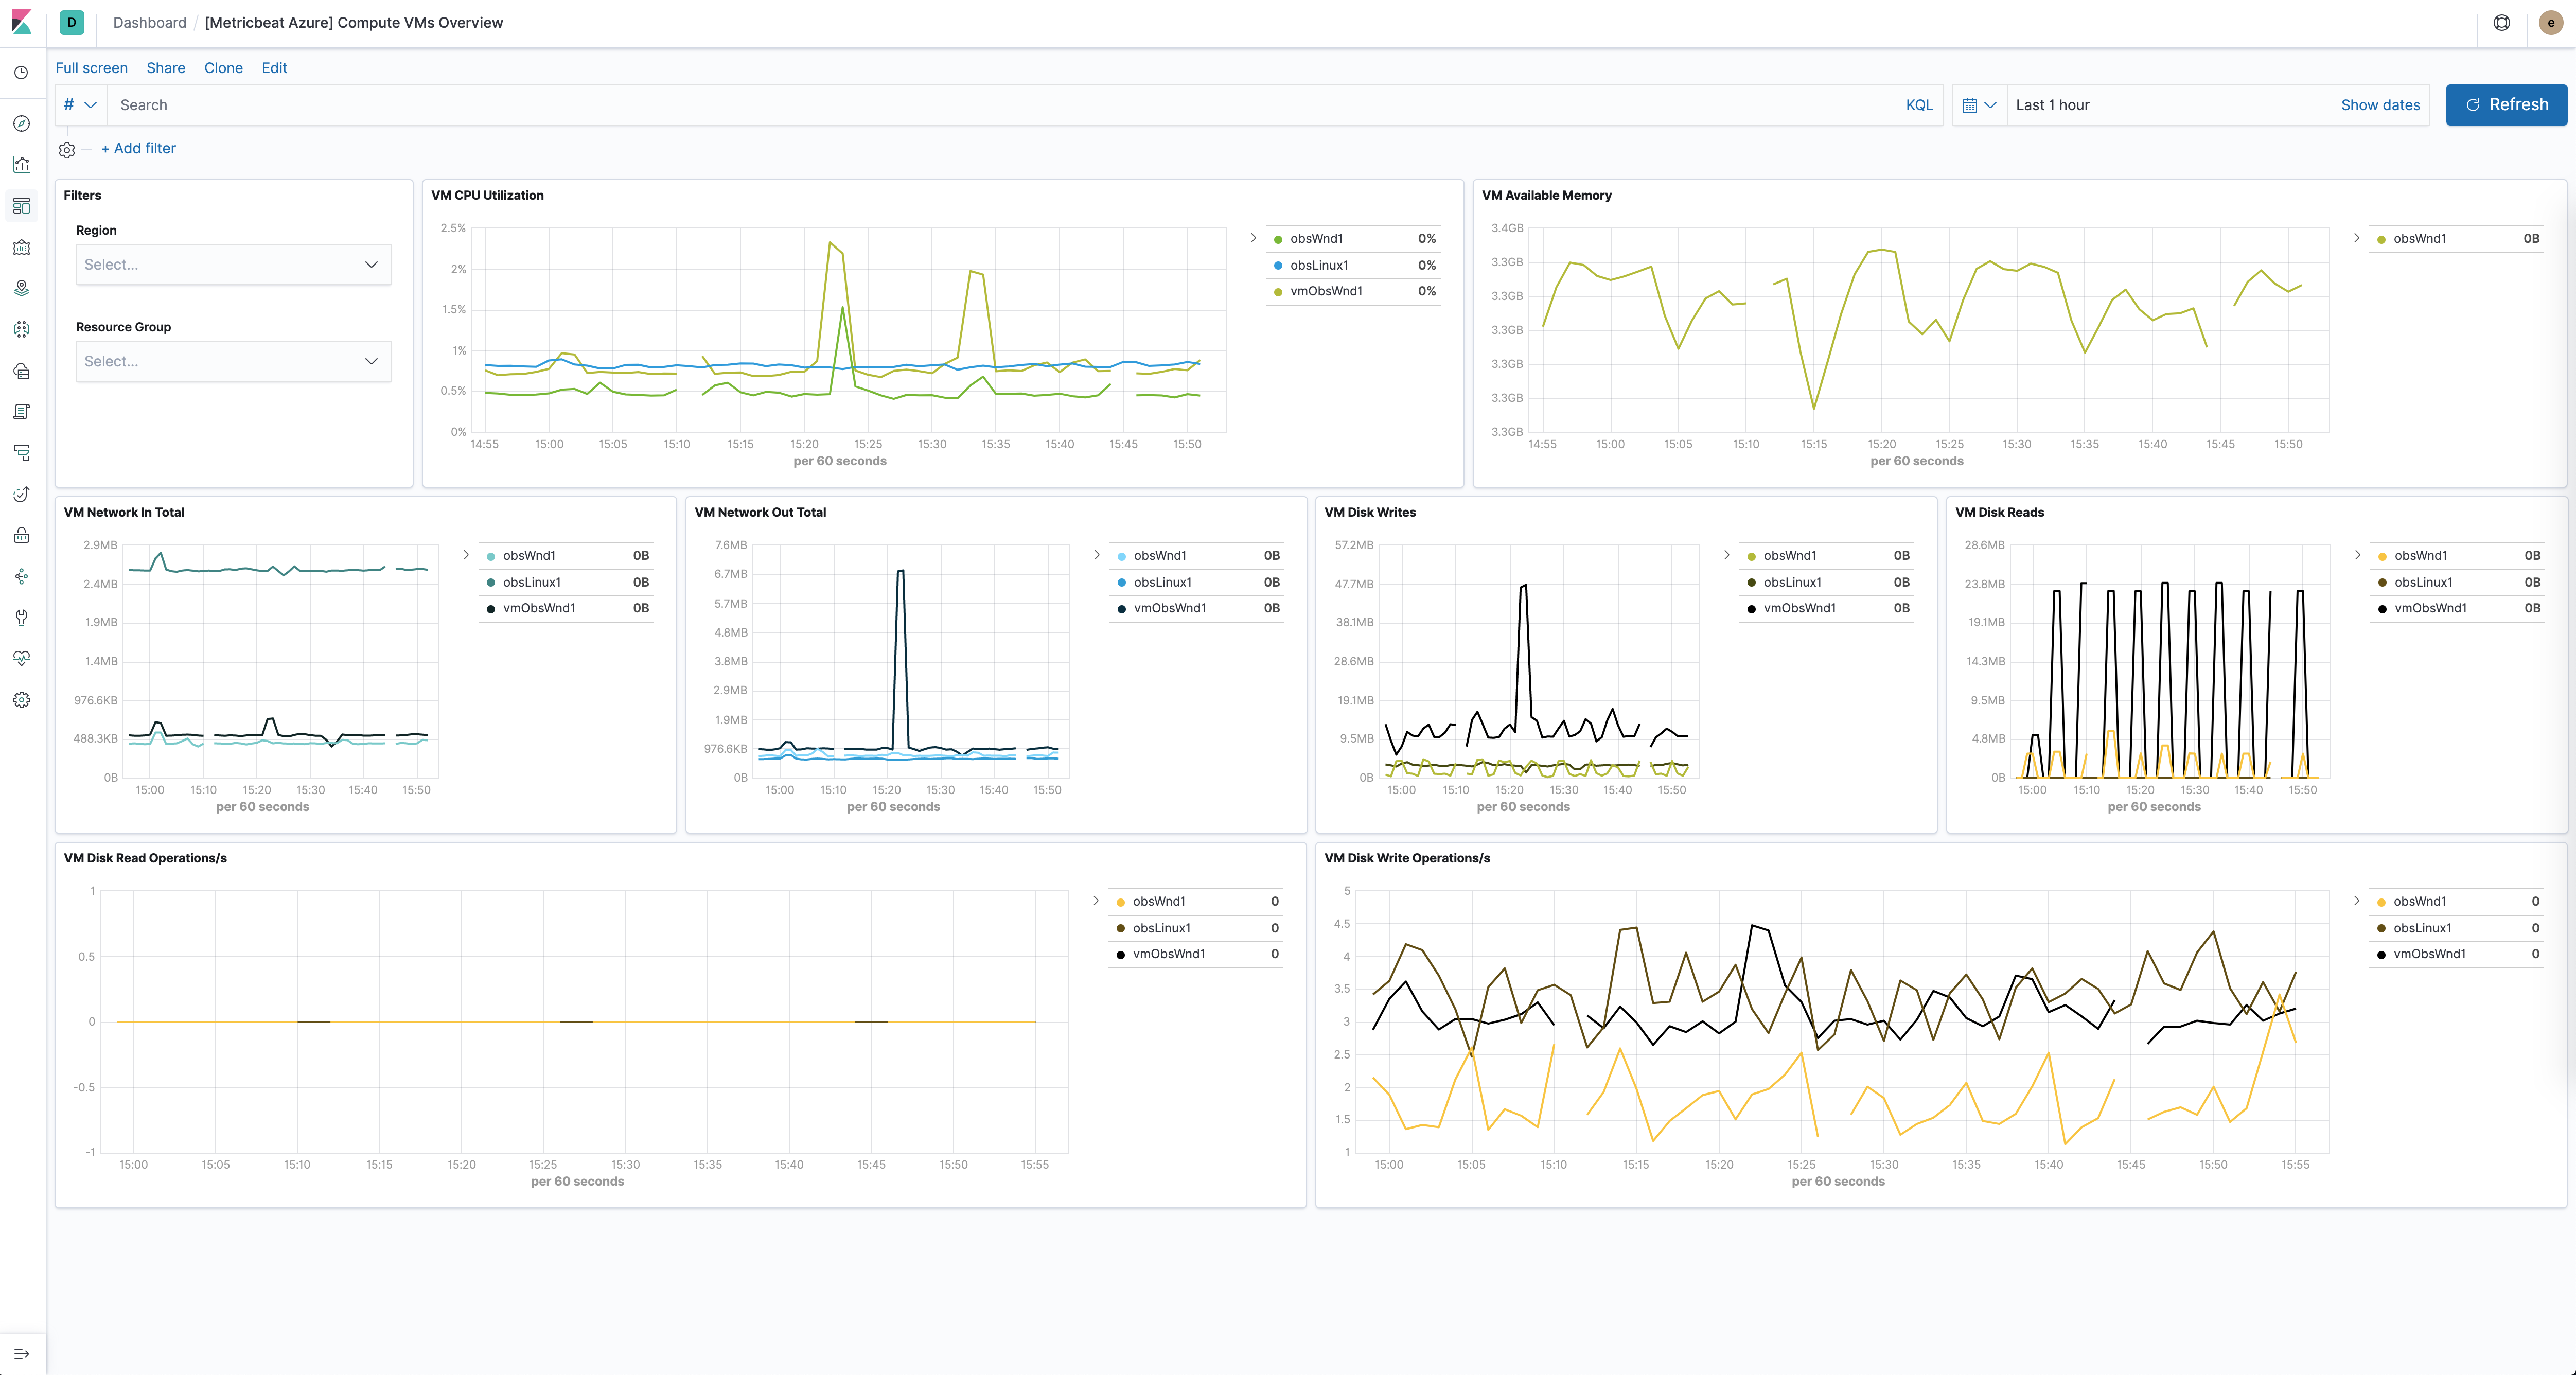
The VM overview dashboard shows information about CPU, memory, disk usage as well as operations per second. The two available filters help narrowing down the dashbord to specific regions and/or resource groups. For example:
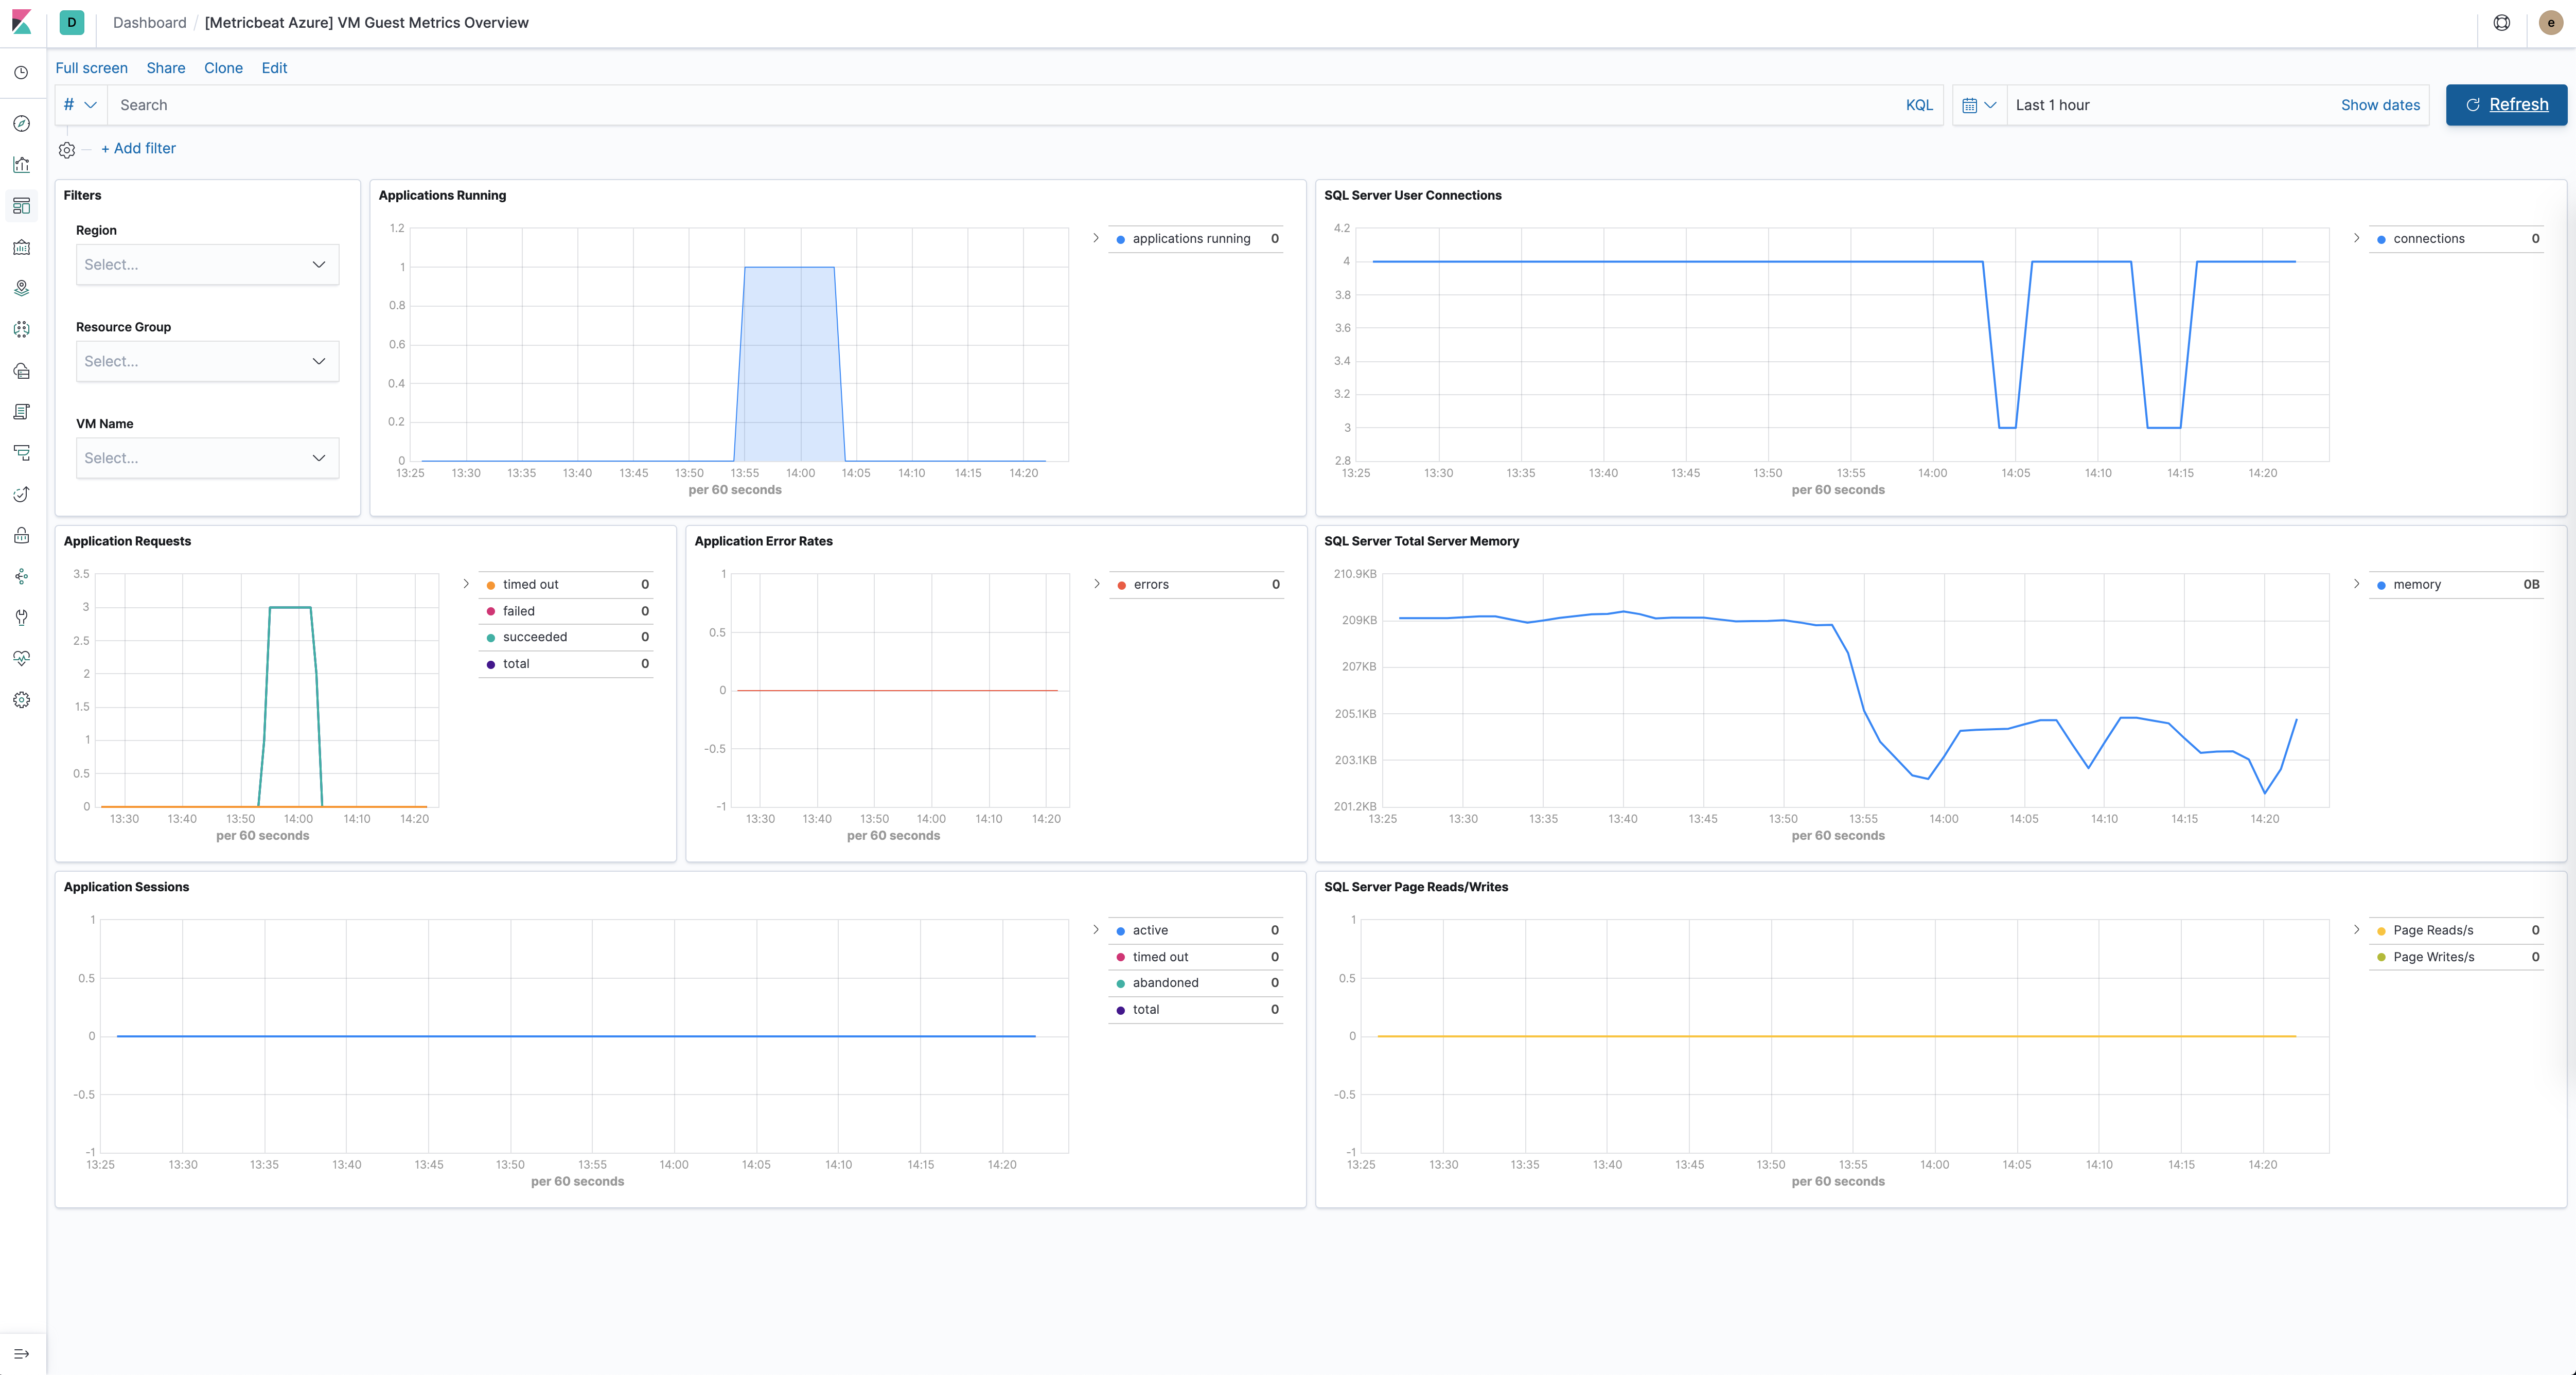
If VM guest metrics are enabled then the guest metrics overview dashboard can help with monitoring ASP.NET applications and SQL Server metrics. For example:
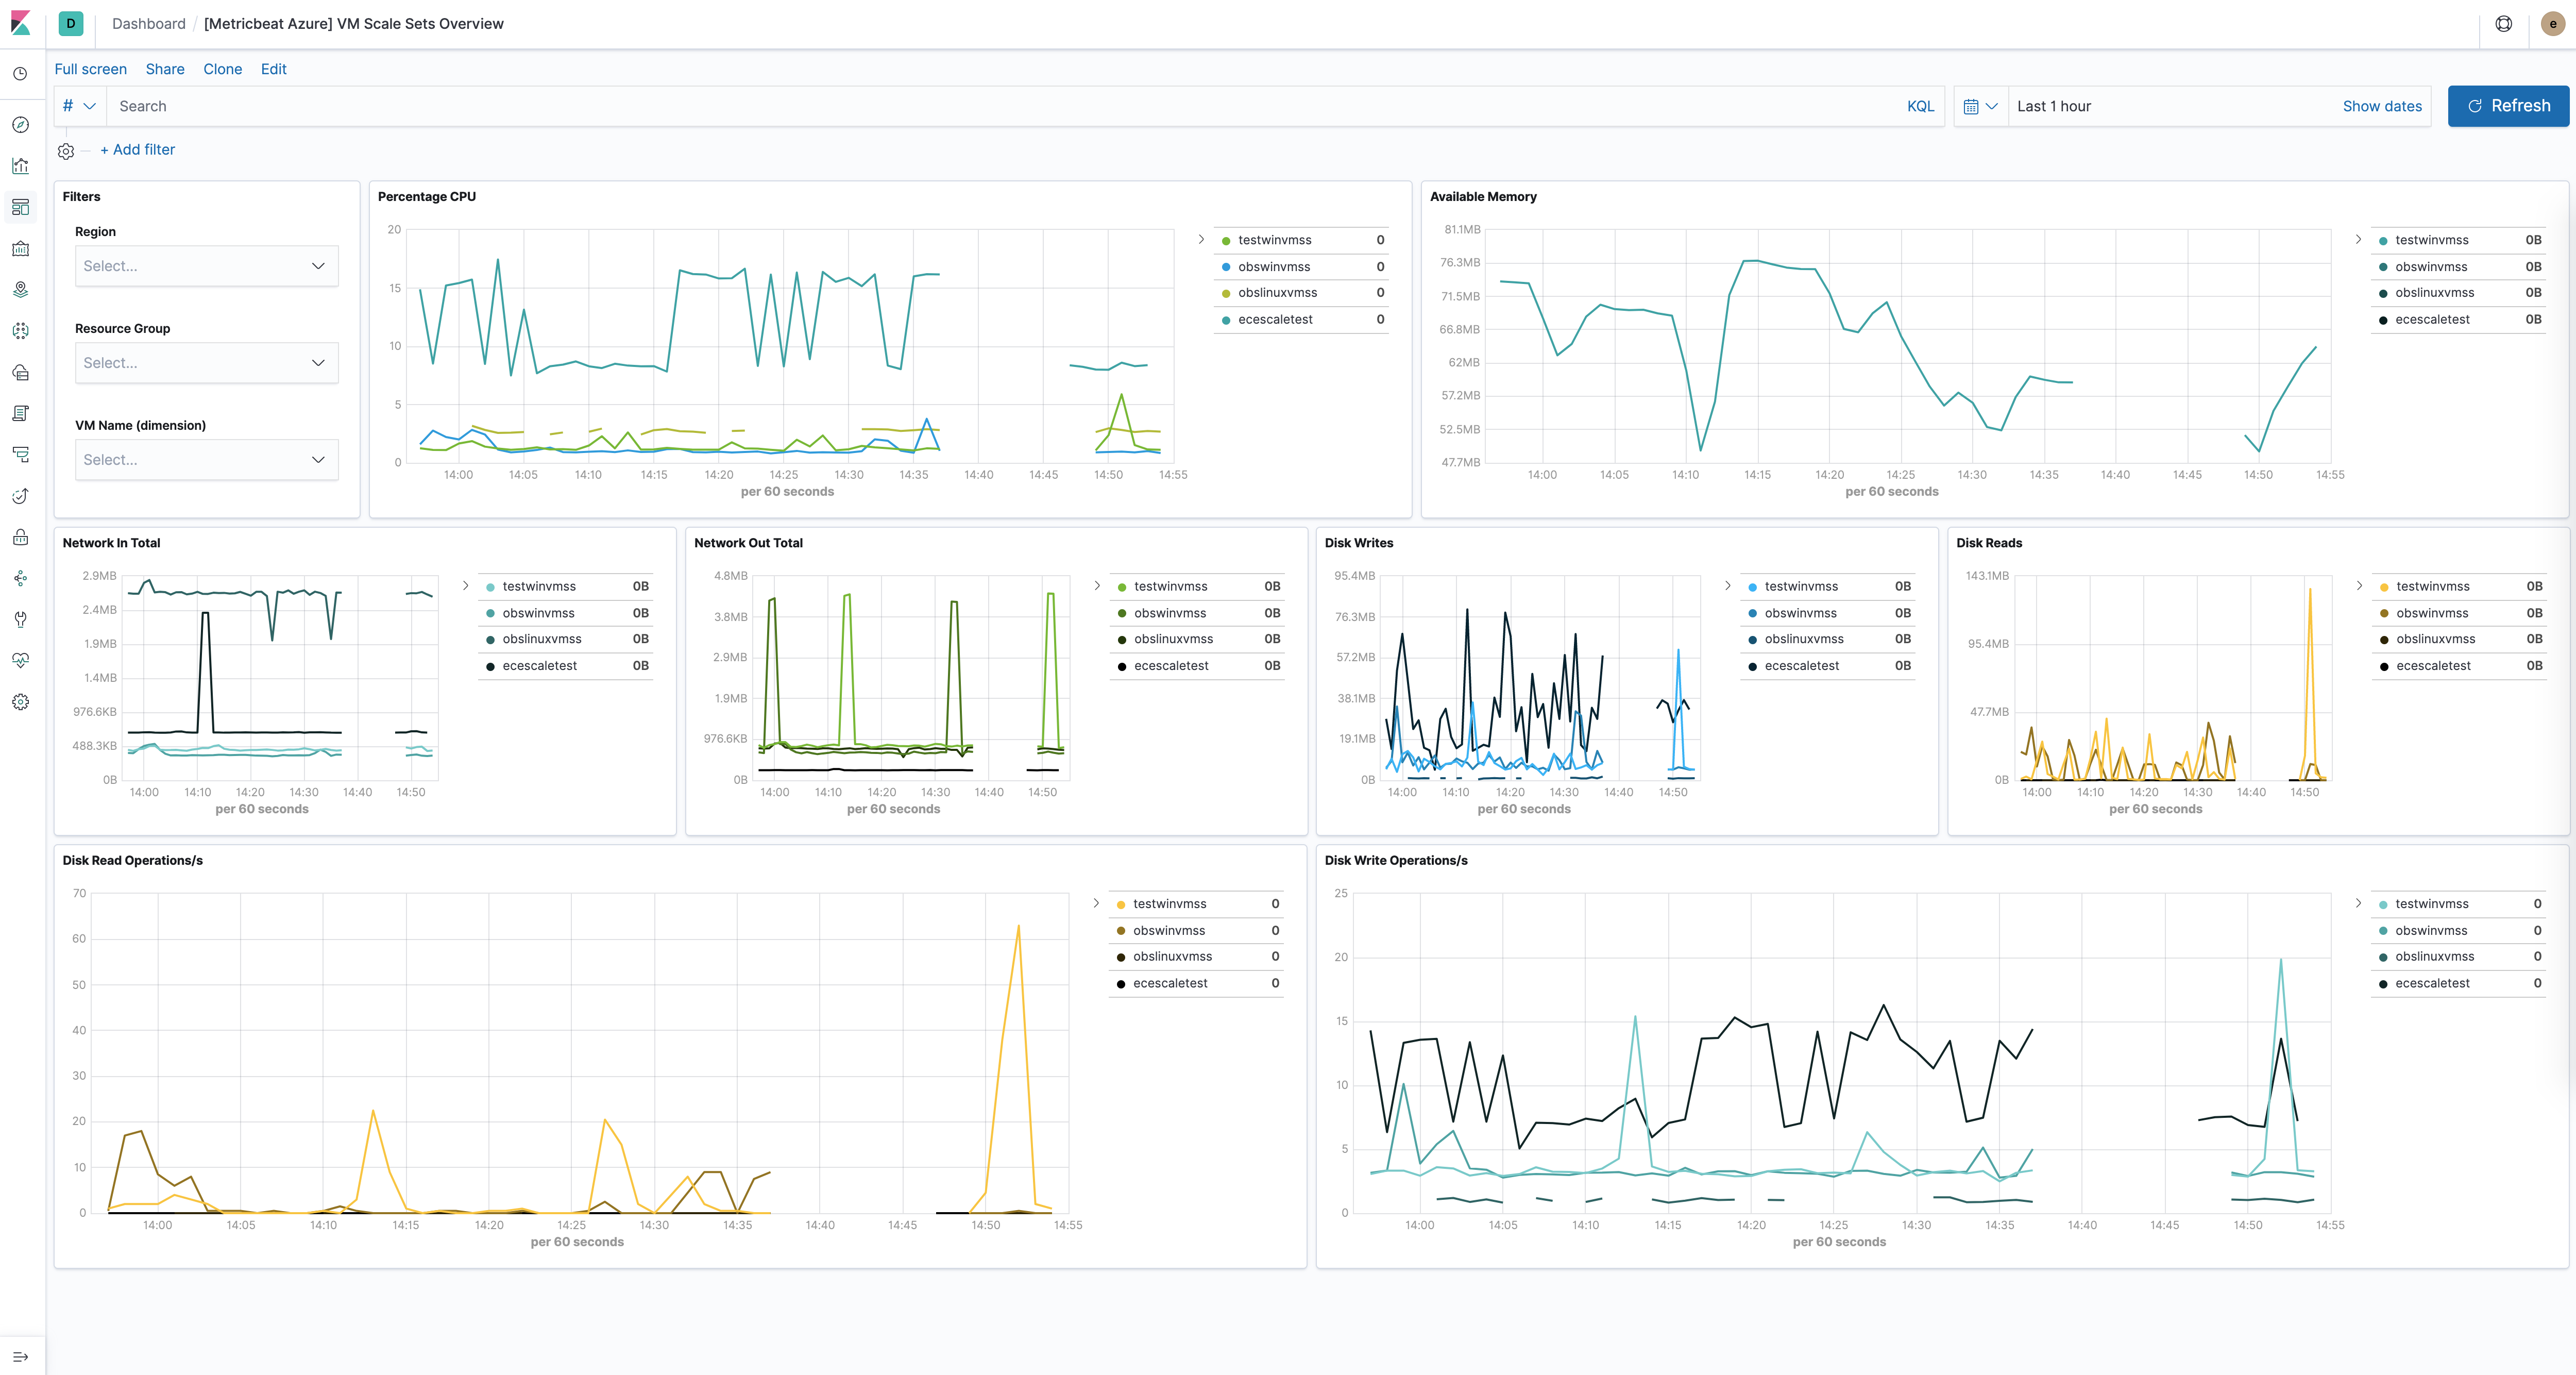
The virtual machine scale sets dashboard is similar to the VM dashboard and shows relevant health information about running vm scale sets. For example:
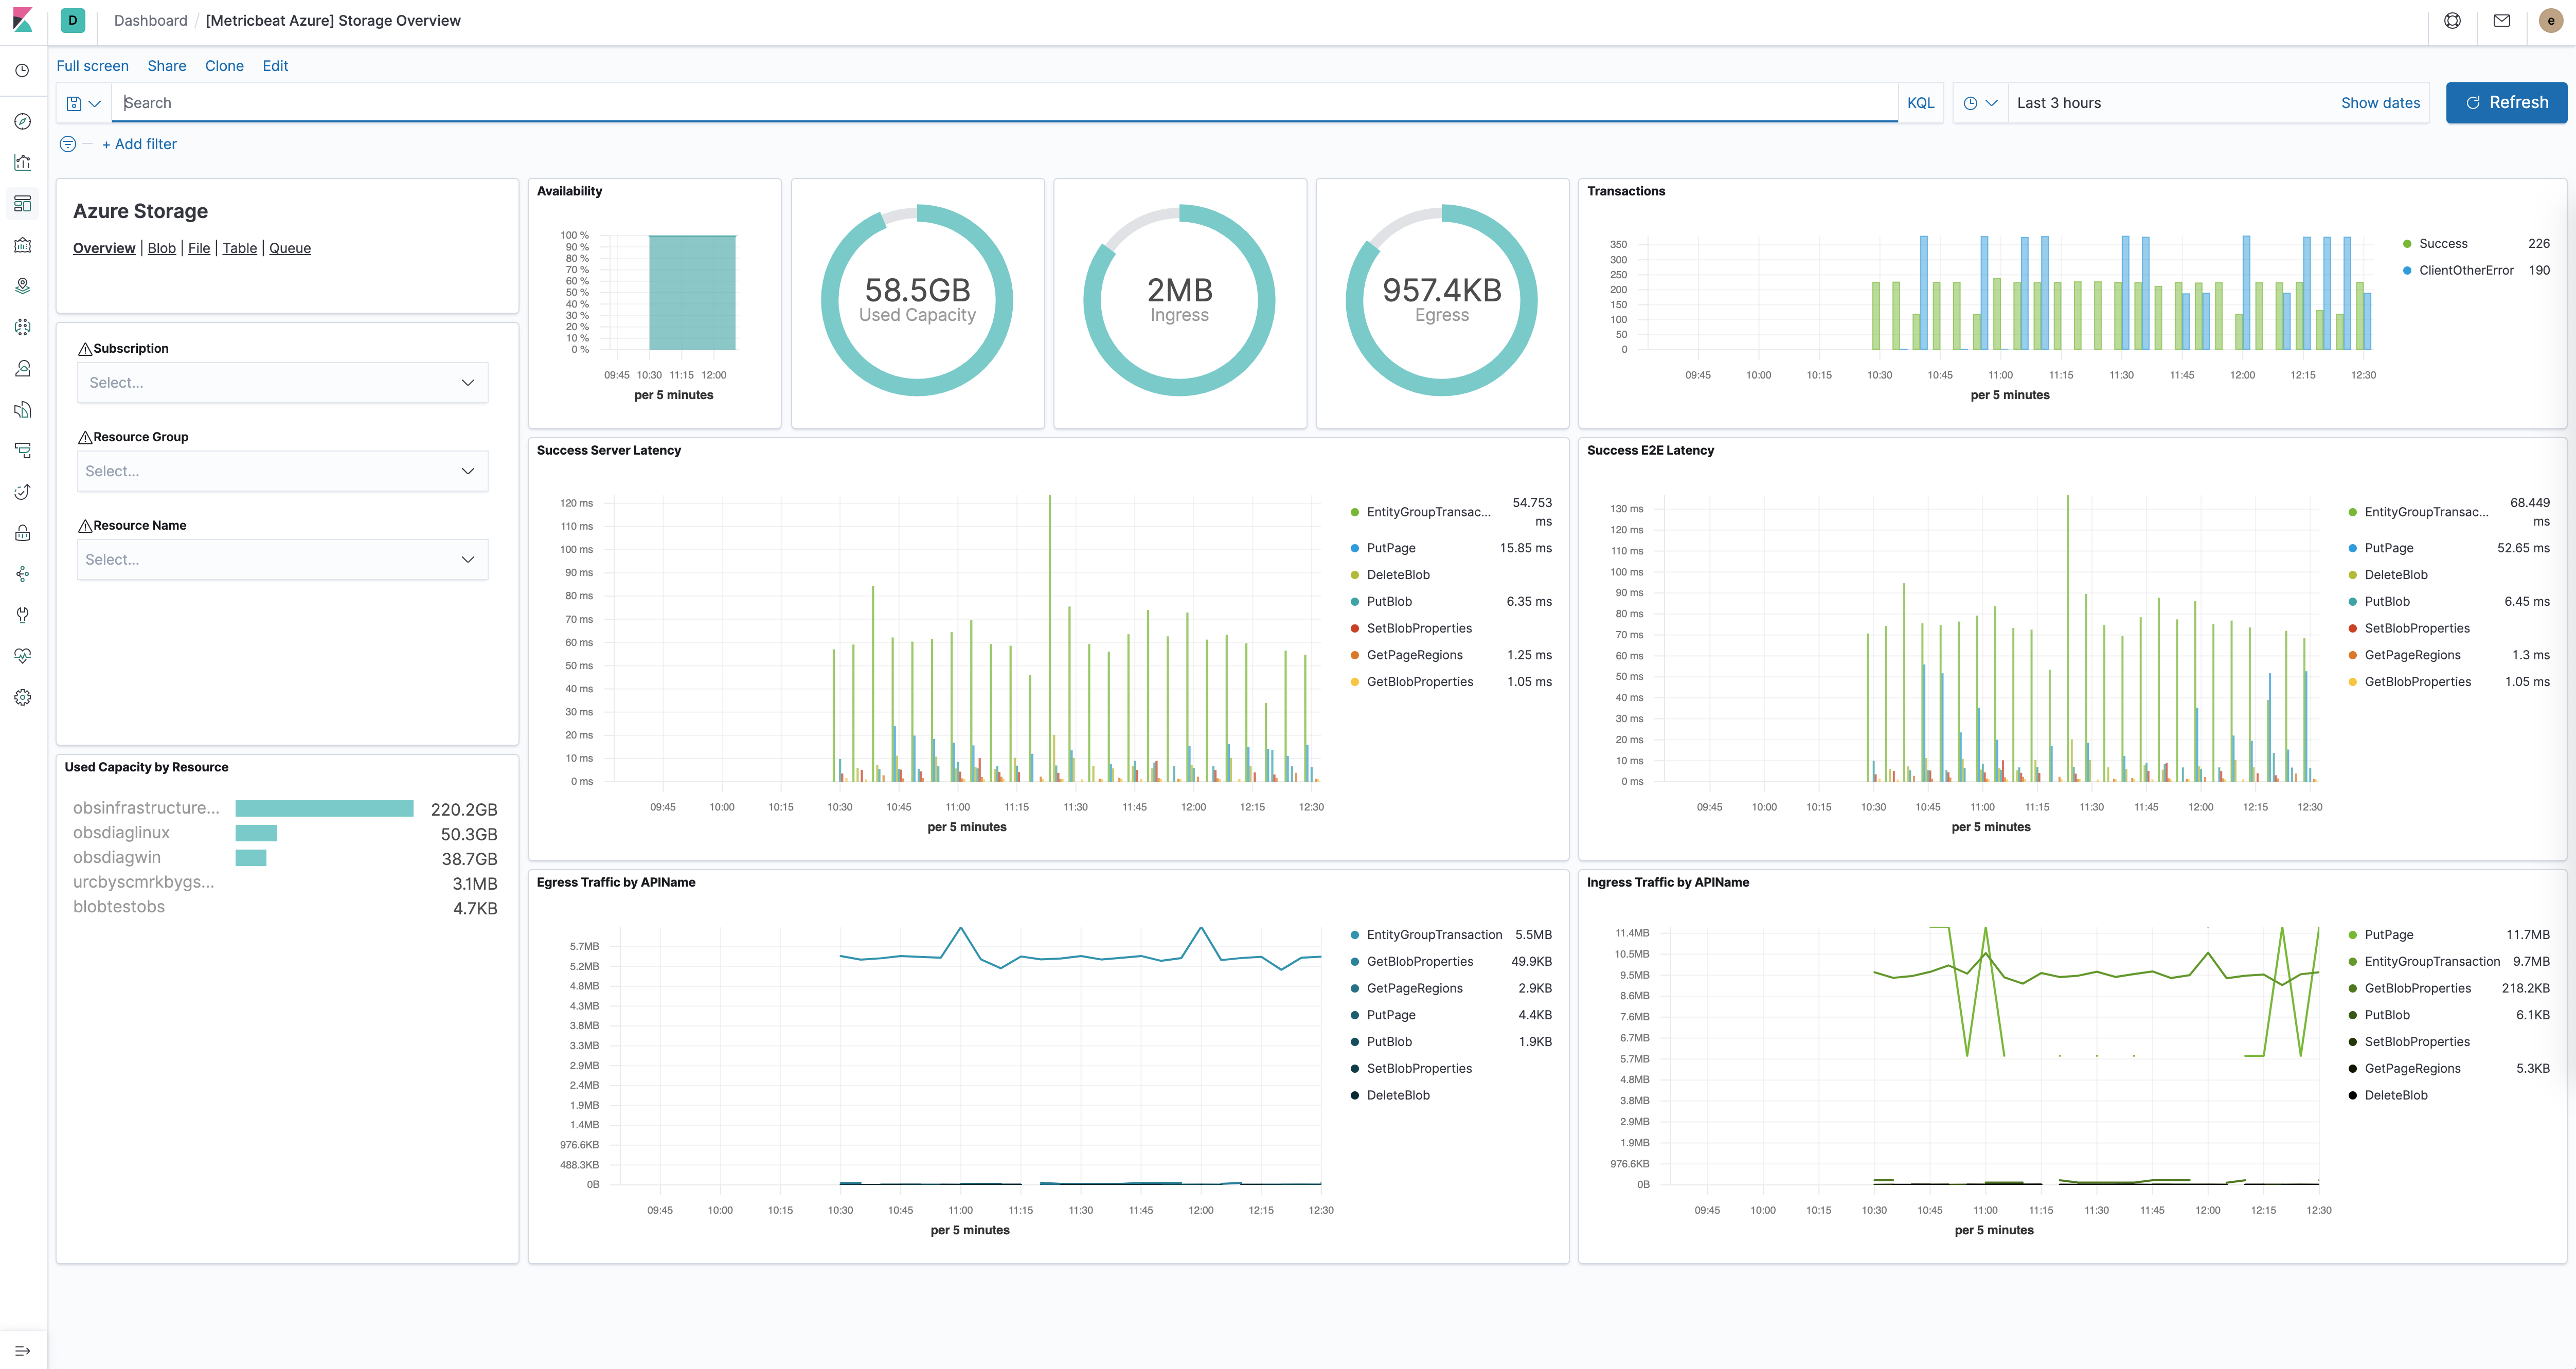
The Azure storage dashboards show all relevant metrics for the blob, file, table and queue storage services:
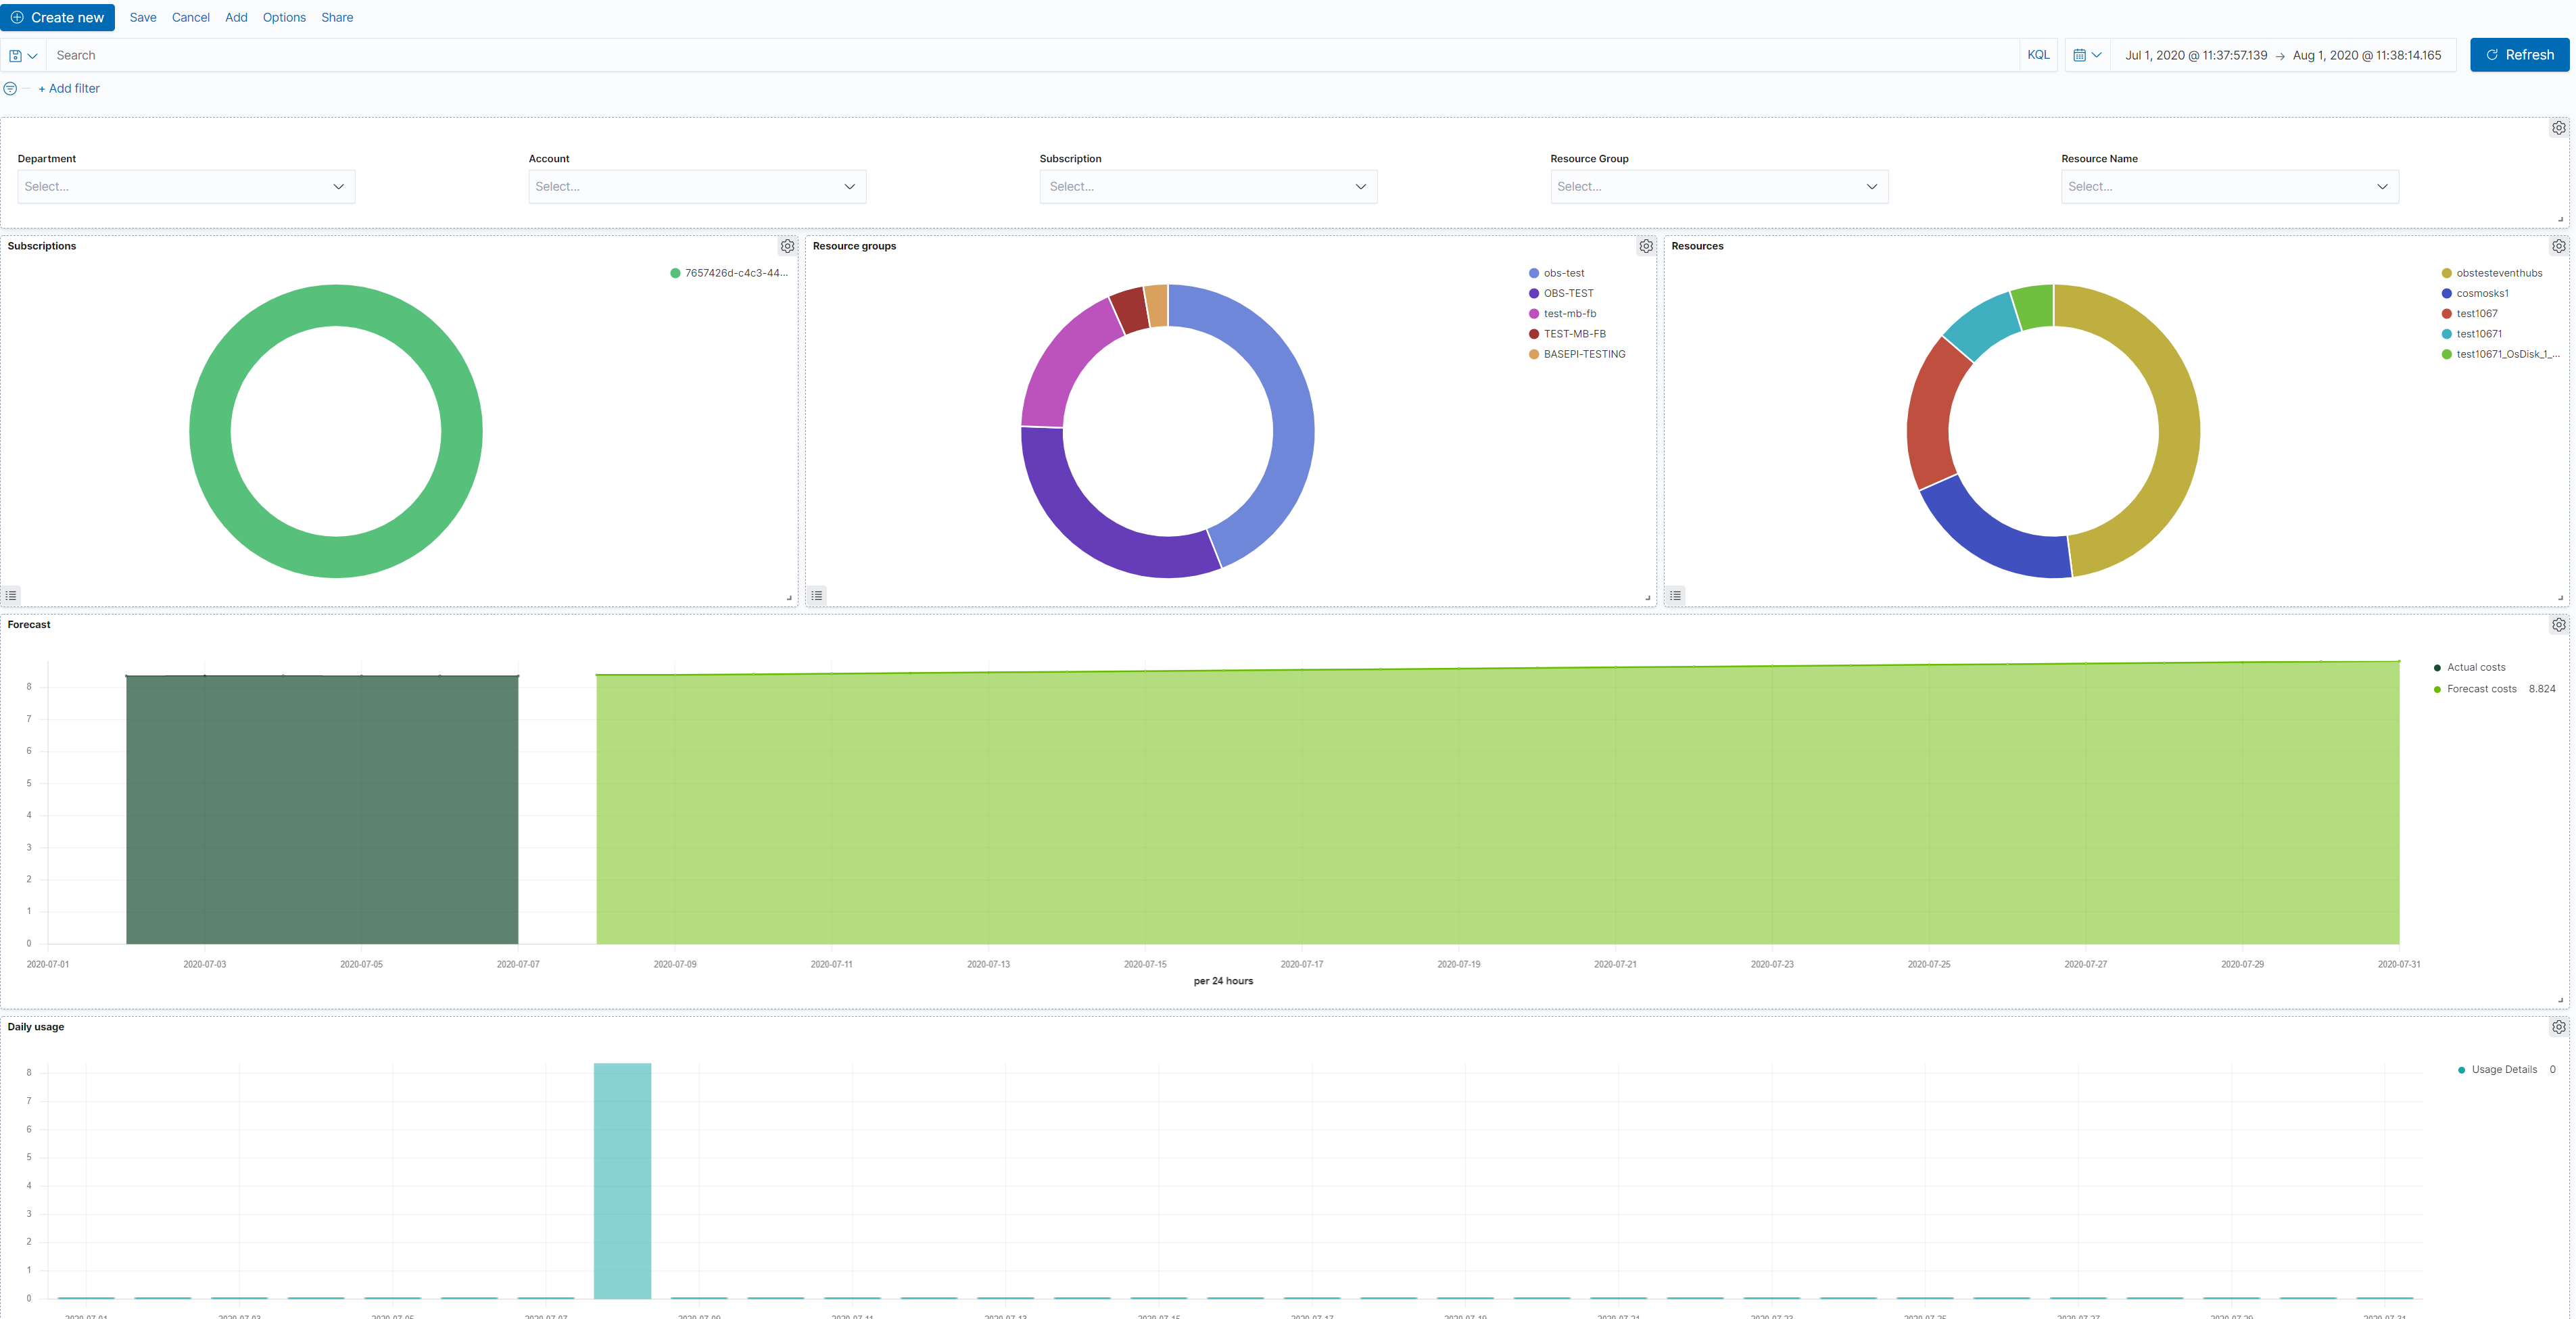
The Azure billing dashboards show relevant usage and forecast information:
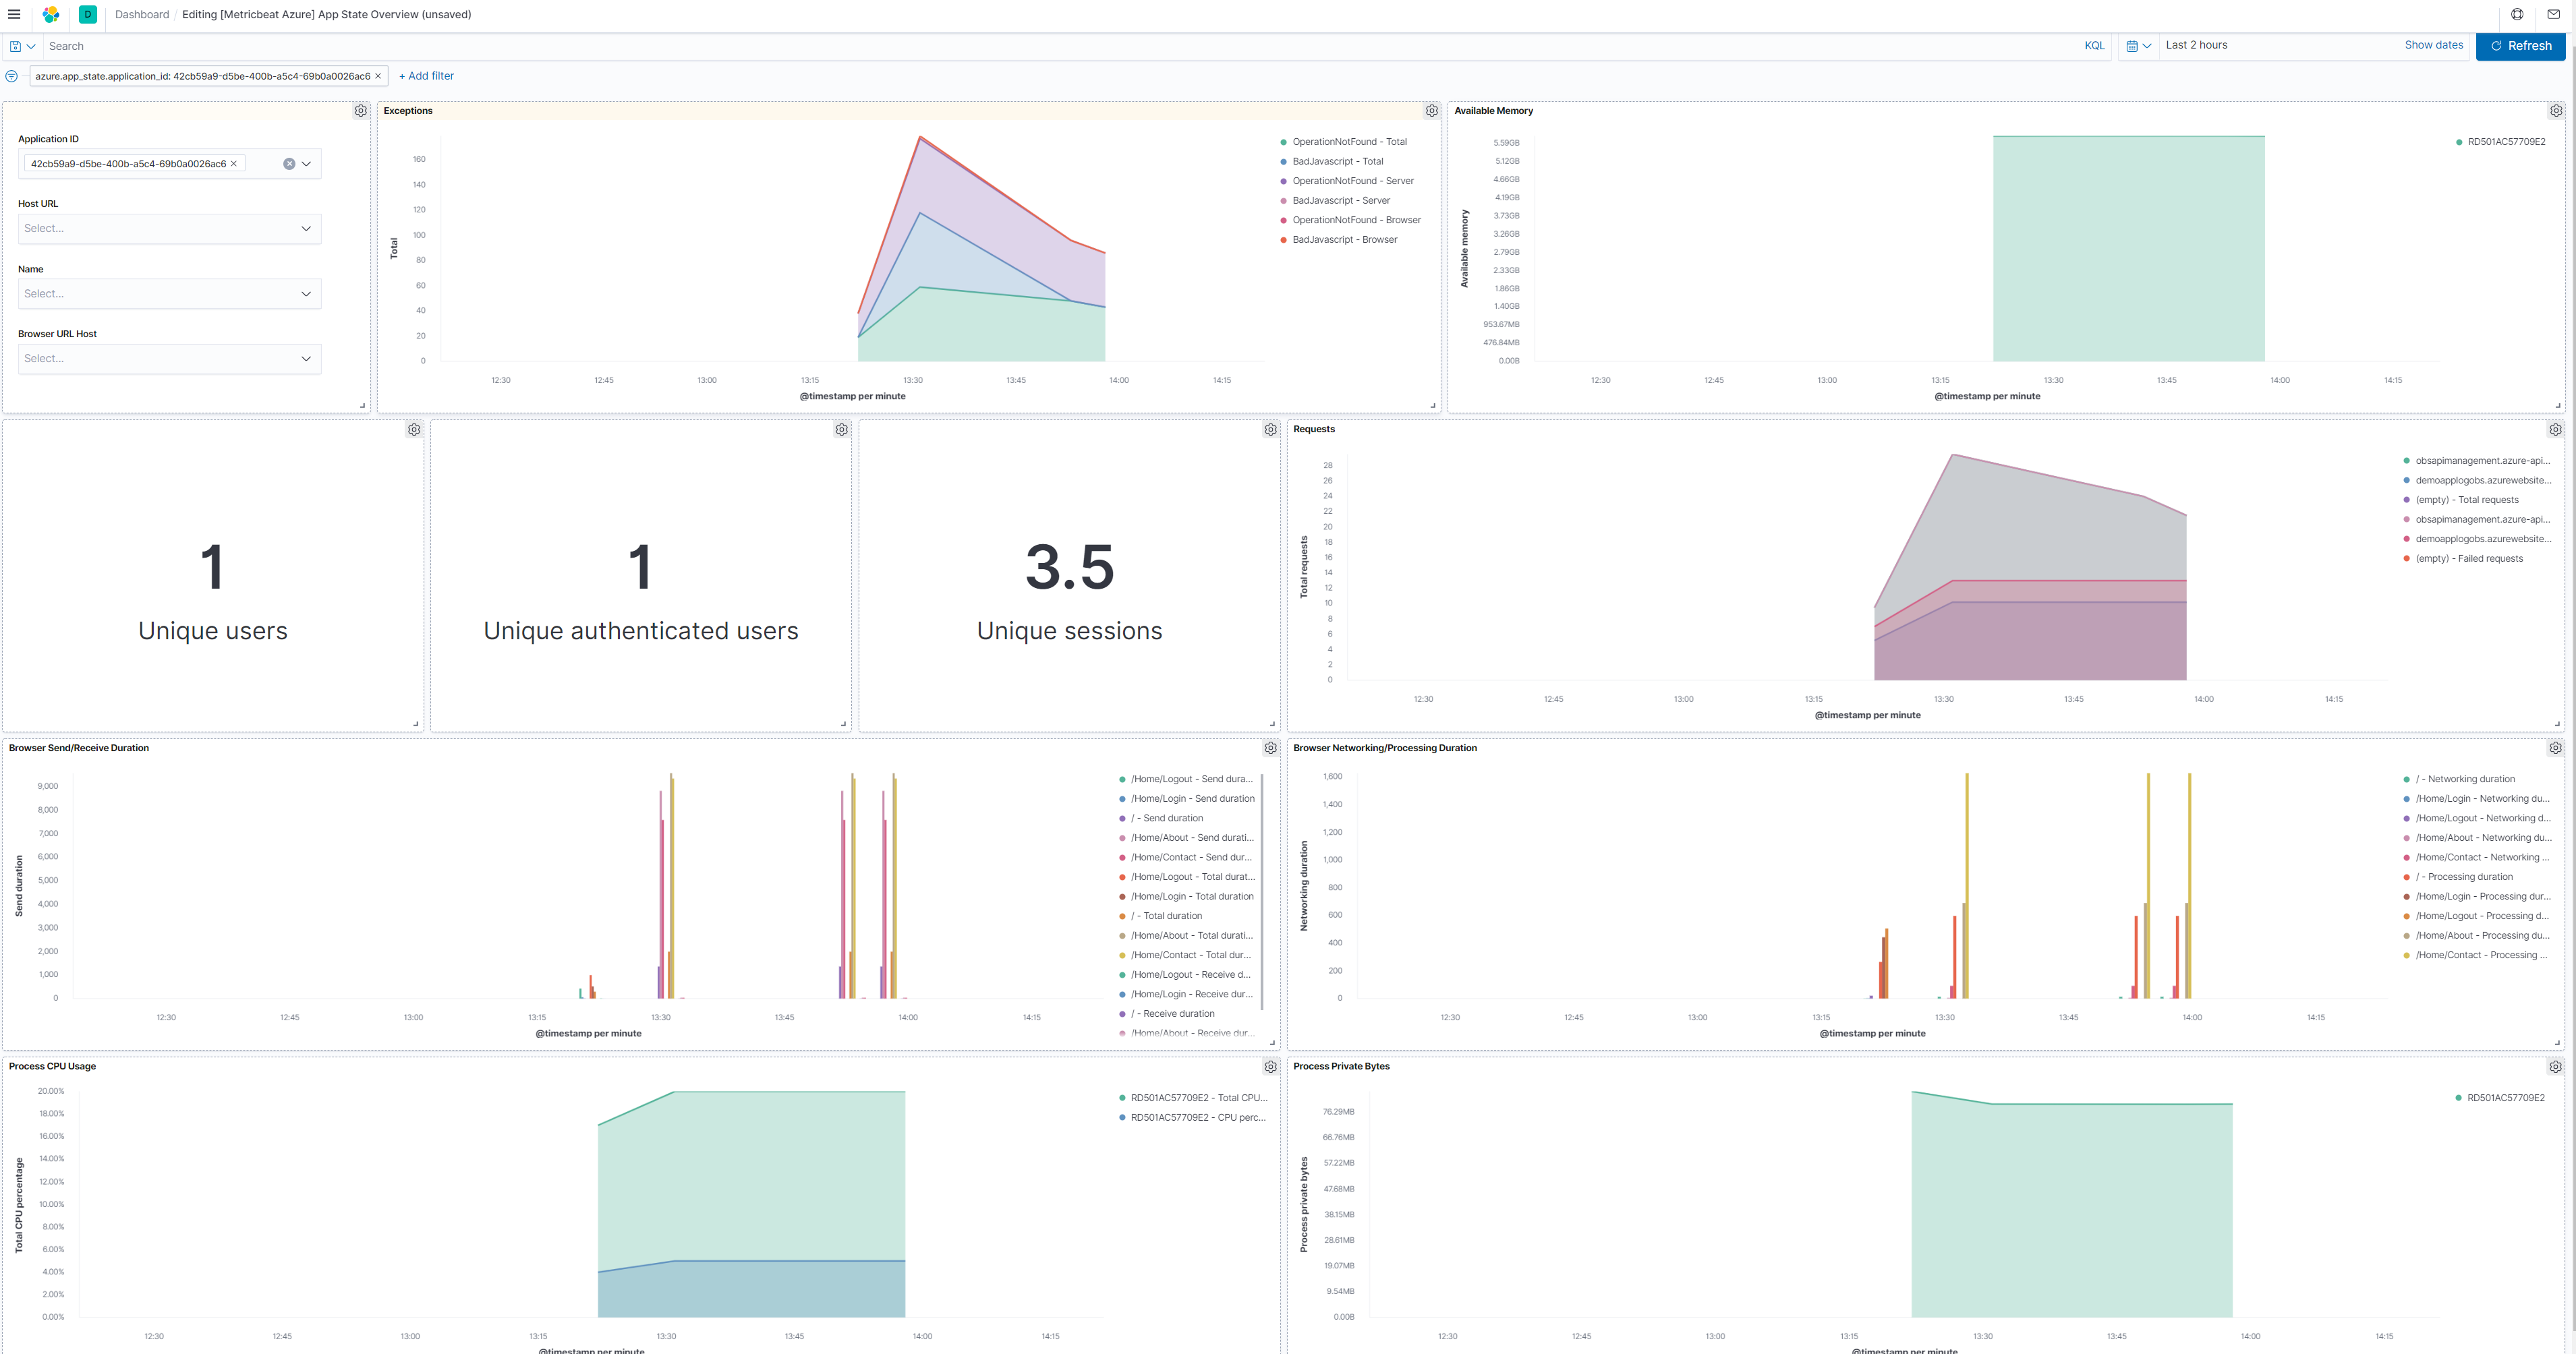
The Azure app_state dashboard shows relevant application insights information:
Module-specific configuration notes
editAll the tasks executed against the Azure Monitor REST API will use the Azure Resource Manager authentication model. Therefore, all requests must be authenticated with Azure Active Directory (Azure AD). One approach to authenticate the client application is to create an Azure AD service principal and retrieve the authentication (JWT) token. For a more detailed walk-through, have a look at using Azure PowerShell to create a service principal to access resources https://docs.microsoft.com/en-us/powershell/azure/create-azure-service-principal-azureps?view=azps-2.7.0. It is also possible to create a service principal via the Azure portal https://docs.microsoft.com/en-us/azure/active-directory/develop/howto-create-service-principal-portal. Users will have to make sure the roles assigned to the application contain at least reading permissions to the monitor data, more on the roles here https://docs.microsoft.com/en-us/azure/role-based-access-control/built-in-roles.
Required credentials for the azure module:
-
client_id - The unique identifier for the application (also known as Application Id)
-
client_secret - The client/application secret/key
-
subscription_id - The unique identifier for the azure subscription
-
tenant_id - The unique identifier of the Azure Active Directory instance
The azure credentials keys can be used if configured AZURE_CLIENT_ID, AZURE_CLIENT_SECRET, AZURE_TENANT_ID, AZURE_SUBSCRIPTION_ID
-
resource_manager_endpoint - string Optional, by default the azure public environment will be used, to override, users can provide a specific resource manager endpoint in order to use a different azure environment. Ex: https://management.chinacloudapi.cn for azure ChinaCloud https://management.microsoftazure.de for azure GermanCloud https://management.azure.com for azure PublicCloud https://management.usgovcloudapi.net for azure USGovernmentCloud
-
active_directory_endpoint - string Optional, by default the associated active directory endpoint to the resource manager endpoint will be used, to override, users can provide a specific active directory endpoint in order to use a different azure environment. Ex: https://login.microsoftonline.com for azure ChinaCloud https://login.microsoftonline.us for azure GermanCloud https://login.chinacloudapi.cn for azure PublicCloud https://login.microsoftonline.de for azure USGovernmentCloud
-
resource_manager_audience - string Optional, by default we are using the azure public environment, to override, users can provide a specific resource manager audience in order to use a different azure environment. Ex: https://management.chinacloudapi.cn/ for azure ChinaCloud https://management.microsoftazure.de/ for azure GermanCloud https://management.azure.com/ for azure PublicCloud https://management.usgovcloudapi.net/ for azure USGovernmentCloud Users can also use this in case of a Hybrid Cloud model, where one may define their own audiences.
Metricsets
editmonitor
editThis metricset allows users to retrieve metrics from specified resources. Added filters can apply here as the interval of retrieving these metrics, metric names,
aggregation list, namespaces and metric dimensions. The monitor metrics will have a minimum timegrain of 5 minutes, so the period for monitor metricset should be 300s or multiples of 300s.
compute_vm
editThis metricset will collect metrics from the virtual machines, these metrics will have a timegrain every 5 minutes,
so the period for compute_vm metricset should be 300s or multiples of 300s.
compute_vm_scaleset
editThis metricset will collect metrics from the virtual machine scalesets, these metrics will have a timegrain every 5 minutes,
so the period for compute_vm_scaleset metricset should be 300s or multiples of 300s.
storage
editThis metricset will collect metrics from the storage accounts, these metrics will have a timegrain every 5 minutes,
so the period for storage metricset should be 300s or multiples of 300s.
container_instance
editThis metricset will collect metrics from specified container groups, these metrics will have a timegrain every 5 minutes,
so the period for container_instance metricset should be 300s or multiples of 300s.
container_registry
editThis metricset will collect metrics from the container registries, these metrics will have a timegrain every 5 minutes,
so the period for container_registry metricset should be 300s or multiples of 300s.
container_service
editThis metricset will collect metrics from the container services, these metrics will have a timegrain every 5 minutes,
so the period for container_service metricset should be 300s or multiples of 300s.
database_account
editThis metricset will collect relevant metrics from specified database accounts, these metrics will have a timegrain every 5 minutes,
so the period for database_account metricset should be 300s or multiples of 300s.
billing
editThis metricset will collect relevant usage data and forecast information from a specific subscription, these metrics will have a timegrain every 24 hours,
so the period for billing metricset should be 24h or multiples of 24h.
app_insights
editThis metricset will collect application insights metrics, the period (interval) for the app-insights metricset is set by default at 300s.
app_state
editThis metricset concentrate on the most relevant application insights metrics and provides a dashboard for visualization, the period (interval) for the app_state metricset is set by default at 300s.
Additional notes about metrics and costs
editCosts: Metric queries are charged based on the number of standard API calls. More information on pricing here https://azure.microsoft.com/id-id/pricing/details/monitor/.
Authentication: we are handling authentication on our side (creating/renewing the authentication token), so we advise users to use dedicated credentials for metricbeat only.
The Azure module supports the standard configuration options that are described in Modules. Here is an example configuration:
metricbeat.modules:
- module: azure
  metricsets:
  - monitor
  enabled: true
  period: 300s
  client_id: '${AZURE_CLIENT_ID:""}'
  client_secret: '${AZURE_CLIENT_SECRET:""}'
  tenant_id: '${AZURE_TENANT_ID:""}'
  subscription_id: '${AZURE_SUBSCRIPTION_ID:""}'
  resources:
    - resource_query: "resourceType eq 'Microsoft.DocumentDb/databaseAccounts'"
      metrics:
      - name: ["DataUsage", "DocumentCount", "DocumentQuota"]
        namespace: "Microsoft.DocumentDb/databaseAccounts"

- module: azure
  metricsets:
  - compute_vm
  enabled: true
  period: 300s
  client_id: '${AZURE_CLIENT_ID:""}'
  client_secret: '${AZURE_CLIENT_SECRET:""}'
  tenant_id: '${AZURE_TENANT_ID:""}'
  subscription_id: '${AZURE_SUBSCRIPTION_ID:""}'

- module: azure
  metricsets:
  - compute_vm_scaleset
  enabled: true
  period: 300s
  client_id: '${AZURE_CLIENT_ID:""}'
  client_secret: '${AZURE_CLIENT_SECRET:""}'
  tenant_id: '${AZURE_TENANT_ID:""}'
  subscription_id: '${AZURE_SUBSCRIPTION_ID:""}'

- module: azure
  metricsets:
  - storage
  enabled: true
  period: 300s
  client_id: '${AZURE_CLIENT_ID:""}'
  client_secret: '${AZURE_CLIENT_SECRET:""}'
  tenant_id: '${AZURE_TENANT_ID:""}'
  subscription_id: '${AZURE_SUBSCRIPTION_ID:""}'

- module: azure
  metricsets:
  - container_instance
  enabled: true
  period: 300s
  client_id: '${AZURE_CLIENT_ID:""}'
  client_secret: '${AZURE_CLIENT_SECRET:""}'
  tenant_id: '${AZURE_TENANT_ID:""}'
  subscription_id: '${AZURE_SUBSCRIPTION_ID:""}'

- module: azure
  metricsets:
  - container_service
  enabled: true
  period: 300s
  client_id: '${AZURE_CLIENT_ID:""}'
  client_secret: '${AZURE_CLIENT_SECRET:""}'
  tenant_id: '${AZURE_TENANT_ID:""}'
  subscription_id: '${AZURE_SUBSCRIPTION_ID:""}'

- module: azure
  metricsets:
  - container_registry
  enabled: true
  period: 300s
  client_id: '${AZURE_CLIENT_ID:""}'
  client_secret: '${AZURE_CLIENT_SECRET:""}'
  tenant_id: '${AZURE_TENANT_ID:""}'
  subscription_id: '${AZURE_SUBSCRIPTION_ID:""}'

- module: azure
  metricsets:
  - database_account
  enabled: true
  period: 300s
  client_id: '${AZURE_CLIENT_ID:""}'
  client_secret: '${AZURE_CLIENT_SECRET:""}'
  tenant_id: '${AZURE_TENANT_ID:""}'
  subscription_id: '${AZURE_SUBSCRIPTION_ID:""}'

- module: azure
  metricsets:
    - billing
  enabled: true
  period: 24h
  client_id: '${AZURE_CLIENT_ID:""}'
  client_secret: '${AZURE_CLIENT_SECRET:""}'
  tenant_id: '${AZURE_TENANT_ID:""}'
  subscription_id: '${AZURE_SUBSCRIPTION_ID:""}'

- module: azure
  metricsets:
    - app_insights
  enabled: true
  period: 300s
  application_id: ''
  api_key: ''
  metrics:
    - id: ["requests/count", "requests/duration"]

- module: azure
  metricsets:
    - app_state
  enabled: true
  period: 300s
  application_id: ''
  api_key: ''
The following metricsets are available: