Microsoft Defender for Endpoint integration
| Version | 4.3.0 (View all) |
| Subscription level What's this? |
Basic |
| Developed by What's this? |
Elastic |
| Ingestion method(s) | API, File |
| Minimum Kibana version(s) | 9.1.2 8.19.3 |
This integration is for Microsoft Defender for Endpoint logs.
Microsoft Defender for Endpoint integration collects data for Alert, Machine, Machine Action, and Vulnerability logs using REST API.
This integration collects the following logs:
- Alert - Retrieves alerts generated by Microsoft Defender for Endpoint.
- Machine - Retrieves machines that have communicated with Microsoft Defender for Endpoint.
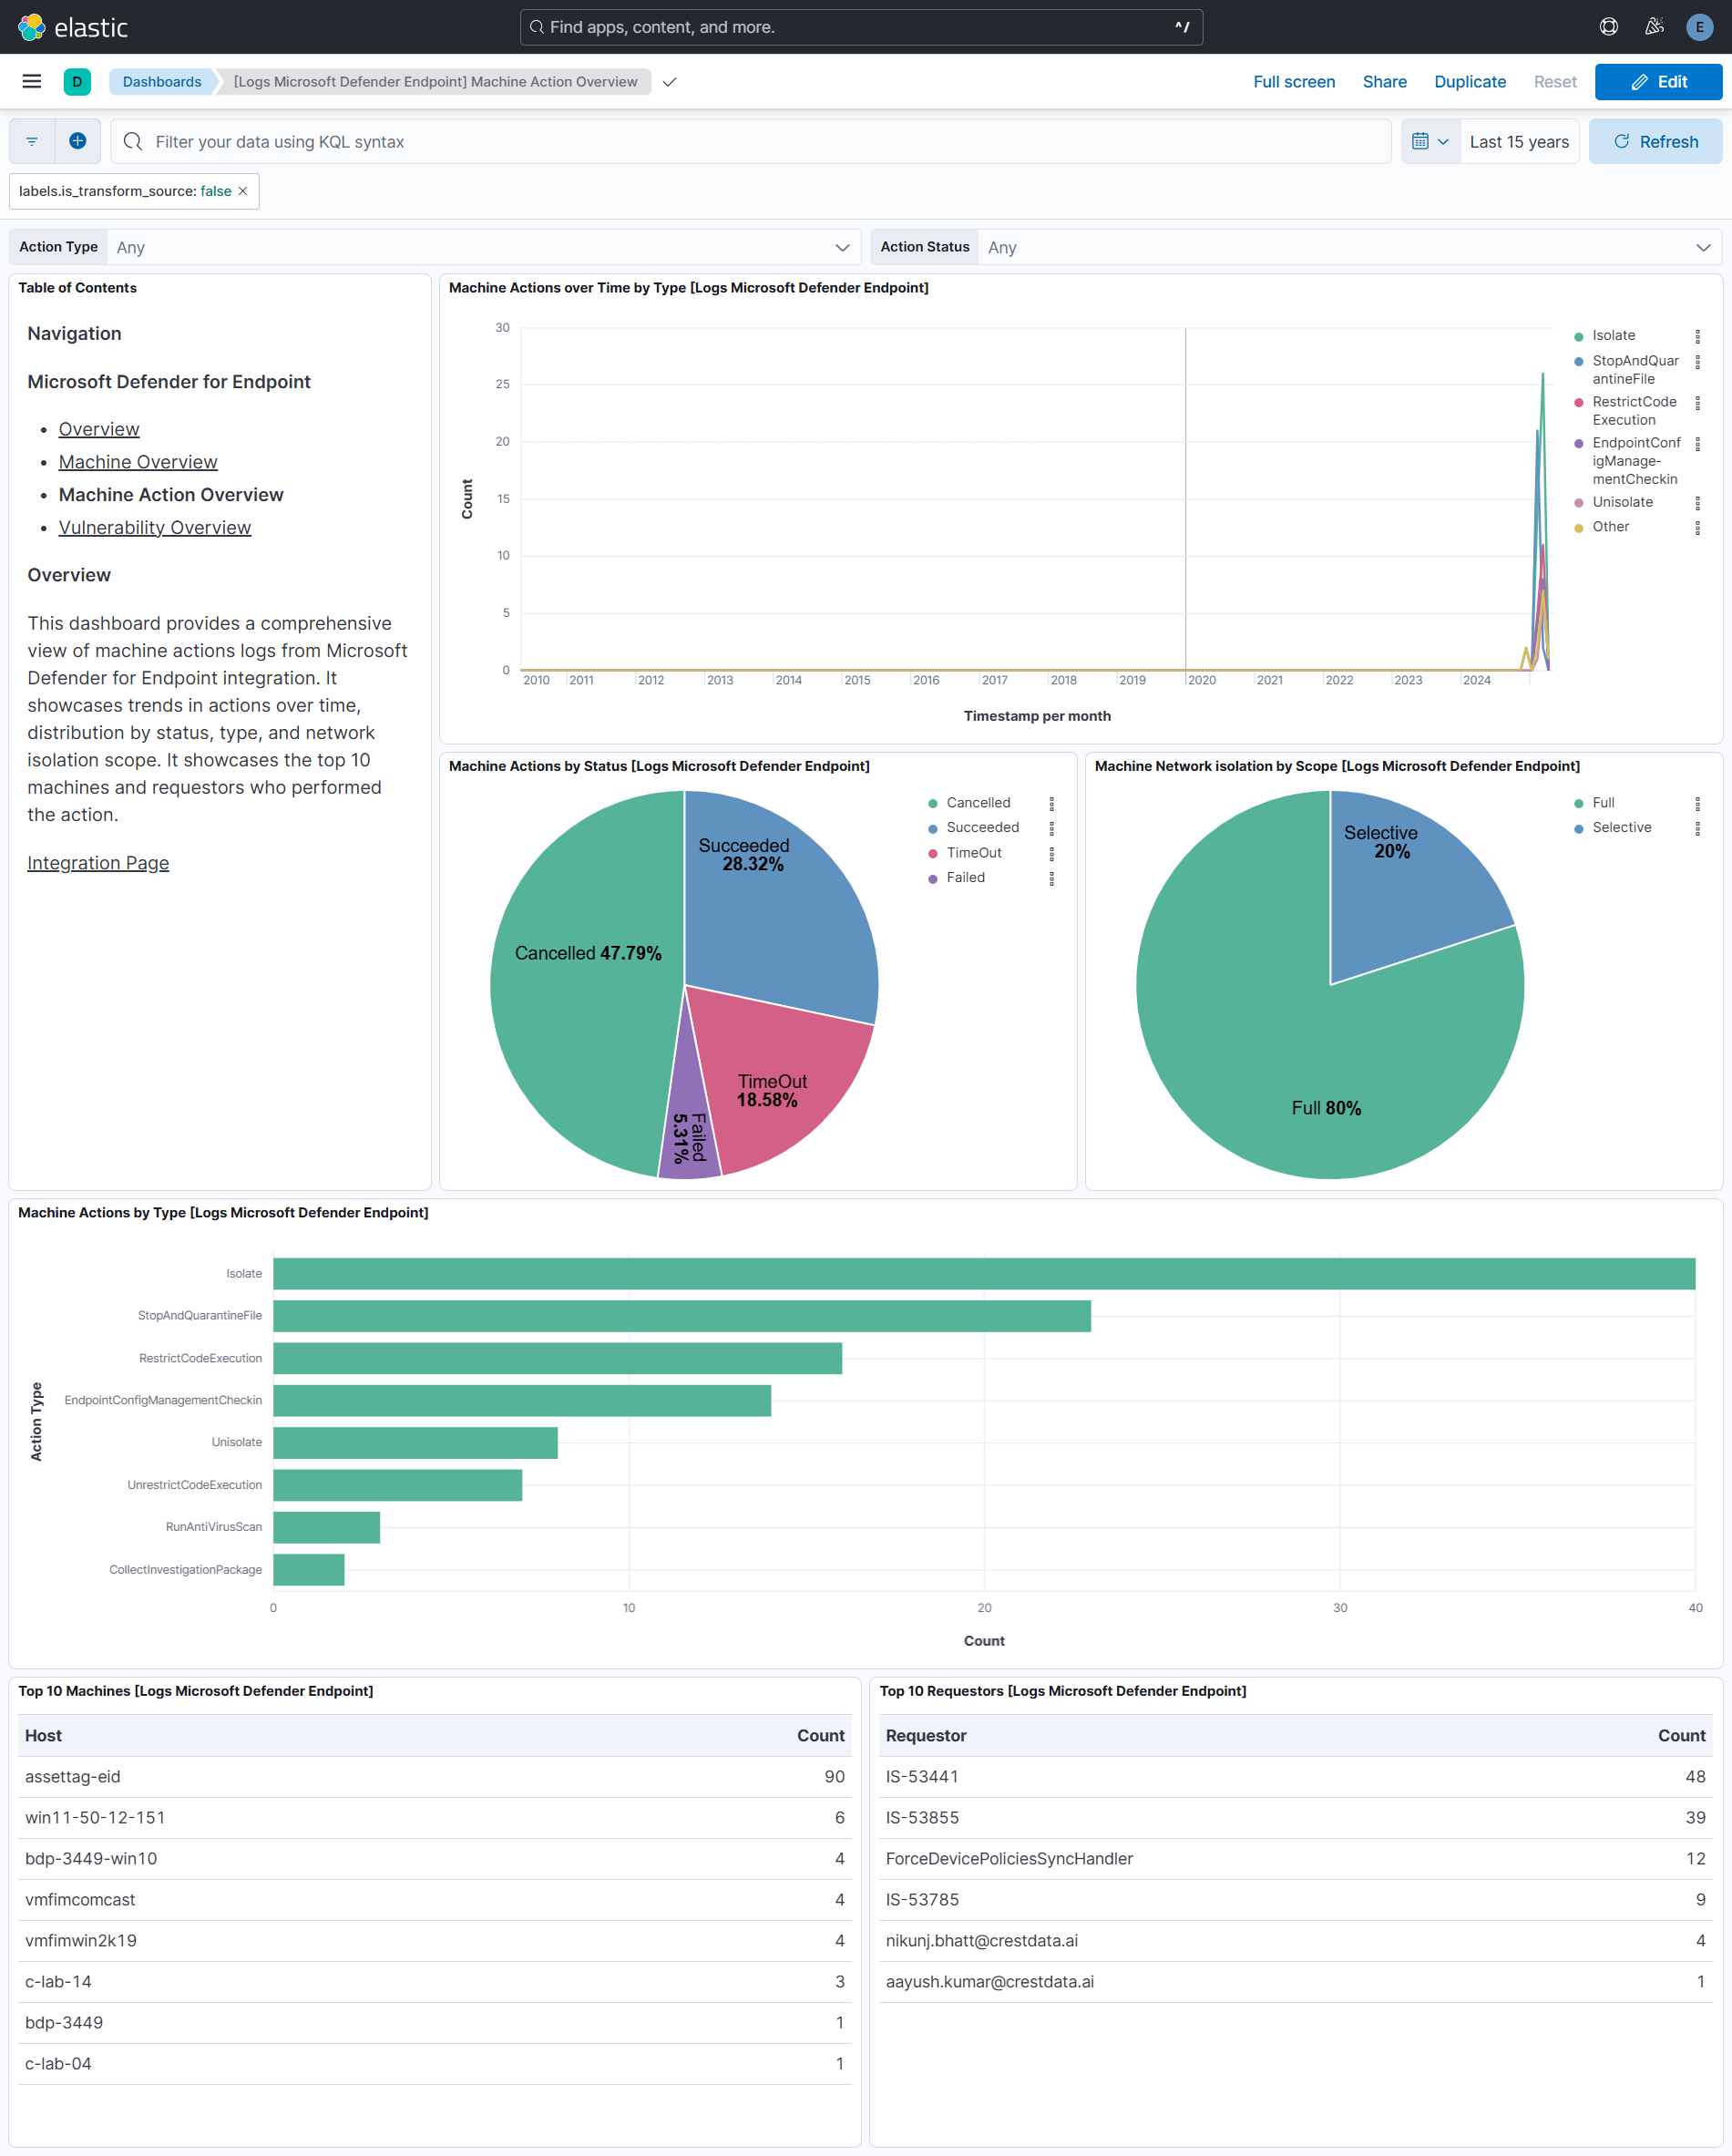
- Machine Action - Retrieves logs of actions carried out on machines.
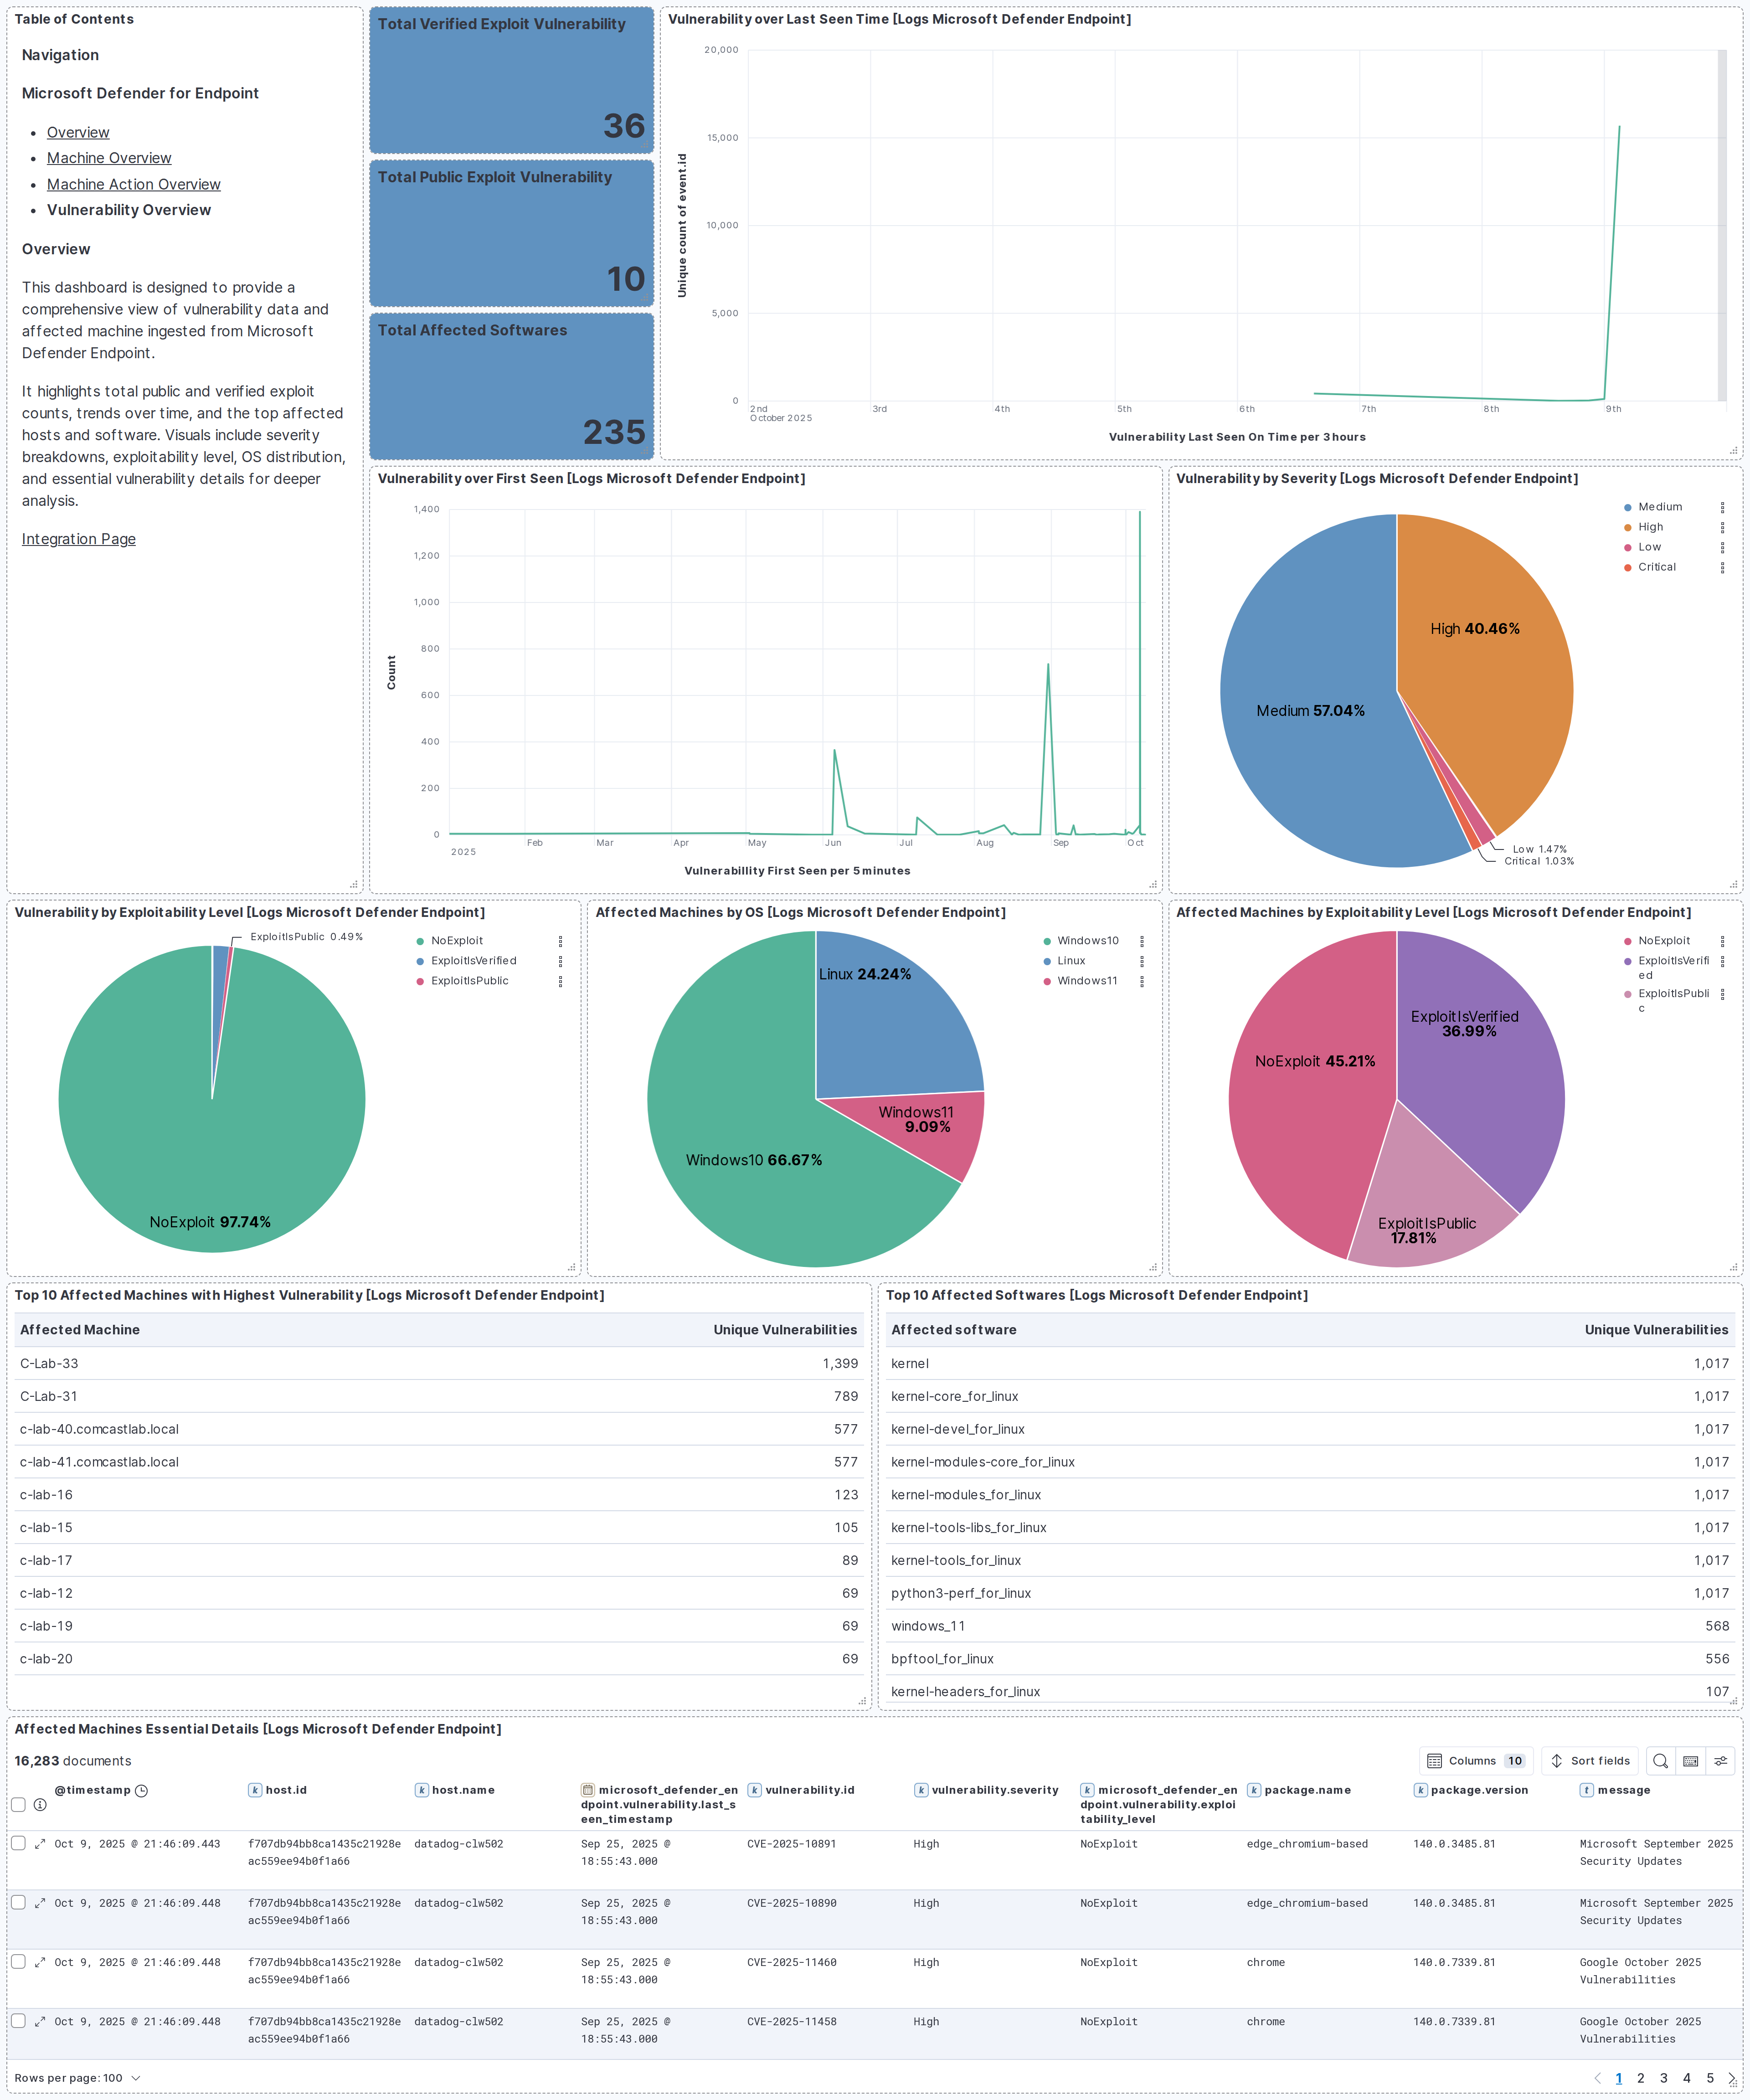
- Vulnerability - Retrieves logs of Vulnerability.
Agentless integrations allow you to collect data without having to manage Elastic Agent in your cloud. They make manual agent deployment unnecessary, so you can focus on your data instead of the agent that collects it. For more information, refer to Agentless integrations and the Agentless integrations FAQ.
Agentless deployments are only supported in Elastic Serverless and Elastic Cloud environments. This functionality is in beta and is subject to change. Beta features are not subject to the support SLA of official GA features.
Elastic Agent must be installed. For more details, check the Elastic Agent installation instructions. You can install only one Elastic Agent per host.
To allow the integration to ingest data from the Microsoft Defender API, you need to create a new application on your Azure domain. The procedure to create an application is found on the Create a new Azure Application documentation page.
When the application is granted the API permissions listed in the table below, it will receive only the necessary access to collect logs nothing more within the Azure domain.
| Data stream | API Permissions |
|---|---|
| Alert | Alert.Read.All |
| Machine | Machine.Read.All |
| Machine Action | Machine.Read.All |
| Vulnerability | Vulnerability.Read.All, Vulnerability.Read |
After the application has been created, it should contain 3 values that you need to apply to the module configuration.
These values are:
- Client ID
- Client Secret
- Tenant ID
- In Kibana navigate to Management > Integrations.
- In the search bar, type Microsoft Defender for Endpoint.
- Select the Microsoft Defender for Endpoint integration and add it.
- Add all the required integration configuration parameters, including the Client ID, Client Secret, Tenant ID to enable data collection.
- Select "Save and continue" to save the integration.
For vulnerability data stream, a full sync pulls in a large volume of data, which can lead to storage issues or index overflow over time. To avoid this, we have set up an Index Lifecycle Management (ILM) policy that automatically deletes vulnerability data older than 7 days. This helps keep storage usage under control.
The user or service account associated with the integration must have the following index privileges on the relevant index: delete, delete_index
| Defender for Endpoint fields | ECS Fields |
|---|---|
| alertCreationTime | @timestamp |
| aadTenantId | cloud.account.id |
| category | threat.technique.name |
| computerDnsName | host.hostname |
| description | rule.description |
| detectionSource | observer.name |
| evidence.fileName | file.name |
| evidence.filePath | file.path |
| evidence.processId | process.pid |
| evidence.processCommandLine | process.command_line |
| evidence.processCreationTime | process.start |
| evidence.parentProcessId | process.parent.pid |
| evidence.parentProcessCreationTime | process.parent.start |
| evidence.sha1 | file.hash.sha1 |
| evidence.sha256 | file.hash.sha256 |
| evidence.url | url.full |
| firstEventTime | event.start |
| id | event.id |
| lastEventTime | event.end |
| machineId | cloud.instance.id |
| title | message |
| severity | event.severity |
The values used in event.severity are consistent with Elastic Detection Rules.
| Severity Name | event.severity |
|---|---|
| Low (or Informational) | 21 |
| Medium | 47 |
| High | 73 |
| Critical | 99 |
- Expiring SAS URLs: The option
SAS Valid Hoursinvulnerabilitydata stream controls the duration that theShared Access Signature (SAS)download URLs are valid for. The default value of this option is1hi.e., 1 hour, and the maximum allowed value is6hi.e., 6 hours. Increase the value of the optionSAS Valid Hourswhen you seeerror.messageindicates signatures are invalid, or when you notice invalid signature errors inside CEL trace logs.
This is the log dataset.
Example
{
    "@timestamp": "2025-10-16T10:42:06.592Z",
    "agent": {
        "ephemeral_id": "b43b835d-ba25-4ad7-aa9f-200c15733e48",
        "id": "353e6432-27a9-40a4-98a2-557dbb69496b",
        "name": "elastic-agent-48674",
        "type": "filebeat",
        "version": "8.19.3"
    },
    "cloud": {
        "account": {
            "id": "a839b112-1253-6432-9bf6-94542403f21c"
        },
        "instance": {
            "id": "111e6dd8c833c8a052ea231ec1b19adaf497b625"
        },
        "provider": "azure"
    },
    "data_stream": {
        "dataset": "microsoft_defender_endpoint.log",
        "namespace": "90146",
        "type": "logs"
    },
    "ecs": {
        "version": "8.11.0"
    },
    "elastic_agent": {
        "id": "353e6432-27a9-40a4-98a2-557dbb69496b",
        "snapshot": false,
        "version": "8.19.3"
    },
    "event": {
        "action": "Execution",
        "agent_id_status": "verified",
        "category": [
            "host"
        ],
        "created": "2021-01-26T20:33:57.7220239Z",
        "dataset": "microsoft_defender_endpoint.log",
        "duration": 101466100,
        "end": "2021-01-26T20:31:33.0577322Z",
        "id": "da637472900382838869_1364969609",
        "ingested": "2025-10-16T10:42:09Z",
        "kind": "alert",
        "provider": "defender_endpoint",
        "severity": 21,
        "start": "2021-01-26T20:31:32.9562661Z",
        "timezone": "UTC",
        "type": [
            "access",
            "start"
        ]
    },
    "host": {
        "hostname": "temp123.middleeast.corp.microsoft.com",
        "id": "111e6dd8c833c8a052ea231ec1b19adaf497b625",
        "name": "temp123.middleeast.corp.microsoft.com"
    },
    "input": {
        "type": "httpjson"
    },
    "message": "Low-reputation arbitrary code executed by signed executable",
    "microsoft": {
        "defender_endpoint": {
            "assignedTo": "[email protected]",
            "evidence": {
                "aadUserId": "11118379-2a59-1111-ac3c-a51eb4a3c627",
                "accountName": "name",
                "domainName": "DOMAIN",
                "entityType": "User",
                "userPrincipalName": "[email protected]"
            },
            "incidentId": "1126093",
            "investigationState": "Queued",
            "lastUpdateTime": "2021-01-26T20:33:59.2Z",
            "rbacGroupName": "A",
            "status": "New"
        }
    },
    "observer": {
        "name": "WindowsDefenderAtp",
        "product": "Defender for Endpoint",
        "vendor": "Microsoft"
    },
    "related": {
        "hosts": [
            "temp123.middleeast.corp.microsoft.com"
        ],
        "user": [
            "temp123"
        ]
    },
    "rule": {
        "description": "Binaries signed by Microsoft can be used to run low-reputation arbitrary code. This technique hides the execution of malicious code within a trusted process. As a result, the trusted process might exhibit suspicious behaviors, such as opening a listening port or connecting to a command-and-control (C&C) server."
    },
    "tags": [
        "microsoft-defender-endpoint",
        "forwarded"
    ],
    "threat": {
        "framework": "MITRE ATT&CK",
        "technique": {
            "name": [
                "Execution"
            ]
        }
    },
    "user": {
        "domain": "DOMAIN",
        "id": "S-1-5-21-11111607-1111760036-109187956-75141",
        "name": "temp123"
    }
}
Exported fields
| Field | Description | Type |
|---|---|---|
| @timestamp | Event timestamp. | date |
| cloud.image.id | Image ID for the cloud instance. | keyword |
| data_stream.dataset | Data stream dataset. | constant_keyword |
| data_stream.namespace | Data stream namespace. | constant_keyword |
| data_stream.type | Data stream type. | constant_keyword |
| event.dataset | Event dataset | constant_keyword |
| event.module | Event module | constant_keyword |
| host.containerized | If the host is a container. | boolean |
| host.os.build | OS build information. | keyword |
| host.os.codename | OS codename, if any. | keyword |
| input.type | Input type | keyword |
| log.offset | Log offset | long |
| microsoft.defender_endpoint.assignedTo | Owner of the alert. | keyword |
| microsoft.defender_endpoint.classification | Specification of the alert. Possible values are: 'Unknown', 'FalsePositive', 'TruePositive'. | keyword |
| microsoft.defender_endpoint.determination | Specifies the determination of the alert. Possible values are: 'NotAvailable', 'Apt', 'Malware', 'SecurityPersonnel', 'SecurityTesting', 'UnwantedSoftware', 'Other'. | keyword |
| microsoft.defender_endpoint.evidence.aadUserId | ID of the user involved in the alert | keyword |
| microsoft.defender_endpoint.evidence.accountName | Username of the user involved in the alert | keyword |
| microsoft.defender_endpoint.evidence.domainName | Domain name related to the alert | keyword |
| microsoft.defender_endpoint.evidence.entityType | The type of evidence | keyword |
| microsoft.defender_endpoint.evidence.ipAddress | IP address involved in the alert | ip |
| microsoft.defender_endpoint.evidence.userPrincipalName | Principal name of the user involved in the alert | keyword |
| microsoft.defender_endpoint.incidentId | The Incident ID of the Alert. | keyword |
| microsoft.defender_endpoint.investigationId | The Investigation ID related to the Alert. | keyword |
| microsoft.defender_endpoint.investigationState | The current state of the Investigation. | keyword |
| microsoft.defender_endpoint.lastUpdateTime | The date and time (in UTC) the alert was last updated. | date |
| microsoft.defender_endpoint.rbacGroupName | User group related to the alert | keyword |
| microsoft.defender_endpoint.resolvedTime | The date and time in which the status of the alert was changed to 'Resolved'. | date |
| microsoft.defender_endpoint.status | Specifies the current status of the alert. Possible values are: 'Unknown', 'New', 'InProgress' and 'Resolved'. | keyword |
| microsoft.defender_endpoint.threatFamilyName | Threat family. | keyword |
This is the machine dataset.
Example
{
    "@timestamp": "2025-10-16T10:43:46.052Z",
    "agent": {
        "ephemeral_id": "c45e3532-8231-4823-b919-99eedb3d39d8",
        "id": "d09beef9-81e5-4ec1-b71e-6e744709b60f",
        "name": "elastic-agent-38879",
        "type": "filebeat",
        "version": "8.19.3"
    },
    "data_stream": {
        "dataset": "microsoft_defender_endpoint.machine",
        "namespace": "77808",
        "type": "logs"
    },
    "ecs": {
        "version": "8.11.0"
    },
    "elastic_agent": {
        "id": "d09beef9-81e5-4ec1-b71e-6e744709b60f",
        "snapshot": false,
        "version": "8.19.3"
    },
    "event": {
        "agent_id_status": "verified",
        "category": [
            "host"
        ],
        "dataset": "microsoft_defender_endpoint.machine",
        "ingested": "2025-10-16T10:43:49Z",
        "kind": "event",
        "original": "{\"aadDeviceId\":null,\"agentVersion\":\"10.8760.17763.6414\",\"computerDnsName\":\"dlp-win2k19\",\"deviceValue\":\"Normal\",\"exclusionReason\":null,\"exposureLevel\":\"High\",\"firstSeen\":\"2024-10-17T13:56:23.9412922Z\",\"healthStatus\":\"Inactive\",\"id\":\"c114cb1c0b827fabcdefabcdef2b9cfd469c091b\",\"ipAddresses\":[{\"ipAddress\":\"10.50.11.140\",\"macAddress\":\"00005E005301\",\"operationalStatus\":\"Up\",\"type\":\"Ethernet\"},{\"ipAddress\":\"1.128.0.0\",\"macAddress\":\"00005E00530A\",\"operationalStatus\":\"Up\",\"type\":\"Ethernet\"},{\"ipAddress\":\"2a02:cf40::\",\"macAddress\":\"00005E005302\",\"operationalStatus\":\"Up\",\"type\":\"Ethernet\"},{\"ipAddress\":\"127.0.0.1\",\"macAddress\":null,\"operationalStatus\":\"Up\",\"type\":\"SoftwareLoopback\"},{\"ipAddress\":\"::1\",\"macAddress\":null,\"operationalStatus\":\"Up\",\"type\":\"SoftwareLoopback\"}],\"isAadJoined\":false,\"isExcluded\":false,\"isPotentialDuplication\":false,\"lastExternalIpAddress\":\"1.128.0.0\",\"lastIpAddress\":\"10.50.11.140\",\"lastSeen\":\"2024-10-24T06:12:35.4409708Z\",\"machineTags\":[],\"managedBy\":\"MicrosoftDefenderForEndpoint\",\"managedByStatus\":\"Success\",\"mergedIntoMachineId\":null,\"onboardingStatus\":\"Onboarded\",\"osArchitecture\":\"64-bit\",\"osBuild\":17763,\"osPlatform\":\"WindowsServer2019\",\"osProcessor\":\"x64\",\"osVersion\":null,\"rbacGroupId\":0,\"rbacGroupName\":null,\"riskScore\":\"None\",\"version\":\"1809\",\"vmMetadata\":null}",
        "type": [
            "info"
        ]
    },
    "group": {
        "id": "0"
    },
    "host": {
        "architecture": "x64",
        "hostname": "dlp-win2k19",
        "id": "c114cb1c0b827fabcdefabcdef2b9cfd469c091b",
        "ip": [
            "1.128.0.0"
        ],
        "name": "dlp-win2k19",
        "os": {
            "name": "WindowsServer2019 1809",
            "platform": "WindowsServer2019",
            "type": "windows",
            "version": "1809"
        },
        "risk": {
            "calculated_level": "None"
        }
    },
    "input": {
        "type": "cel"
    },
    "microsoft_defender_endpoint": {
        "machine": {
            "agent_version": "10.8760.17763.6414",
            "device_value": "Normal",
            "exposure_level": "High",
            "first_seen": "2024-10-17T13:56:23.941Z",
            "health_status": "Inactive",
            "ip_addresses": [
                {
                    "ip_address": "10.50.11.140",
                    "mac_address": "00-00-5E-00-53-01",
                    "operational_status": "Up",
                    "type": "Ethernet"
                },
                {
                    "ip_address": "1.128.0.0",
                    "mac_address": "00-00-5E-00-53-0A",
                    "operational_status": "Up",
                    "type": "Ethernet"
                },
                {
                    "ip_address": "2a02:cf40::",
                    "mac_address": "00-00-5E-00-53-02",
                    "operational_status": "Up",
                    "type": "Ethernet"
                },
                {
                    "ip_address": "127.0.0.1",
                    "operational_status": "Up",
                    "type": "SoftwareLoopback"
                },
                {
                    "ip_address": "::1",
                    "operational_status": "Up",
                    "type": "SoftwareLoopback"
                }
            ],
            "is_aad_joined": false,
            "is_excluded": false,
            "is_potential_duplication": false,
            "last_ip_address": "10.50.11.140",
            "last_seen": "2024-10-24T06:12:35.440Z",
            "managed_by": "MicrosoftDefenderForEndpoint",
            "managed_by_status": "Success",
            "onboarding_status": "Onboarded",
            "os_architecture": "64-bit",
            "os_build": 17763
        }
    },
    "observer": {
        "product": "Defender for Endpoint",
        "vendor": "Microsoft"
    },
    "related": {
        "hosts": [
            "dlp-win2k19",
            "c114cb1c0b827fabcdefabcdef2b9cfd469c091b"
        ],
        "ip": [
            "10.50.11.140",
            "1.128.0.0",
            "2a02:cf40::",
            "127.0.0.1",
            "::1"
        ]
    },
    "tags": [
        "preserve_original_event",
        "forwarded",
        "microsoft_defender_endpoint-machine"
    ]
}
Exported fields
| Field | Description | Type |
|---|---|---|
| @timestamp | Event timestamp. | date |
| data_stream.dataset | Data stream dataset. | constant_keyword |
| data_stream.namespace | Data stream namespace. | constant_keyword |
| data_stream.type | Data stream type. | constant_keyword |
| event.dataset | Event dataset | constant_keyword |
| event.module | Event module | constant_keyword |
| input.type | Type of Filebeat input. | keyword |
| log.offset | Log offset. | long |
| microsoft_defender_endpoint.machine.aad_device_id | Microsoft Entra Device ID (when machine is Microsoft Entra joined). | keyword |
| microsoft_defender_endpoint.machine.agent_version | keyword | |
| microsoft_defender_endpoint.machine.computer_dns_name | Machine fully qualified name. | keyword |
| microsoft_defender_endpoint.machine.device_value | The value of the device. Possible values are: Normal, Low, and High. | keyword |
| microsoft_defender_endpoint.machine.exposure_level | Exposure level as evaluated by Microsoft Defender for Endpoint. Possible values are: None, Low, Medium, and High. | keyword |
| microsoft_defender_endpoint.machine.first_seen | First date and time where the machine was observed by Microsoft Defender for Endpoint. | date |
| microsoft_defender_endpoint.machine.health_status | machine health status. Possible values are: Active, Inactive, ImpairedCommunication, NoSensorData, NoSensorDataImpairedCommunication, and Unknown. | keyword |
| microsoft_defender_endpoint.machine.id | Machine identity. | keyword |
| microsoft_defender_endpoint.machine.ip_addresses.ip_address | ip | |
| microsoft_defender_endpoint.machine.ip_addresses.mac_address | keyword | |
| microsoft_defender_endpoint.machine.ip_addresses.operational_status | keyword | |
| microsoft_defender_endpoint.machine.ip_addresses.type | keyword | |
| microsoft_defender_endpoint.machine.is_aad_joined | boolean | |
| microsoft_defender_endpoint.machine.is_excluded | boolean | |
| microsoft_defender_endpoint.machine.is_potential_duplication | boolean | |
| microsoft_defender_endpoint.machine.last_external_ip_address | Last IP through which the machine accessed the internet. | ip |
| microsoft_defender_endpoint.machine.last_ip_address | Last IP on local NIC on the machine. | ip |
| microsoft_defender_endpoint.machine.last_seen | Time and date of the last received full device report. A device typically sends a full report every 24 hours. NOTE: This property doesn't correspond to the last seen value in the UI. It pertains to the last device update. | date |
| microsoft_defender_endpoint.machine.machine_tags | Set of machine tags. | keyword |
| microsoft_defender_endpoint.machine.managed_by | keyword | |
| microsoft_defender_endpoint.machine.managed_by_status | keyword | |
| microsoft_defender_endpoint.machine.onboarding_status | Status of machine onboarding. Possible values are: onboarded, CanBeOnboarded, Unsupported, and InsufficientInfo. | keyword |
| microsoft_defender_endpoint.machine.os_architecture | Operating system architecture. Possible values are: 32-bit, 64-bit. | keyword |
| microsoft_defender_endpoint.machine.os_build | Operating system build number. | long |
| microsoft_defender_endpoint.machine.os_platform | Operating system platform. | keyword |
| microsoft_defender_endpoint.machine.os_processor | Operating system processor. | keyword |
| microsoft_defender_endpoint.machine.rbac_group_id | Machine group ID. | keyword |
| microsoft_defender_endpoint.machine.rbac_group_name | Machine group Name. | keyword |
| microsoft_defender_endpoint.machine.risk_score | Risk score as evaluated by Microsoft Defender for Endpoint. Possible values are: None, Informational, Low, Medium, and High. | keyword |
| microsoft_defender_endpoint.machine.version | Operating system version. | keyword |
| microsoft_defender_endpoint.machine.vm_metadata.cloud_provider | keyword | |
| microsoft_defender_endpoint.machine.vm_metadata.resource_id | keyword | |
| microsoft_defender_endpoint.machine.vm_metadata.vm_id | keyword |
This is the machine action dataset.
Example
{
    "@timestamp": "2024-11-22T12:48:56.768Z",
    "agent": {
        "ephemeral_id": "2f48d0ac-be9d-40b4-90c7-221a29dbd6f5",
        "id": "7a528879-f9cb-4500-8ca9-61cdde8b4c76",
        "name": "elastic-agent-92539",
        "type": "filebeat",
        "version": "8.19.3"
    },
    "data_stream": {
        "dataset": "microsoft_defender_endpoint.machine_action",
        "namespace": "37546",
        "type": "logs"
    },
    "ecs": {
        "version": "8.11.0"
    },
    "elastic_agent": {
        "id": "7a528879-f9cb-4500-8ca9-61cdde8b4c76",
        "snapshot": false,
        "version": "8.19.3"
    },
    "event": {
        "action": "RunAntiVirusScan",
        "agent_id_status": "verified",
        "created": "2024-11-22T12:48:33.993Z",
        "dataset": "microsoft_defender_endpoint.machine_action",
        "id": "d72456af-1234-5678-abcd-abcdef87fdee",
        "ingested": "2025-10-16T10:45:30Z",
        "kind": "event",
        "original": "{\"cancellationComment\":null,\"cancellationDateTimeUtc\":null,\"cancellationRequestor\":null,\"commands\":[],\"computerDnsName\":\"c-lab-24\",\"creationDateTimeUtc\":\"2024-11-22T12:48:33.9936591Z\",\"errorHResult\":0,\"externalId\":null,\"id\":\"d72456af-1234-5678-abcd-abcdef87fdee\",\"lastUpdateDateTimeUtc\":\"2024-11-22T12:48:56.7684808Z\",\"machineId\":\"de693d7fbdabcdefabcdefcfc9cf40b5bf2da1d8\",\"relatedFileInfo\":null,\"requestSource\":\"Portal\",\"requestor\":\"[email protected]\",\"requestorComment\":\"Quick Scan\",\"scope\":\"Quick\",\"status\":\"Succeeded\",\"title\":null,\"troubleshootInfo\":null,\"type\":\"RunAntiVirusScan\"}",
        "outcome": "success",
        "type": [
            "info"
        ]
    },
    "host": {
        "hostname": "c-lab-24",
        "id": "de693d7fbdabcdefabcdefcfc9cf40b5bf2da1d8",
        "name": "c-lab-24"
    },
    "input": {
        "type": "cel"
    },
    "microsoft_defender_endpoint": {
        "machine_action": {
            "error_h_result": 0,
            "request_source": "Portal",
            "requestor_comment": "Quick Scan",
            "scope": "Quick",
            "status": "Succeeded",
            "type": "RunAntiVirusScan"
        }
    },
    "observer": {
        "product": "Defender for Endpoint",
        "vendor": "Microsoft"
    },
    "related": {
        "hosts": [
            "c-lab-24",
            "de693d7fbdabcdefabcdefcfc9cf40b5bf2da1d8"
        ],
        "user": [
            "testuser",
            "[email protected]"
        ]
    },
    "tags": [
        "preserve_original_event",
        "forwarded",
        "microsoft_defender_endpoint-machine_action"
    ],
    "user": {
        "domain": "example.com",
        "email": "[email protected]",
        "name": "testuser"
    }
}
Exported fields
| Field | Description | Type |
|---|---|---|
| @timestamp | Event timestamp. | date |
| data_stream.dataset | Data stream dataset. | constant_keyword |
| data_stream.namespace | Data stream namespace. | constant_keyword |
| data_stream.type | Data stream type. | constant_keyword |
| event.dataset | Event dataset | constant_keyword |
| event.module | Event module | constant_keyword |
| input.type | Type of Filebeat input. | keyword |
| labels.is_transform_source | Distinguishes between documents that are a source for a transform and documents that are an output of a transform, to facilitate easier filtering. | constant_keyword |
| log.offset | Log offset. | long |
| microsoft_defender_endpoint.machine_action.cancellation_comment | Comment that was written when canceling the action. | keyword |
| microsoft_defender_endpoint.machine_action.cancellation_date_time_utc | The date and time when the action was canceled. | date |
| microsoft_defender_endpoint.machine_action.cancellation_requestor | Identity of the person that canceled the action. | keyword |
| microsoft_defender_endpoint.machine_action.commands | Commands to run. Allowed values are PutFile, RunScript, GetFile. | keyword |
| microsoft_defender_endpoint.machine_action.computer_dns_name | Name of the machine on which the action was executed. | keyword |
| microsoft_defender_endpoint.machine_action.creation_date_time_utc | The date and time when the action was created. | date |
| microsoft_defender_endpoint.machine_action.error_h_result | long | |
| microsoft_defender_endpoint.machine_action.external_id | Id the customer can submit in the request for custom correlation. | keyword |
| microsoft_defender_endpoint.machine_action.id | Identity of the Machine Action entity. | keyword |
| microsoft_defender_endpoint.machine_action.last_update_date_time_utc | The last date and time when the action status was updated. | date |
| microsoft_defender_endpoint.machine_action.machine_id | ID of the machine on which the action was executed. | keyword |
| microsoft_defender_endpoint.machine_action.related_file_info.file_identifier | Contains two Properties. string fileIdentifier, Enum fileIdentifierType with the possible values: Sha1, Sha256, and Md5. | keyword |
| microsoft_defender_endpoint.machine_action.related_file_info.file_identifier_type | Enum fileIdentifierType with the possible values: Sha1, Sha256, and Md5. | keyword |
| microsoft_defender_endpoint.machine_action.request_source | The name of the user/application that submitted the action. | keyword |
| microsoft_defender_endpoint.machine_action.requestor | Identity of the person that executed the action. | keyword |
| microsoft_defender_endpoint.machine_action.requestor_comment | Comment that was written when issuing the action. | keyword |
| microsoft_defender_endpoint.machine_action.scope | Scope of the action. Full or Selective for Isolation, Quick or Full for antivirus scan. | keyword |
| microsoft_defender_endpoint.machine_action.status | Current status of the command. Possible values are: Pending, InProgress, Succeeded, Failed, TimeOut, and Cancelled. | keyword |
| microsoft_defender_endpoint.machine_action.title | Machine action title. | keyword |
| microsoft_defender_endpoint.machine_action.type | Type of the action. Possible values are: RunAntiVirusScan, Offboard, LiveResponse, CollectInvestigationPackage, Isolate, Unisolate, StopAndQuarantineFile, RestrictCodeExecution, and UnrestrictCodeExecution. | keyword |
This is the vulnerability dataset.
Example
{
    "@timestamp": "2025-10-21T16:43:18.340Z",
    "agent": {
        "ephemeral_id": "fc08f059-a301-41b4-8aca-e04734e21c4d",
        "id": "85702a4b-7e1b-4c02-bba1-3aec32c16101",
        "name": "elastic-agent-98433",
        "type": "filebeat",
        "version": "8.19.3"
    },
    "data_stream": {
        "dataset": "microsoft_defender_endpoint.vulnerability",
        "namespace": "32915",
        "type": "logs"
    },
    "ecs": {
        "version": "8.17.0"
    },
    "elastic_agent": {
        "id": "85702a4b-7e1b-4c02-bba1-3aec32c16101",
        "snapshot": false,
        "version": "8.19.3"
    },
    "event": {
        "agent_id_status": "verified",
        "category": [
            "vulnerability"
        ],
        "dataset": "microsoft_defender_endpoint.vulnerability",
        "id": "1212121212121212121212_red_hat_kernel_0:5.14.0-427.42.1.el9_4_CVE-2022-49226",
        "ingested": "2025-10-21T16:43:19Z",
        "kind": "event",
        "original": "{\"CveBatchTitle\":\"Red_hat February 2025 Vulnerabilities\",\"CveBatchUrl\":\"https://security.access.redhat.com/data/oval/v2/RHEL9/rhel-9.8-eus.oval.xml.bz2\",\"CveId\":\"CVE-2022-49226\",\"CvssScore\":5.5,\"DeviceId\":\"1212121212121212121212\",\"DeviceName\":\"sample-host-1\",\"ExploitabilityLevel\":\"NoExploit\",\"FirstSeenTimestamp\":\"2025-10-06 10:43:58\",\"Id\":\"1212121212121212121212_red_hat_kernel_0:5.14.0-427.42.1.el9_4_CVE-2022-49226\",\"IsOnboarded\":true,\"LastSeenTimestamp\":\"2025-10-06 22:45:00\",\"OSArchitecture\":\"x64\",\"OSPlatform\":\"Linux\",\"OSVersion\":\"enterprise_linux_9.4\",\"RbacGroupId\":0,\"RbacGroupName\":\"Unassigned\",\"RecommendationReference\":\"va-_-red_hat-_-kernel\",\"RecommendedSecurityUpdate\":\"CVE-2022-49226_oval:com.redhat.rhsa:def:20249315\",\"RecommendedSecurityUpdateId\":\"RHSA-2024:9315\",\"RecommendedSecurityUpdateUrl\":\"https://access.redhat.com/errata/RHSA-2024:9315\",\"RegistryPaths\":[],\"SecurityUpdateAvailable\":true,\"SoftwareName\":\"kernel\",\"SoftwareVendor\":\"red_hat\",\"SoftwareVersion\":\"0:5.14.0-427.42.1.el9_4\",\"VulnerabilitySeverityLevel\":\"Medium\"}",
        "type": [
            "info"
        ]
    },
    "group": {
        "id": "0",
        "name": "Unassigned"
    },
    "host": {
        "architecture": "x64",
        "hostname": "sample-host-1",
        "id": "1212121212121212121212",
        "name": "sample-host-1",
        "os": {
            "name": "Linux enterprise_linux_9.4",
            "platform": "Linux",
            "type": "linux",
            "version": "enterprise_linux_9.4"
        }
    },
    "input": {
        "type": "cel"
    },
    "message": "Red_hat February 2025 Vulnerabilities",
    "microsoft_defender_endpoint": {
        "vulnerability": {
            "cve_batch_title": "Red_hat February 2025 Vulnerabilities",
            "cve_batch_url": "https://security.access.redhat.com/data/oval/v2/RHEL9/rhel-9.8-eus.oval.xml.bz2",
            "cve_id": "CVE-2022-49226",
            "cvss_score": 5.5,
            "device_id": "1212121212121212121212",
            "device_name": "sample-host-1",
            "exploitability_level": "NoExploit",
            "first_seen_timestamp": "2025-10-06T10:43:58.000Z",
            "id": "1212121212121212121212_red_hat_kernel_0:5.14.0-427.42.1.el9_4_CVE-2022-49226",
            "is_onboarded": true,
            "last_seen_timestamp": "2025-10-06T22:45:00.000Z",
            "os_architecture": "x64",
            "os_platform": "Linux",
            "os_version": "enterprise_linux_9.4",
            "rbac_group_id": "0",
            "rbac_group_name": "Unassigned",
            "recommendation_reference": "va-_-red_hat-_-kernel",
            "recommended_security_update": "CVE-2022-49226_oval:com.redhat.rhsa:def:20249315",
            "recommended_security_update_id": "RHSA-2024:9315",
            "security_update_available": true,
            "severity_level": "Medium",
            "software_name": "kernel",
            "software_vendor": "red_hat",
            "software_version": "0:5.14.0-427.42.1.el9_4"
        }
    },
    "observer": {
        "product": "Microsoft Defender for Endpoint",
        "vendor": "Microsoft"
    },
    "package": {
        "name": "kernel",
        "version": "0:5.14.0-427.42.1.el9_4"
    },
    "related": {
        "hosts": [
            "1212121212121212121212",
            "sample-host-1"
        ]
    },
    "resource": {
        "id": "1212121212121212121212",
        "name": "sample-host-1"
    },
    "tags": [
        "preserve_original_event",
        "preserve_duplicate_custom_fields",
        "forwarded",
        "microsoft_defender_endpoint-vulnerability"
    ],
    "vulnerability": {
        "classification": "CVSS",
        "cve": "CVE-2022-49226",
        "enumeration": "CVE",
        "id": "CVE-2022-49226",
        "reference": "https://www.cve.org/CVERecord?id=CVE-2022-49226",
        "scanner": {
            "vendor": "Microsoft"
        },
        "score": {
            "base": 5.5
        },
        "severity": "Medium",
        "title": "Vulnerability found in kernel 0:5.14.0-427.42.1.el9_4 - CVE-2022-49226"
    }
}
Exported fields
| Field | Description | Type |
|---|---|---|
| @timestamp | Date/time when the event originated. This is the date/time extracted from the event, typically representing when the event was generated by the source. If the event source has no original timestamp, this value is typically populated by the first time the event was received by the pipeline. Required field for all events. | date |
| data_stream.dataset | The field can contain anything that makes sense to signify the source of the data. Examples include nginx.access, prometheus, endpoint etc. For data streams that otherwise fit, but that do not have dataset set we use the value "generic" for the dataset value. event.dataset should have the same value as data_stream.dataset. Beyond the Elasticsearch data stream naming criteria noted above, the dataset value has additional restrictions: * Must not contain - * No longer than 100 characters |
constant_keyword |
| data_stream.namespace | A user defined namespace. Namespaces are useful to allow grouping of data. Many users already organize their indices this way, and the data stream naming scheme now provides this best practice as a default. Many users will populate this field with default. If no value is used, it falls back to default. Beyond the Elasticsearch index naming criteria noted above, namespace value has the additional restrictions: * Must not contain - * No longer than 100 characters |
constant_keyword |
| data_stream.type | An overarching type for the data stream. Currently allowed values are "logs" and "metrics". We expect to also add "traces" and "synthetics" in the near future. | constant_keyword |
| event.dataset | Name of the dataset. If an event source publishes more than one type of log or events (e.g. access log, error log), the dataset is used to specify which one the event comes from. It's recommended but not required to start the dataset name with the module name, followed by a dot, then the dataset name. | constant_keyword |
| event.module | Name of the module this data is coming from. If your monitoring agent supports the concept of modules or plugins to process events of a given source (e.g. Apache logs), event.module should contain the name of this module. |
constant_keyword |
| input.type | Type of Filebeat input. | keyword |
| log.file.device_id | Device Id of the log file this event came from. | keyword |
| log.file.inode | Inode number of the log file. | keyword |
| log.offset | Log offset. | long |
| microsoft_defender_endpoint.vulnerability.cve_batch_title | keyword | |
| microsoft_defender_endpoint.vulnerability.cve_batch_url | keyword | |
| microsoft_defender_endpoint.vulnerability.cve_id | Unique identifier assigned to the security vulnerability under the Common Vulnerabilities and Exposures (CVE) system. | keyword |
| microsoft_defender_endpoint.vulnerability.cvss_score | The CVSS score of the CVE. | float |
| microsoft_defender_endpoint.vulnerability.device_id | Unique identifier for the device in the service. | keyword |
| microsoft_defender_endpoint.vulnerability.device_name | Fully qualified domain name (FQDN) of the device. | keyword |
| microsoft_defender_endpoint.vulnerability.disk_paths | Disk evidence that the product is installed on the device. | keyword |
| microsoft_defender_endpoint.vulnerability.exploitability_level | The exploitability level of this vulnerability (NoExploit, ExploitIsPublic, ExploitIsVerified, ExploitIsInKit) | keyword |
| microsoft_defender_endpoint.vulnerability.first_seen_timestamp | First time this product CVE was seen on the device. | date |
| microsoft_defender_endpoint.vulnerability.id | Unique identifier for the record. | keyword |
| microsoft_defender_endpoint.vulnerability.is_onboarded | boolean | |
| microsoft_defender_endpoint.vulnerability.last_seen_timestamp | Last time the software was reported on the device. | date |
| microsoft_defender_endpoint.vulnerability.os_architecture | Architecture of the operating system running on the device. | keyword |
| microsoft_defender_endpoint.vulnerability.os_platform | Platform of the operating system running on the device. | keyword |
| microsoft_defender_endpoint.vulnerability.os_version | Version of the operating system running on the device. | keyword |
| microsoft_defender_endpoint.vulnerability.rbac_group_id | keyword | |
| microsoft_defender_endpoint.vulnerability.rbac_group_name | The role-based access control (RBAC) group. | keyword |
| microsoft_defender_endpoint.vulnerability.recommendation_reference | A reference to the recommendation ID related to this software. | keyword |
| microsoft_defender_endpoint.vulnerability.recommended_security_update | Name or description of the security update provided by the software vendor to address the vulnerability. | keyword |
| microsoft_defender_endpoint.vulnerability.recommended_security_update_id | Identifier of the applicable security updates or identifier for the corresponding guidance or knowledge base (KB) articles. | keyword |
| microsoft_defender_endpoint.vulnerability.registry_paths | Registry evidence that the product is installed in the device. | keyword |
| microsoft_defender_endpoint.vulnerability.security_update_available | Indicates whether a security update is available for the software. | boolean |
| microsoft_defender_endpoint.vulnerability.severity_level | Severity level assigned to the security vulnerability based on the CVSS score. | keyword |
| microsoft_defender_endpoint.vulnerability.software_name | Name of the software product. | keyword |
| microsoft_defender_endpoint.vulnerability.software_vendor | Name of the software vendor. | keyword |
| microsoft_defender_endpoint.vulnerability.software_version | Version number of the software product. | keyword |
| observer.vendor | Vendor name of the observer. | constant_keyword |
| package.fixed_version | keyword | |
| package.name | Package name | keyword |
| package.version | Package version | keyword |
| resource.id | keyword | |
| resource.name | keyword | |
| vulnerability.cve | The CVE id of the vulnerability. | keyword |
| vulnerability.published_date | date | |
| vulnerability.scanner.vendor | The name of the vulnerability scanner vendor. | constant_keyword |
| vulnerability.title | keyword |
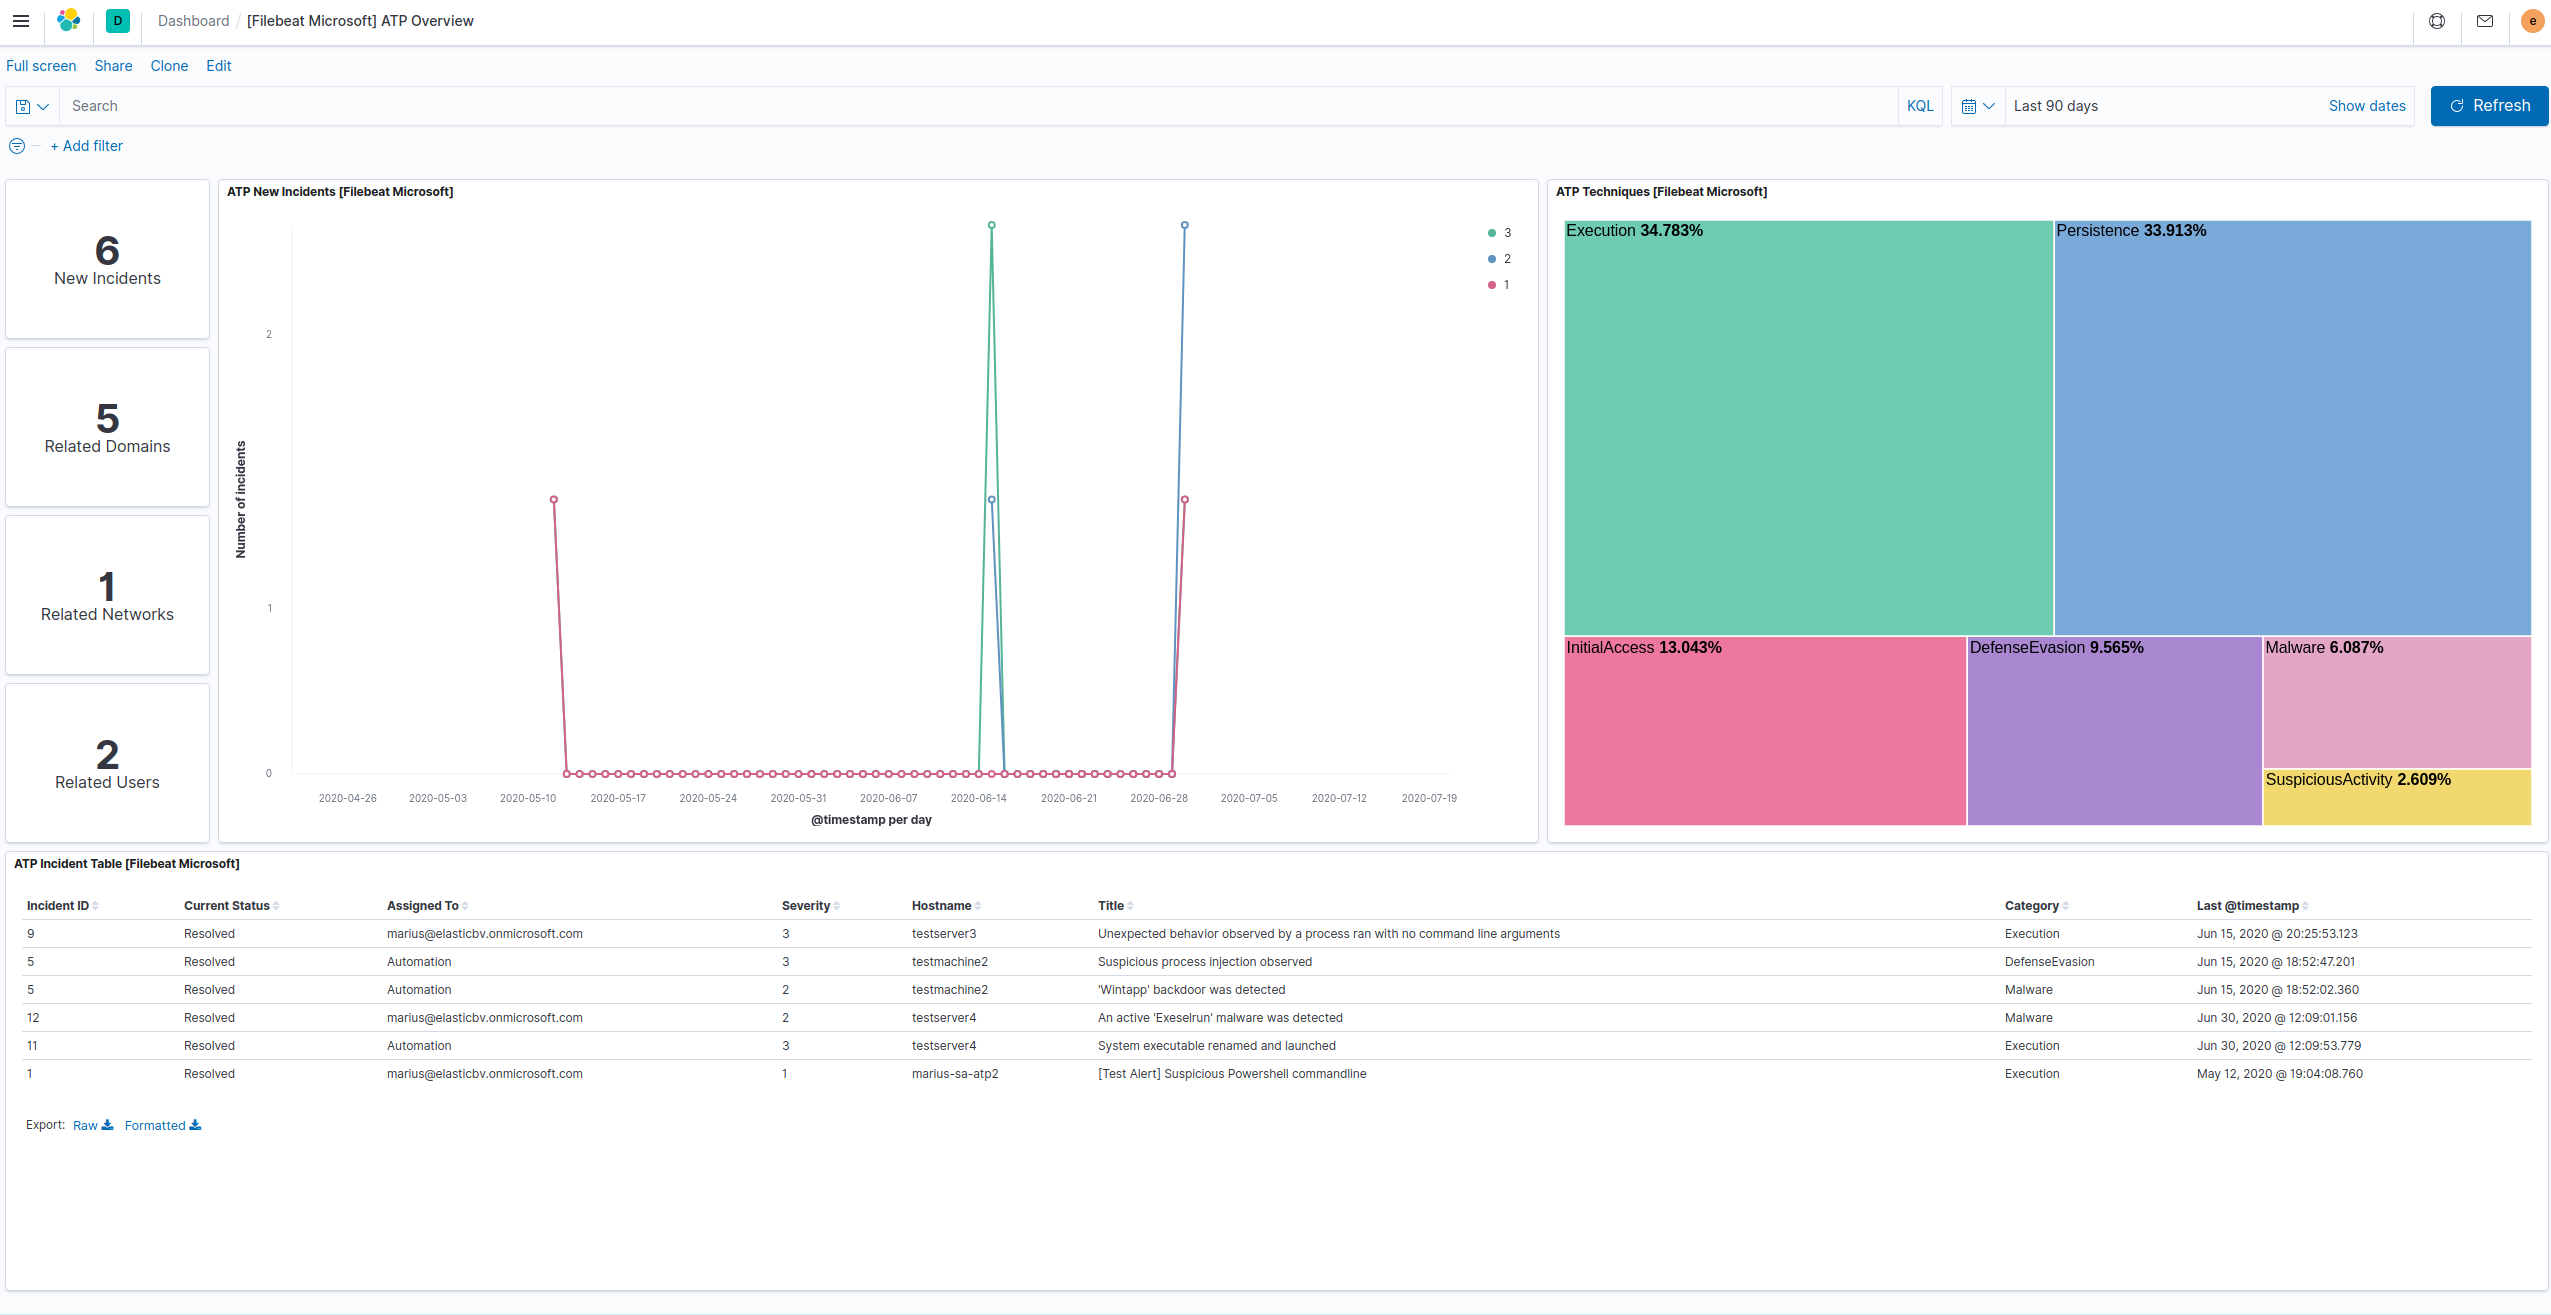
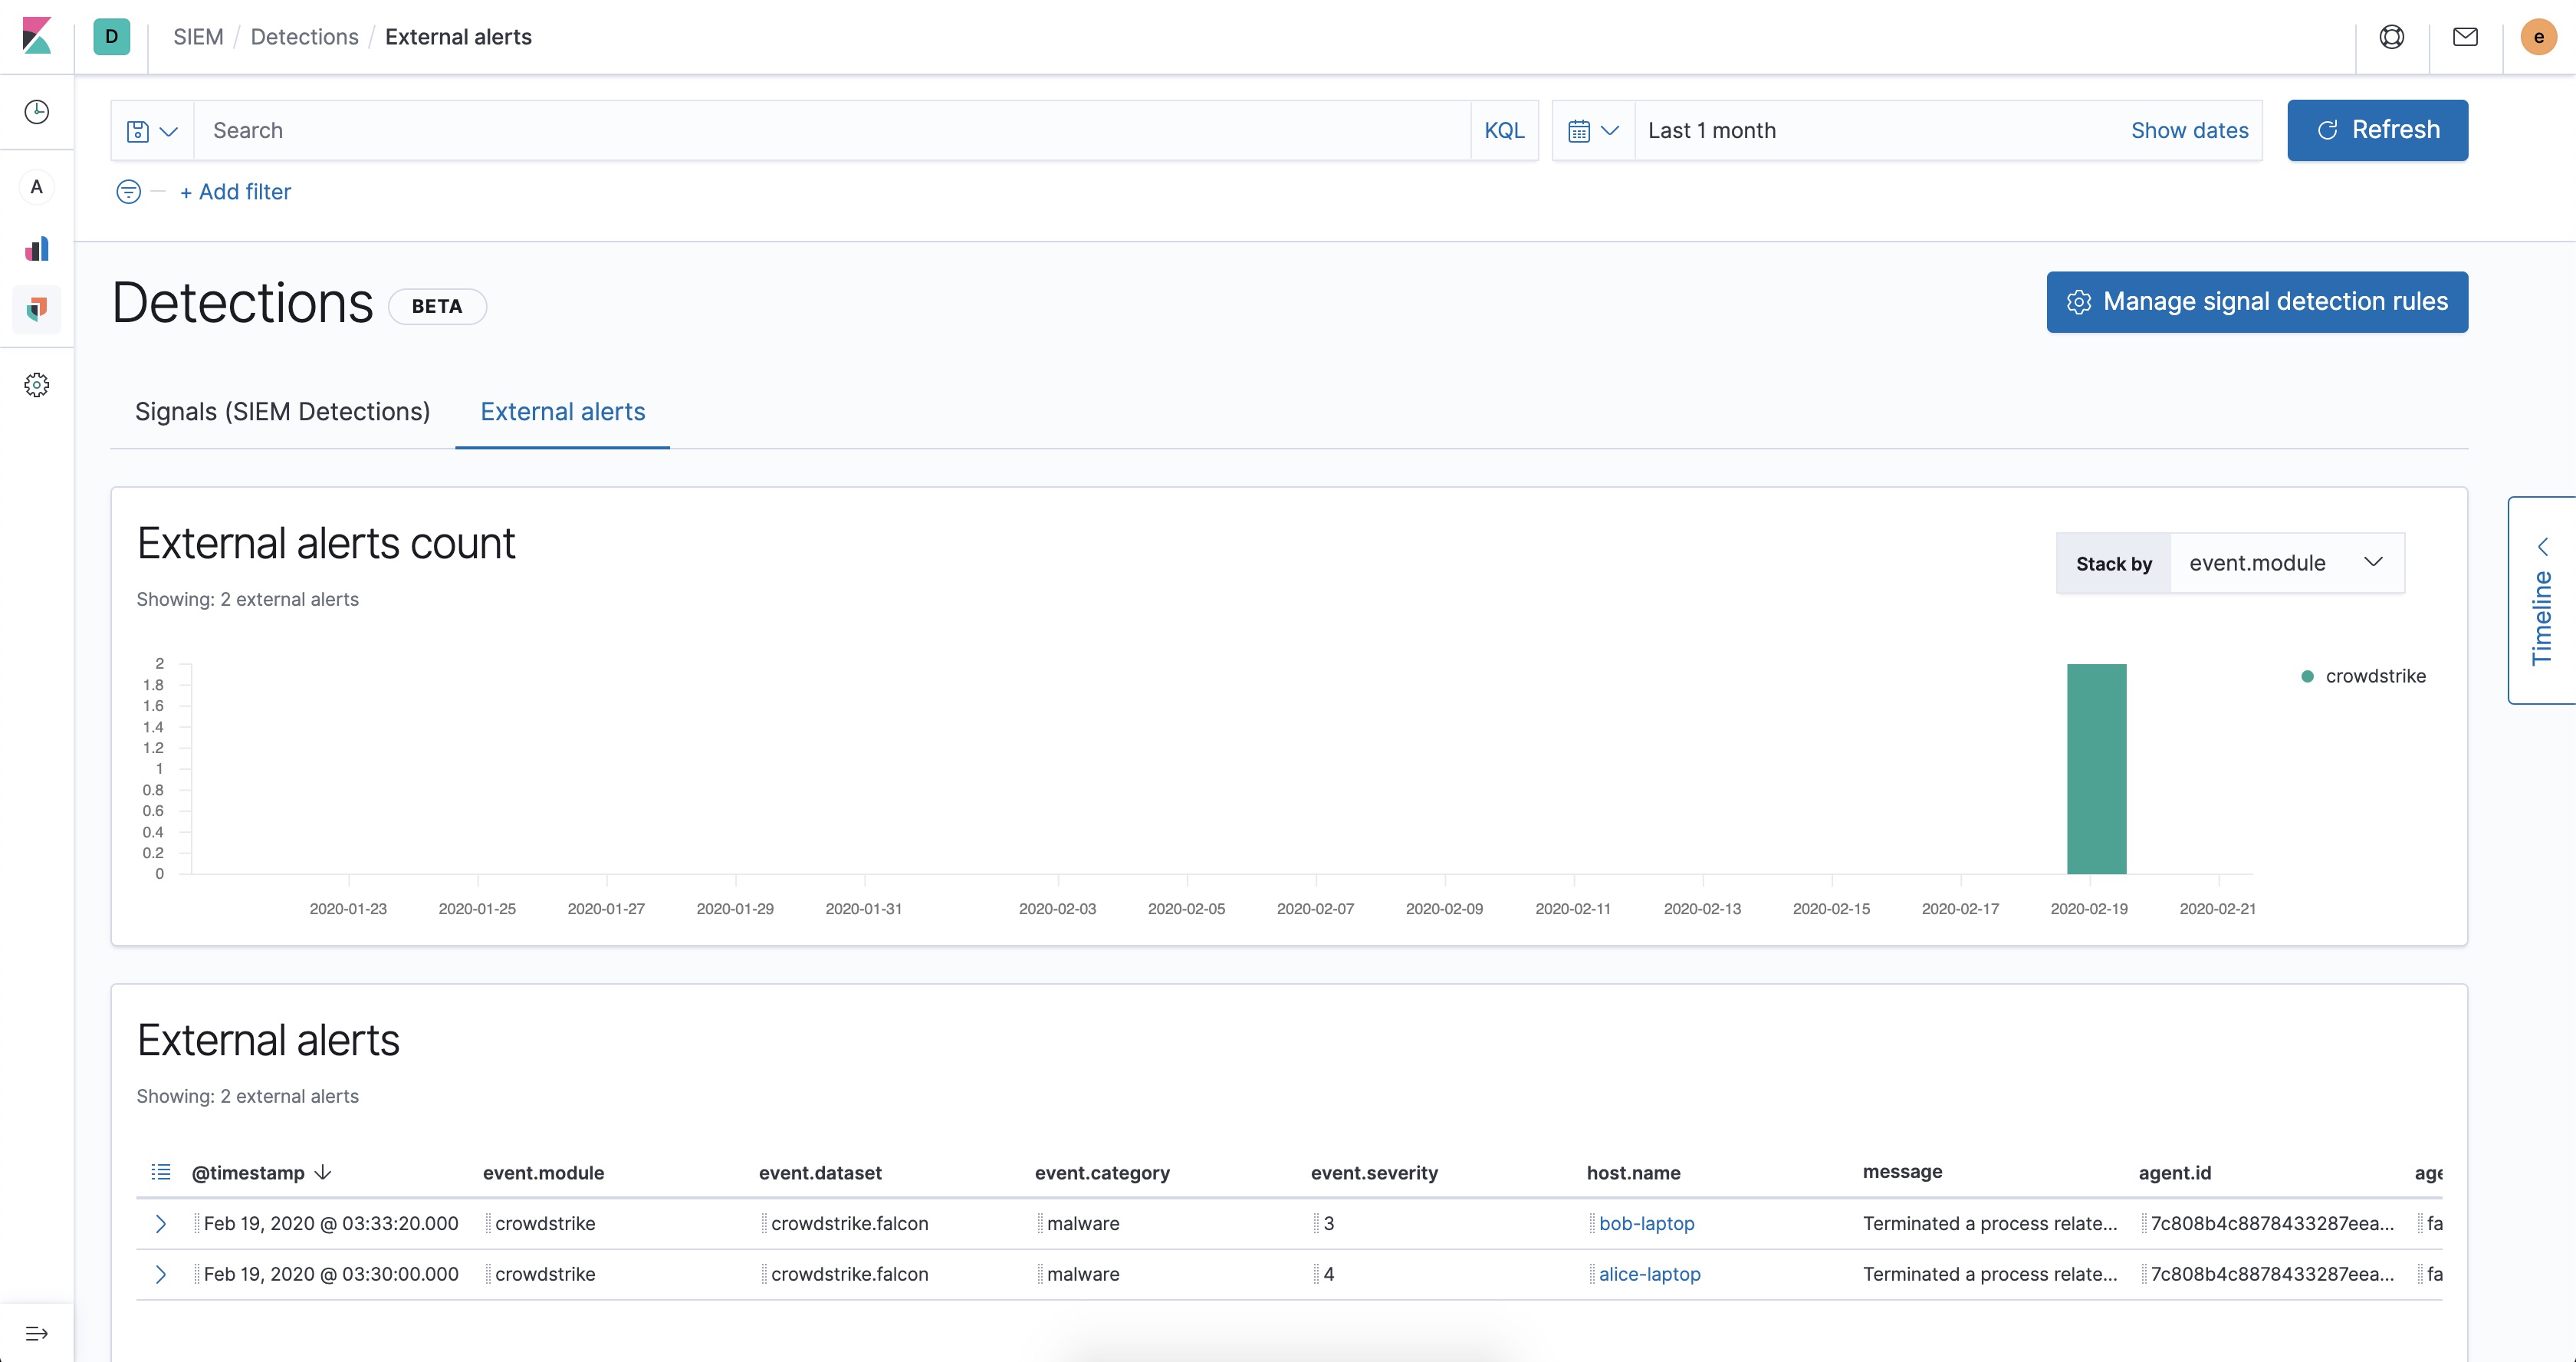
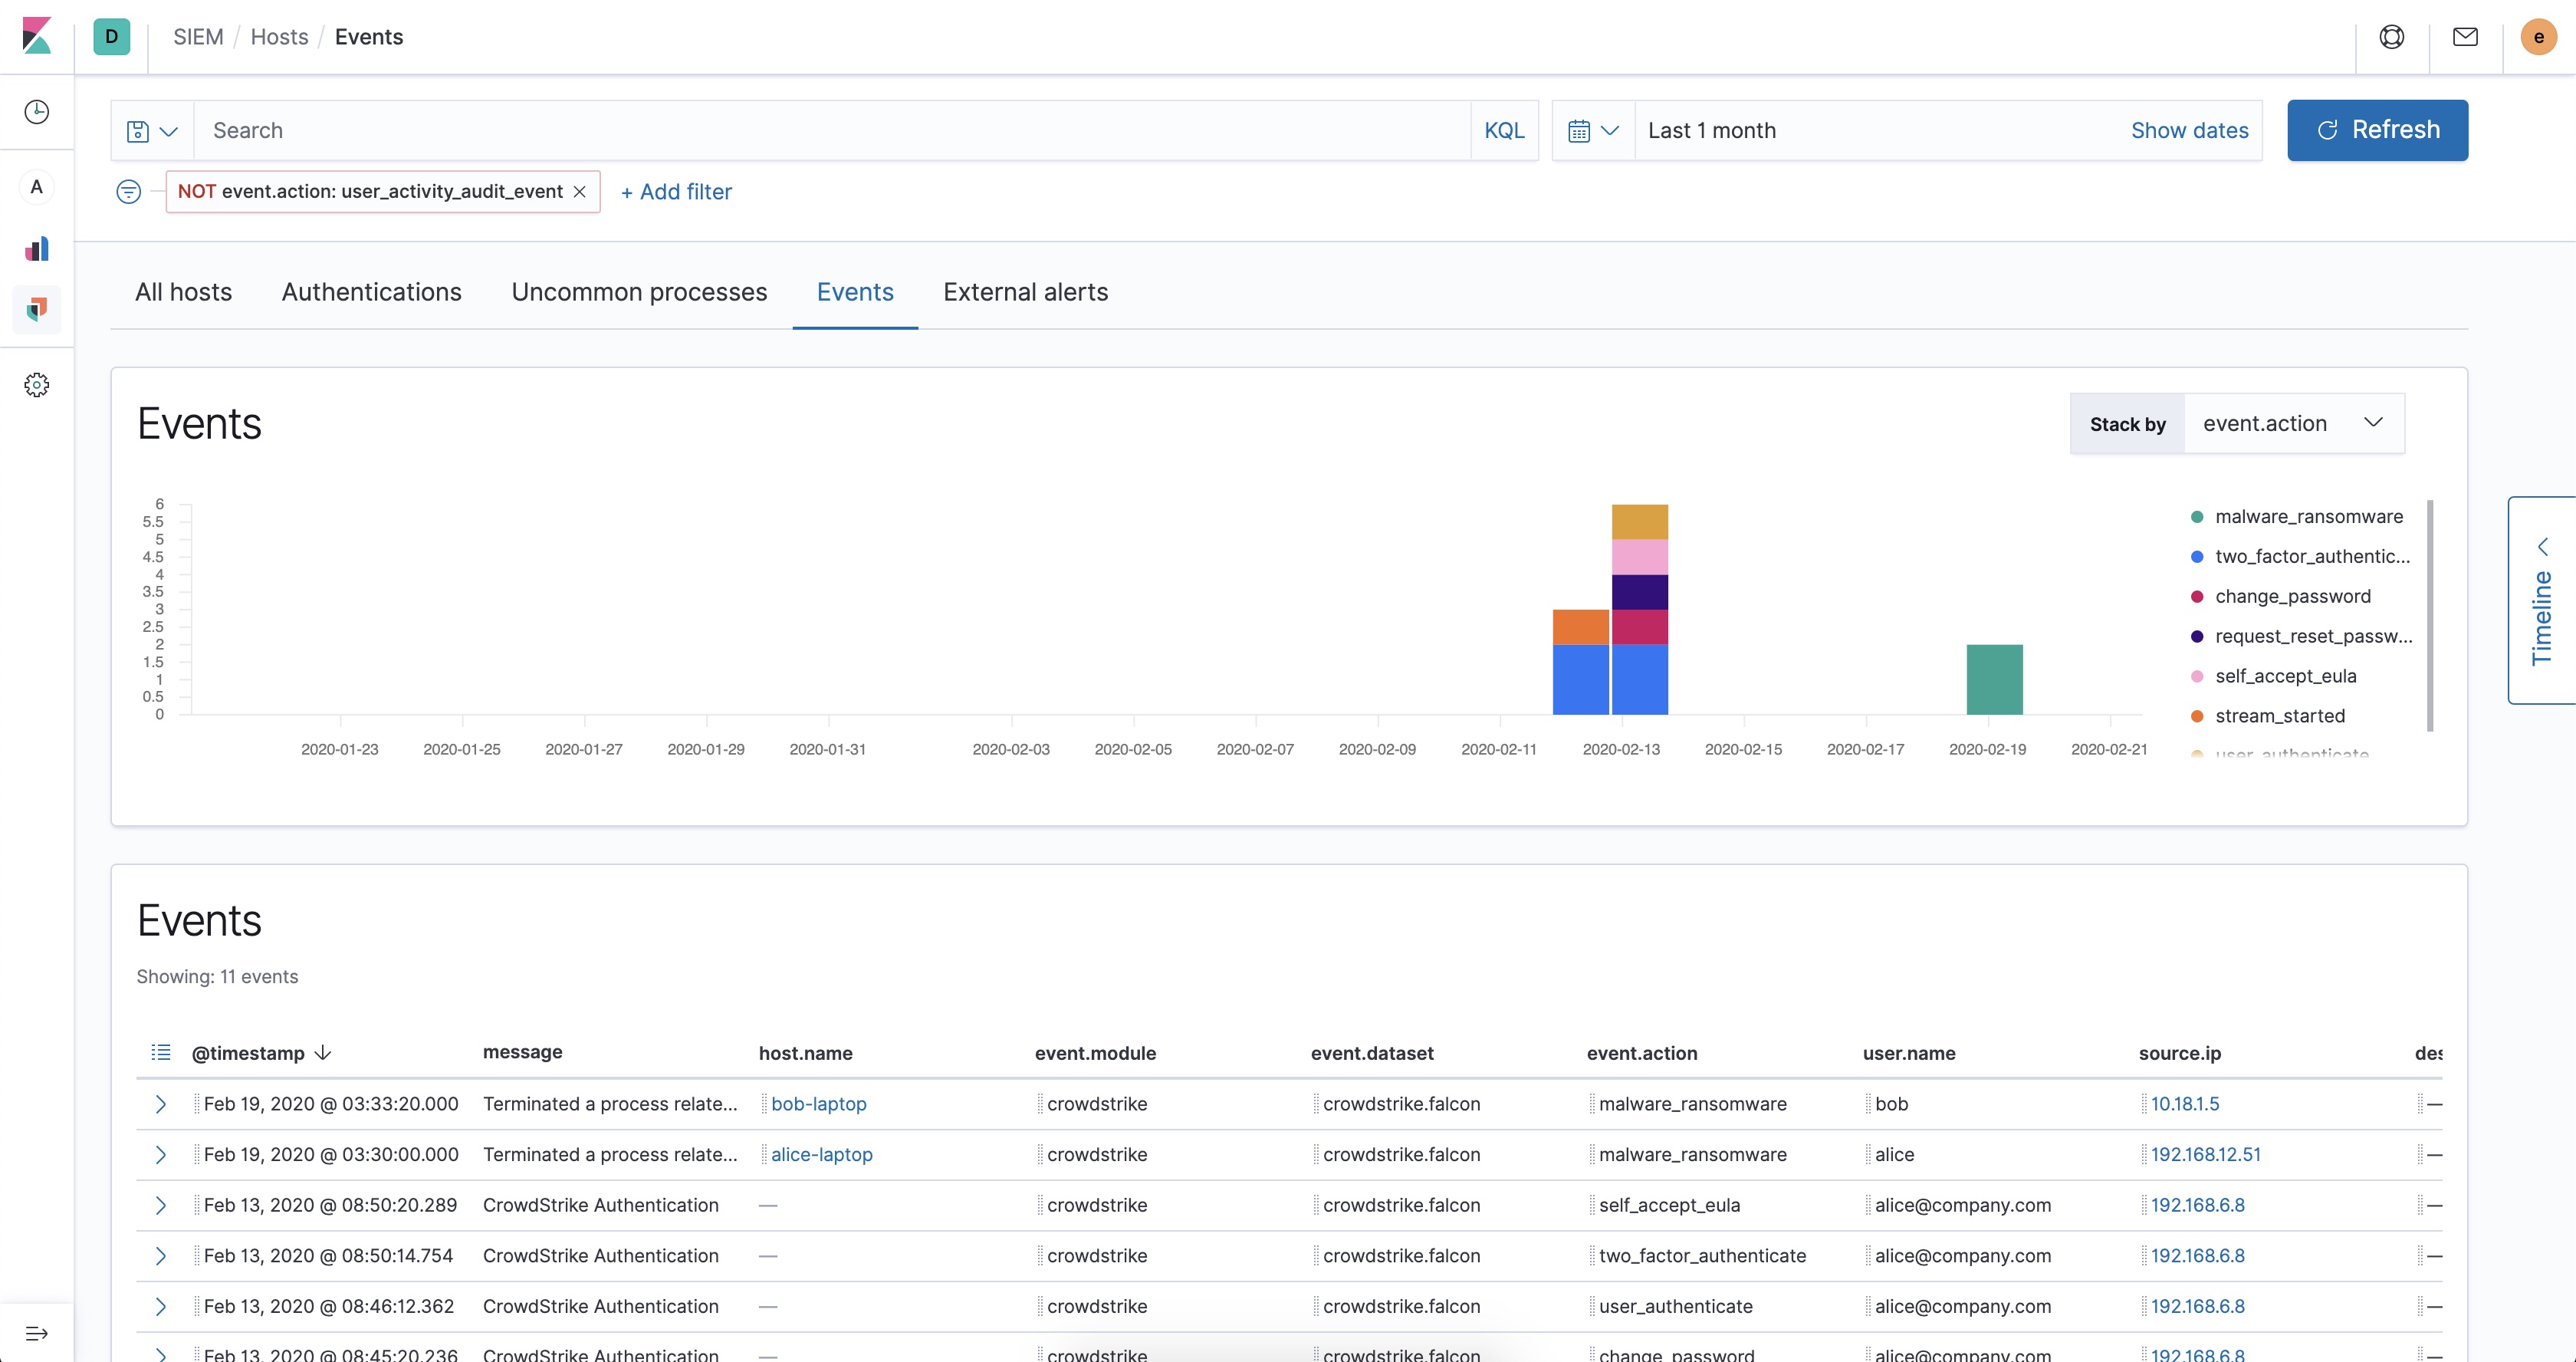
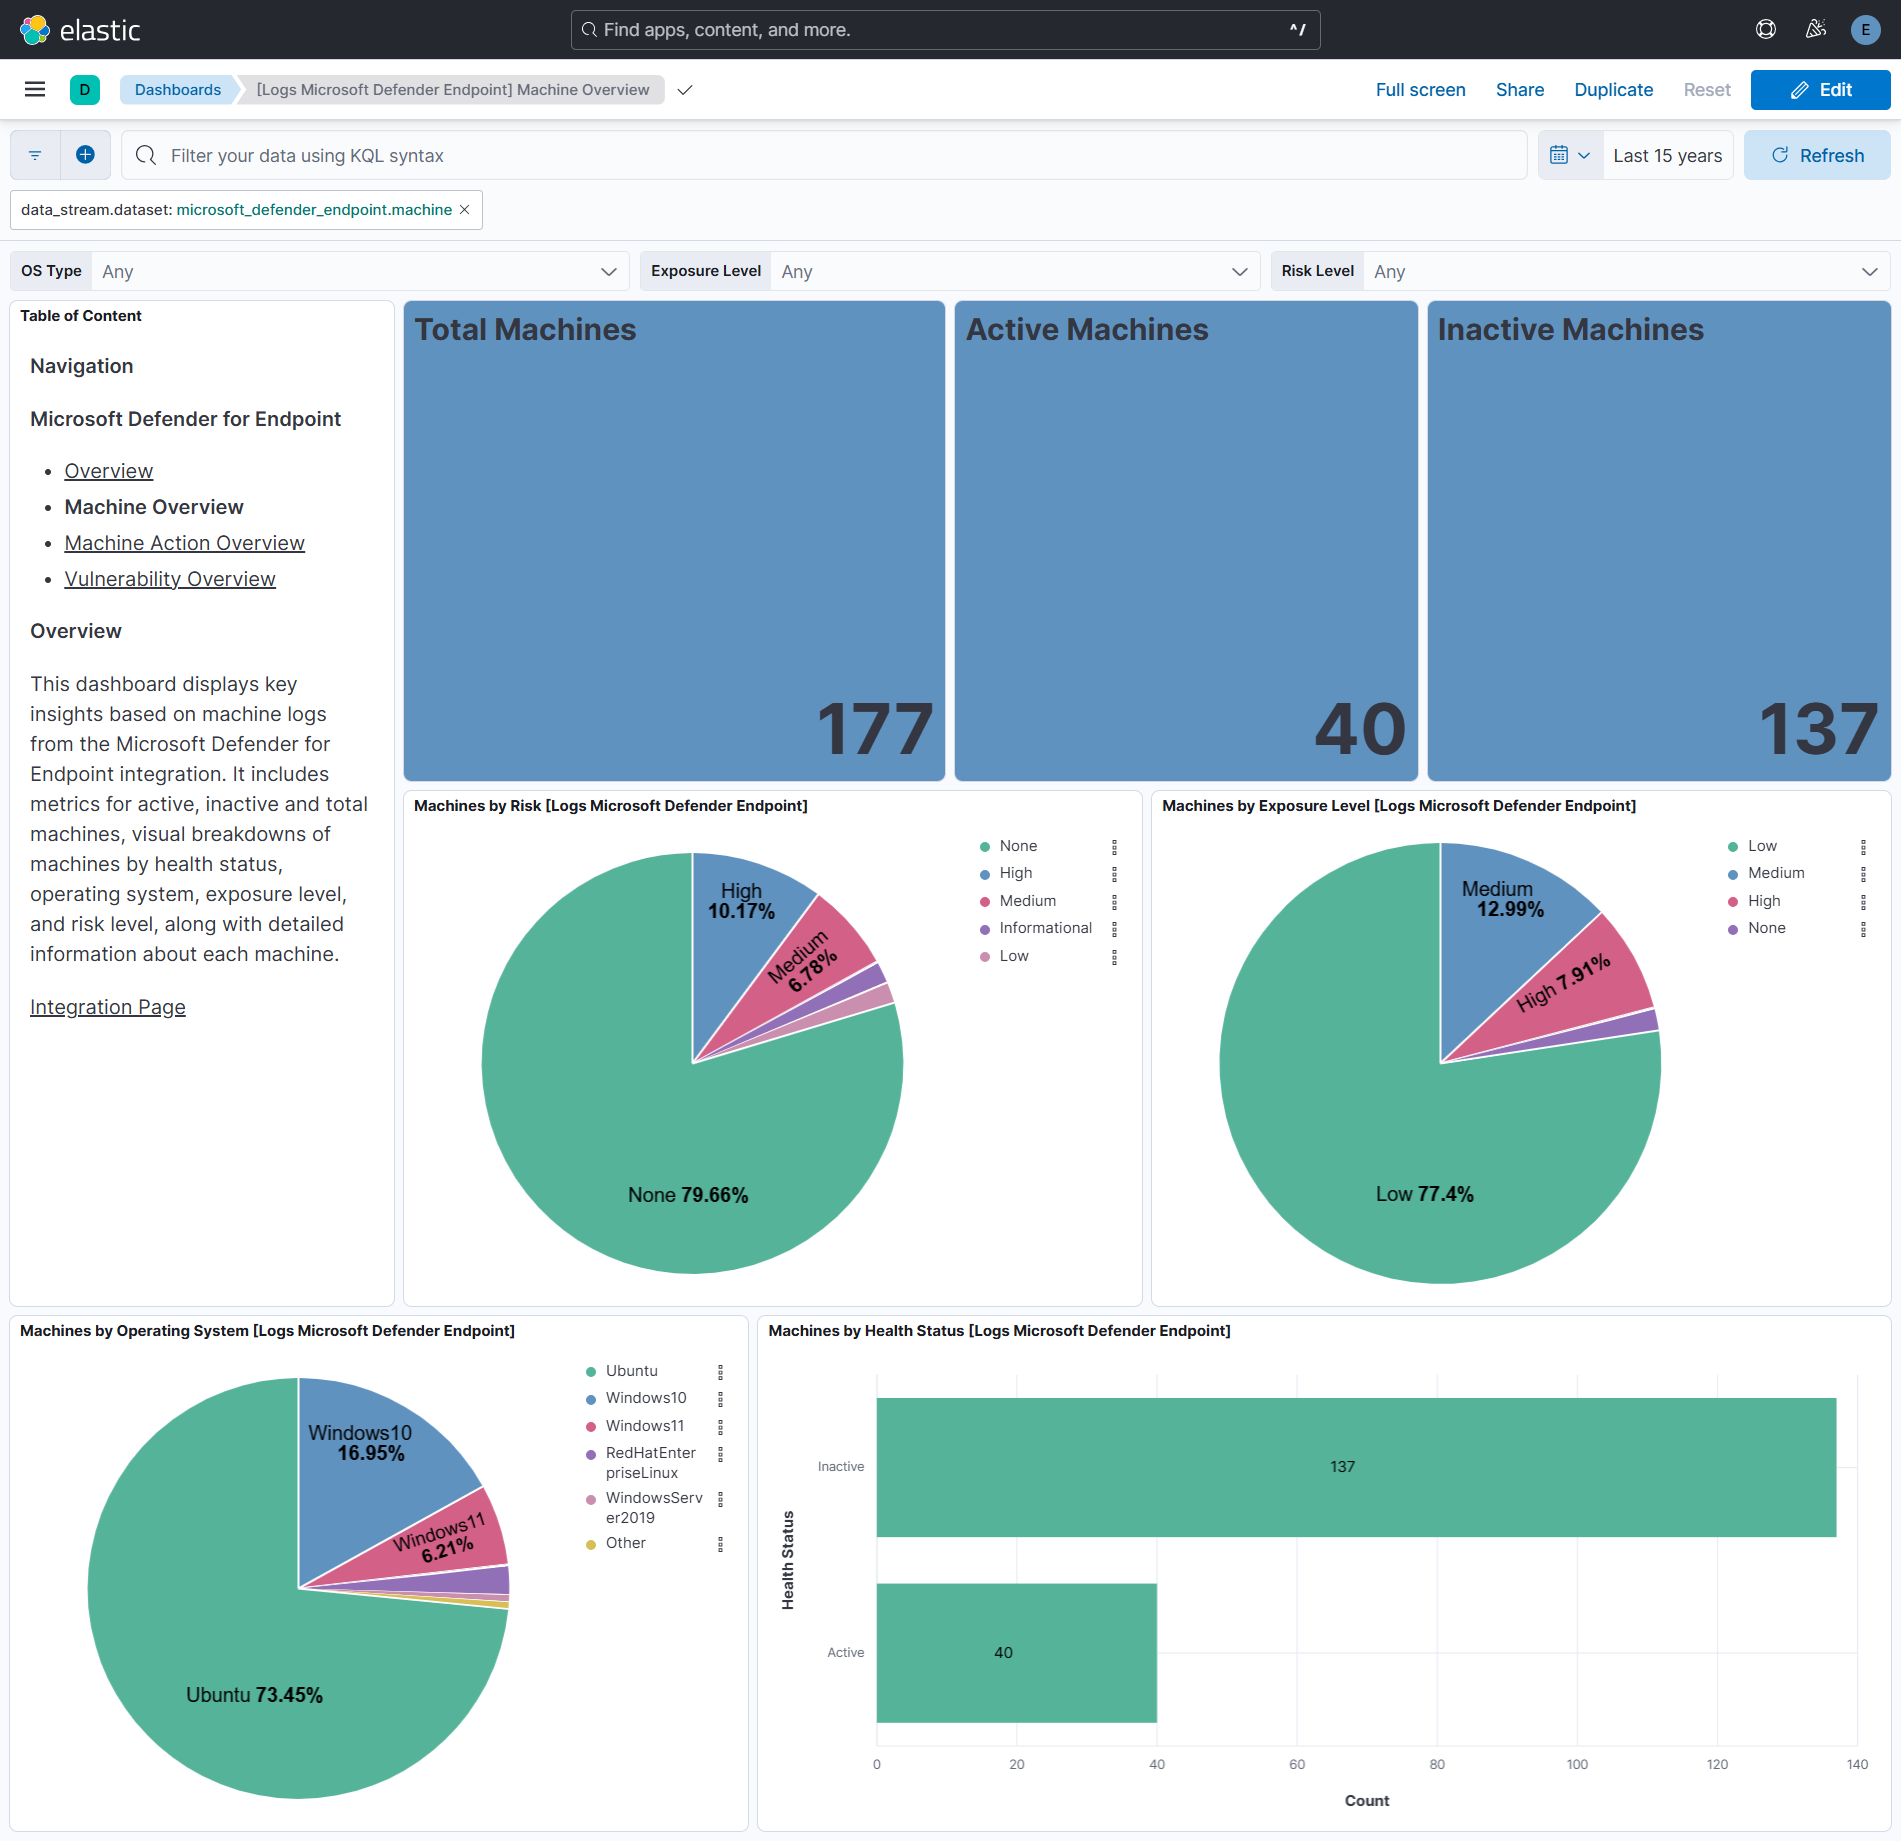
This integration includes one or more Kibana dashboards that visualizes the data collected by the integration. The screenshots below illustrate how the ingested data is displayed.
Changelog
| Version | Details | Minimum Kibana version |
|---|---|---|
| 4.3.0 | Enhancement (View pull request) Update the documentation to reflect the latest changes in the vulnerability data stream. |
9.1.2 8.19.3 |
| 4.2.0 | Enhancement (View pull request) Add cloudsecurity_cdr sub category label |
9.1.2 8.19.3 |
| 4.1.2 | Bug fix (View pull request) Handle expired URLs in vulnerability data stream. |
9.1.2 8.19.3 |
| 4.1.1 | Bug fix (View pull request) Update transform to filter out documents containing an error.message from vulnerability latest index |
9.1.2 8.19.3 |
| 4.1.0 | Enhancement (View pull request) Add support for OAuth2 Endpoint Params option. |
9.1.2 8.19.3 |
| 4.0.0 | Enhancement (View pull request) Fetch vulnerability data using SoftwareVulnerabilitiesExport API endpoint. Breaking change (View pull request) The following fields are no longer available in the new implementation: "cloud.provider", "cloud.resource_id", "cloud.instance.id", "host.geo", "host.ip", "host.risk.calculated_level", "related.ip", "vulnerability.description", "vulnerability.published_date", "vulnerability.score.version". |
9.1.2 8.19.3 |
| 3.1.2 | Bug fix (View pull request) Ensure page_size configuration is preserved in CEL evaluation responses. |
9.1.2 8.19.2 |
| 3.1.1 | Bug fix (View pull request) Ensure large $skip API parameter values are correctly formatted in vulnerability data stream. |
9.1.2 8.19.2 |
| 3.1.0 | Enhancement (View pull request) Add vulnerability_workflow sub category label. |
9.1.2 8.19.2 |
| 3.0.1 | Bug fix (View pull request) Extract process.name from process.command_line in log data stream. |
9.1.2 8.19.2 |
| 3.0.0 | Breaking change (View pull request) Add mapping changes and latest transform in vulnerability data stream for Cloud Detection and Response (CDR) vulnerability workflow. |
9.1.2 8.19.2 |
| 2.43.0 | Enhancement (View pull request) Add support for SSL configuration for log data stream. |
9.0.0 8.18.0 |
| 2.42.2 | Bug fix (View pull request) Fix handling of empty string IP values. |
9.0.0 8.18.0 |
| 2.42.1 | Bug fix (View pull request) Fix agent handling of empty and error results in vulnerability data stream. |
9.0.0 8.18.0 |
| 2.42.0 | Enhancement (View pull request) Add process.name ECS mapping in log data stream. |
9.0.0 8.18.0 |
| 2.41.0 | Enhancement (View pull request) Use terminate processor instead of fail processor to handle agent errors. |
9.0.0 8.18.0 |
| 2.40.0 | Enhancement (View pull request) Added support for Initial Interval in Config Options. |
9.0.0 8.18.0 |
| 2.39.0 | Enhancement (View pull request) Standardize user fields processing across integrations. |
9.0.0 8.18.0 |
| 2.38.1 | Bug fix (View pull request) Add temporary processor to remove the fields added by the Agentless policy. |
9.0.0 8.18.0 |
| 2.38.0 | Enhancement (View pull request) Add vulnerability data stream. |
9.0.0 8.18.0 |
| 2.37.0 | Enhancement (View pull request) Map microsoft_defender_endpoint.machine.aad_device_id to device.id. |
9.0.0 8.18.0 |
| 2.36.0 | Enhancement (View pull request) Add process.entity_id and process.parent.entity_id ECS mappings in log data stream. |
9.0.0 8.18.0 |
| 2.35.0 | Enhancement (View pull request) Normalize event.severity values across EDR integrations. |
9.0.0 8.18.0 |
| 2.34.0 | Enhancement (View pull request) Remove redundant installation instructions. |
9.0.0 8.18.0 |
| 2.33.1 | Bug fix (View pull request) Fix default request trace enabled behavior. |
9.0.0 8.18.0 |
| 2.33.0 | Enhancement (View pull request) Add machine and machine action data streams. |
9.0.0 8.18.0 |
| 2.32.0 | Enhancement (View pull request) Update host.* ECS mappings. |
9.0.0 8.18.0 |
| 2.31.0 | Enhancement (View pull request) Enable request trace log removal. |
9.0.0 8.18.0 |
| 2.30.1 | Bug fix (View pull request) Fix overview dashboard by removing reference to event.integration. |
9.0.0 8.18.0 |
| 2.30.0 | Enhancement (View pull request) Enable Agentless deployment. |
9.0.0 8.18.0 |
| 2.29.0 | Enhancement (View pull request) Add support for Kibana 9.0.0 |
9.0.0 8.13.0 |
| 2.28.0 | Enhancement (View pull request) Allow the usage of deprecated log input and support for stack 9.0 |
8.13.0 |
| 2.27.1 | Bug fix (View pull request) Fix null reference for description field. |
8.13.0 |
| 2.27.0 | Enhancement (View pull request) Do not remove event.original in main ingest pipeline. |
8.13.0 |
| 2.26.0 | Enhancement (View pull request) Add "preserve_original_event" tag to documents with event.kind set to "pipeline_error". |
8.13.0 |
| 2.25.1 | Bug fix (View pull request) Use triple-brace Mustache templating when referencing variables in ingest pipelines. |
8.13.0 |
| 2.25.0 | Enhancement (View pull request) Update the kibana constraint to ^8.13.0. Modified the field definitions to remove ECS fields made redundant by the ecs@mappings component template. |
8.13.0 |
| 2.24.2 | Bug fix (View pull request) Fix bug handling message field when events are received from Logstash with ecs_compatibility turned on. |
8.12.0 |
| 2.24.1 | Bug fix (View pull request) Fix handling of empty arrays. |
8.12.0 |
| 2.24.0 | Enhancement (View pull request) Set sensitive values as secret. |
8.12.0 |
| 2.23.3 | Bug fix (View pull request) Clean up null handling |
8.7.1 |
| 2.23.2 | Enhancement (View pull request) Changed owners |
8.7.1 |
| 2.23.1 | Bug fix (View pull request) Fix exclude_files pattern. |
8.7.1 |
| 2.23.0 | Enhancement (View pull request) Limit request tracer log count to five. |
8.7.1 |
| 2.22.0 | Enhancement (View pull request) ECS version updated to 8.11.0. |
8.7.1 |
| 2.21.0 | Enhancement (View pull request) Improve 'event.original' check to avoid errors if set. |
8.7.1 |
| 2.20.0 | Enhancement (View pull request) Update the package format_version to 3.0.0. |
8.7.1 |
| 2.19.0 | Enhancement (View pull request) Update package to ECS 8.10.0 and align ECS categorization fields. |
8.7.1 |
| 2.18.0 | Enhancement (View pull request) Add tags.yml file so that integration's dashboards and saved searches are tagged with "Security Solution" and displayed in the Security Solution UI. |
8.7.1 |
| 2.17.0 | Enhancement (View pull request) Update package to ECS 8.9.0. |
8.7.1 |
| 2.16.0 | Enhancement (View pull request) Update package-spec to 2.9.0. |
8.7.1 |
| 2.15.0 | Enhancement (View pull request) Convert visualizations to lens. |
8.7.1 |
| 2.14.0 | Enhancement (View pull request) Document valid duration units. |
8.7.1 |
| 2.13.0 | Enhancement (View pull request) Ensure event.kind is correctly set for pipeline errors. |
8.7.1 |
| 2.12.0 | Enhancement (View pull request) Update package to ECS 8.8.0. |
8.7.1 |
| 2.11.0 | Enhancement (View pull request) Lowercase host.name field |
8.7.1 |
| 2.10.0 | Enhancement (View pull request) Add a new flag to enable request tracing |
8.7.1 |
| 2.9.0 | Enhancement (View pull request) Update package to ECS 8.7.0. |
8.1.0 |
| 2.8.2 | Enhancement (View pull request) Added categories and/or subcategories. |
8.1.0 |
| 2.8.1 | Bug fix (View pull request) Drop empty event sets. |
8.1.0 |
| 2.8.0 | Enhancement (View pull request) Adding support for Oauth2 scopes that is required for some users |
8.1.0 |
| 2.7.0 | Enhancement (View pull request) Update package to ECS 8.6.0. |
8.1.0 |
| 2.6.0 | Enhancement (View pull request) Adds support for newer Oauth Token URL |
8.1.0 |
| 2.5.2 | Enhancement (View pull request) Migrate the visualizations to by value in dashboards to minimize the saved object clutter and reduce time to load |
8.1.0 |
| 2.5.1 | Bug fix (View pull request) Remove duplicate fields. |
8.0.0 7.14.1 |
| 2.5.0 | Enhancement (View pull request) Update package to ECS 8.5.0. |
8.0.0 7.14.1 |
| 2.4.0 | Enhancement (View pull request) Update package to ECS 8.4.0 |
8.0.0 7.14.1 |
| 2.3.1 | Bug fix (View pull request) Fix proxy URL documentation rendering. |
8.0.0 7.14.1 |
| 2.3.0 | Enhancement (View pull request) Update package to ECS 8.3.0. |
8.0.0 7.14.1 |
| 2.2.1 | Enhancement (View pull request) Update to Readme to include link to vendor documentation |
8.0.0 7.14.1 |
| 2.2.0 | Enhancement (View pull request) Update to ECS 8.2 |
8.0.0 7.14.1 |
| 2.1.0 | Enhancement (View pull request) Add possibility to choose azure resource |
8.0.0 7.14.1 |
| 2.0.1 | Enhancement (View pull request) Add documentation for multi-fields |
8.0.0 7.14.1 |
| 2.0.0 | Enhancement (View pull request) Update to ECS 8.0 |
8.0.0 7.14.1 |
| 1.1.0 | Enhancement (View pull request) Add 8.0.0 version constraint |
8.0.0 7.14.1 |
| 1.0.2 | Enhancement (View pull request) Update Title and Description. |
7.14.1 |
| 1.0.1 | Bug fix (View pull request) Fix logic that checks for the 'forwarded' tag |
— |
| 1.0.0 | Enhancement (View pull request) First version |
— |
