What is continuous profiling?
Continuous profiling defined
Continuous profiling is the process of constantly collecting performance data from running applications in live production environments in order to optimize performance and improve resource usage.
Unlike traditional methods which sample data ad-hoc or on-demand, continuous profiling captures metrics in real-time. This provides a far more accurate and current picture of application performance and behavior. It also focuses specifically on production environments, tracking resource utilization and providing code-level insights. This is not only helpful in the short-term, but also enables long-term analysis with minimal overhead.
Its evolution from traditional profiling practices is highlighted by several important advancements. This includes the shift from ad-hoc analysis to continuous data collection, heavily reduced performance impact via eBPF innovation, and its integration with observability tools. Modern continuous profilers also incorporate automated analysis features that use AI and machine learning and can support a range of programming languages. They’re also built to work well with both distributed and cloud-native systems.
Importance of continuous profiling
Performance bottleneck identification and resolution
Continuous profiling makes it possible to detect and resolve performance bottlenecks in real time. By constantly collecting resource utilization data like CPU, memory, disk I/O, etc, you get detailed insights into system behavior as it happens. This means developers can pinpoint exactly where there are inefficiencies within their code, so they can resolve performance issues and improve overall application performance proactively.
Development team advantages
Continuous profiling will also enhance code quality by making it easy for developers to identify and address performance issues that might not appear in development or test environments. This will lead to production code that’s more robust and efficient. It also enhances troubleshooting by making it possible to analyze data in real time, which means quicker identification of intermittent issues. This reduces debugging time and enhances productivity. By providing insights into application performance and behavior, continuous profiling also helps SRE teams with scalability and reliability. That’s because they can make sure an application can handle increased loads without seeing a drop in performance.
Business benefits
By using continuous profiling to optimize resource usage, it can help a business reduce costs by lowering their cloud resource consumption and associated costs. It can also help to minimize the carbon footprint of data centers, helping companies improve overall environmental responsibility in the tech industry.
Improving the performance of an application can also indirectly create a better user experience for users, which can result in better customer satisfaction and potentially improved customer retention.
How continuous profiling works
Step 1: Data collection
The first step in continuous profiling is collecting the data it needs. This process typically uses low-overhead sampling techniques to collect metrics such as memory allocation, CPU usage, and I/O operations. This is done by integrating tools like eBPF, JProfiler, and Universal Profiling from Elastic.
These tools are integrated into systems using agents, libraries, or kernel modules. The method depends on the specific technology you choose, and the level of access required. There are also differences in the profiling approaches with their impact and resource requirements:
- Lightweight, always-on profilers: These have minimal overhead, making them suitable for continuous use in production.
- Sampling profilers: These perform periodic data collection, with low to moderate overhead.
- Instrumentation profilers: These collect more detailed data, but with higher overhead. Often used in development, testing, or staging environments.
- Tracing tools: These carry out comprehensive data collection, but with significant overhead. Typically used for specific debugging sessions.
Step 2: Analysis
Once the data has been collected, it is then analyzed to identify things like performance bottlenecks, resource usage patterns, and potential optimizations. This analysis process often involves aggregating data over time, cross-referencing it with application events, and applying statistical methods to detect anomalies and trends. The goal of this stage is to transform the data into actionable insights.
Continuous profiling can also be associated with application performance monitoring (APM) data such as traces to understand exactly what code was run when a particular trace occurred, accelerating mean time to root cause by improving context.
Advanced techniques are often used at this stage to improve the analysis, including the use of machine learning and AI tools. These can be especially good at automatically classifying problems, predicting future performance, and suggesting optimizations that can be made.
Step 3: Visualization
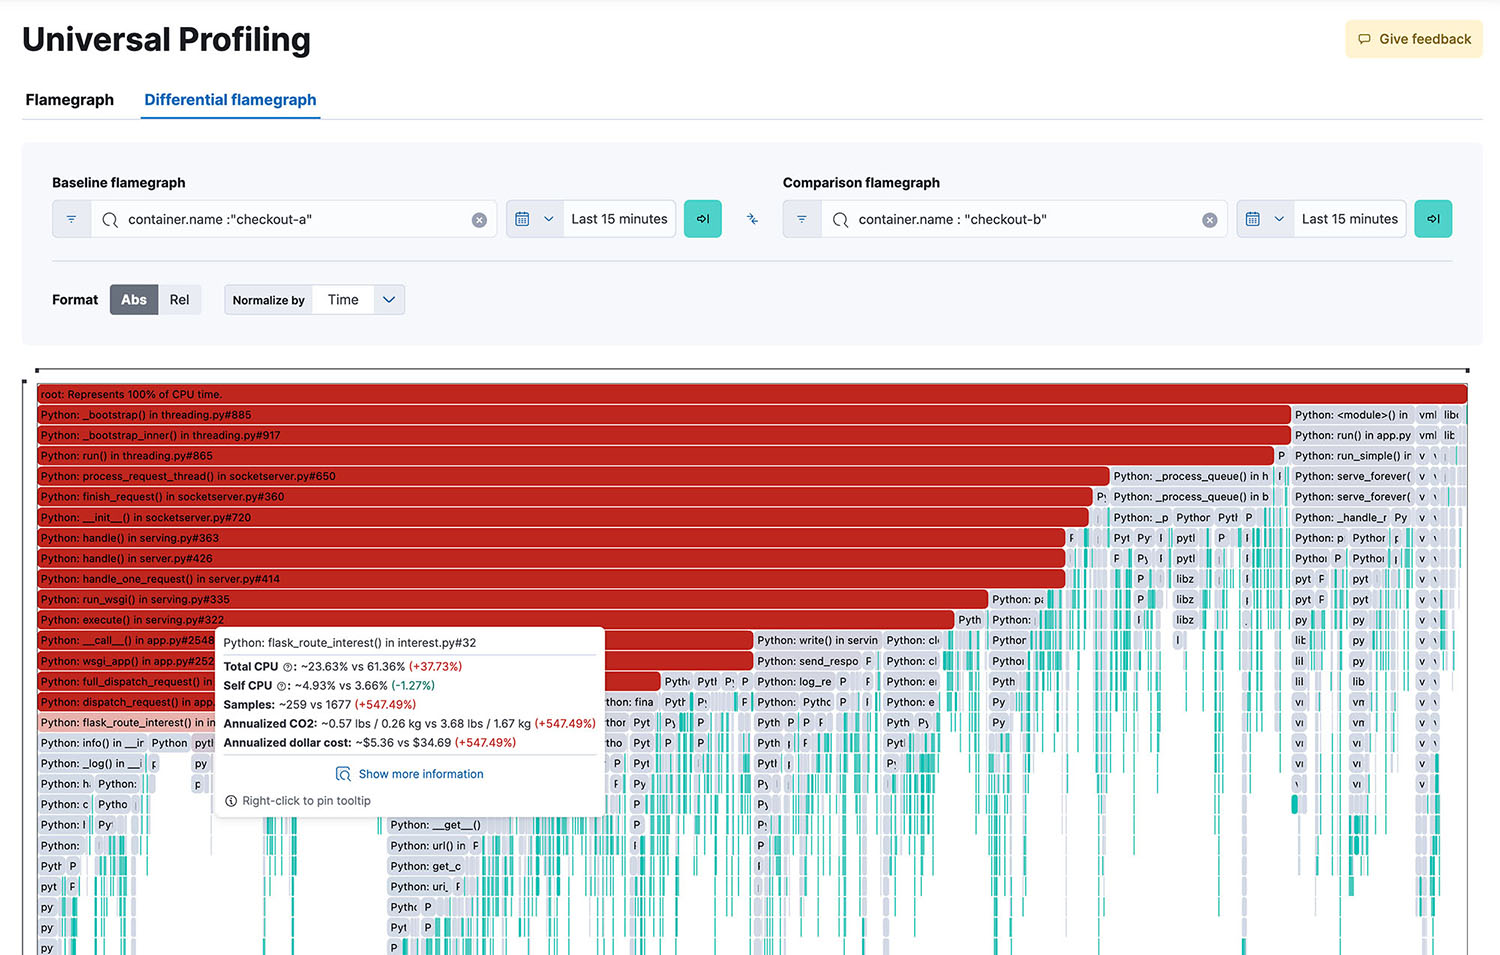
The visualization step transforms the complex performance data collected into intuitive, easy-to-digest visual representations. This is the step that helps developers and operations teams to quickly identify the performance bottlenecks, usage patterns, and areas for optimization. Common techniques include flamegraphs, which makes it easy to spot hot code paths, and icicle charts, which represent where relative time is spent in different parts of code.
These visualizations are often interactive, making it possible for the viewer to zoom in, filter data, and drill down into specific problem areas or functions. Most profiling tools provide dashboards that bring together multiple visualizations and metrics into one place.
Continuous profiling in practice
Use cases
- Ecommerce platform optimization: Use continuous profiling to identify slow database queries that are impacting the checkout process, and reduce page load times by optimizing resource-intensive functions.
- Microservices architecture performance: Pinpoint specific bottlenecks in inter-service communications and optimize resource allocation across all distributed systems. Cloud cost optimization: Identify inefficient code that’s causing excessive memory and/or CPU usage, and reduce cloud hosting costs by optimizing resource usage.
- Real-time data processing systems: Detect and address data processing bottlenecks, and optimize stream processing pipelines to reduce latency.
- Incident management and resolution: Identify the root cause of performance issues quickly, which reduces the Mean Time to Resolution (MTTR).
Best practices
- Integrate continuous profiling early in the development process and use low-overhead sampling techniques.
- Automate data collection, analysis, and alerting for consistency and fast response.
- Connect with your existing APM and observability tools for comprehensive insights.
- Implement CI/CD pipeline integration in order to get continuous profiling for unit test runs.
- Establish regular review routines and feedback loops for all ongoing optimization.
- Keep all profiling tools up to date and regularly maintained.
- Train team members how to interpret and effectively analyze profiling data.
Challenges and limitations of continuous profiling
Performance overhead
Even with low-overhead sampling techniques, every type of continuous profiling will introduce some performance overhead for the systems being monitored. They could impact the application performance, especially in resource-constrained environments. These are three things you can do to minimize performance overhead:
- Where you can, use eBPF-based profilers that have minimal overhead
- Implement adaptive profiling to reduce frequency during high-load periods
- Focus on profiling only critical components rather than entire systems
Data privacy concerns
As with any process that includes data collection, there is a risk that the data collected includes sensitive information, especially user data. To address these issues:
- Implement strong access controls and encryption for all profiling data
- Anonymize or obfuscate sensitive data before storing, sharing, or displaying
- Adhere strictly to any relevant data protection regulations
Data storage and management
Continuous profiling can generate large volumes of data that will need to be stored and managed. This needs to be done efficiently, with strategies like:
- Implement data retention policies that limit storage duration
- Compress the data
- Leverage cloud storage to improve scalability
Future trends, support from OpenTelemetry
Technology is always changing and evolving, which can both enhance continuous profiling, and create new and unexpected challenges. You can't proactively anticipate these, but it's important to be aware of new tools or techniques, so you can decide whether they're a good fit for your business.
For example, OpenTelemetry recently announced that it now supports profiling and is working on a profiling data model based on open standards. Industry changes like this can make a huge difference to adopting continuous profiling into your observability platform while minimizing vendor lock-in.
Continuous profiling with Elastic
Elastic launched Universal Profiling, which provides companies whole-system, always-on profiling throughout their development pipeline. It uses eBPF profiling to capture only the necessary data, and integrates with OpenTelemetry to enhance observability and reveal deeper insights. Elastic offers teams:
- Whole-system visibility: Elastic Universal Profiling captures and analyzes data from your kernel, application code, and third-party libraries.
- Frictionless deployment: The agent can be deployed without intrusive operations or changes to application source code, so it’s easy to start receiving profiling data within minutes.
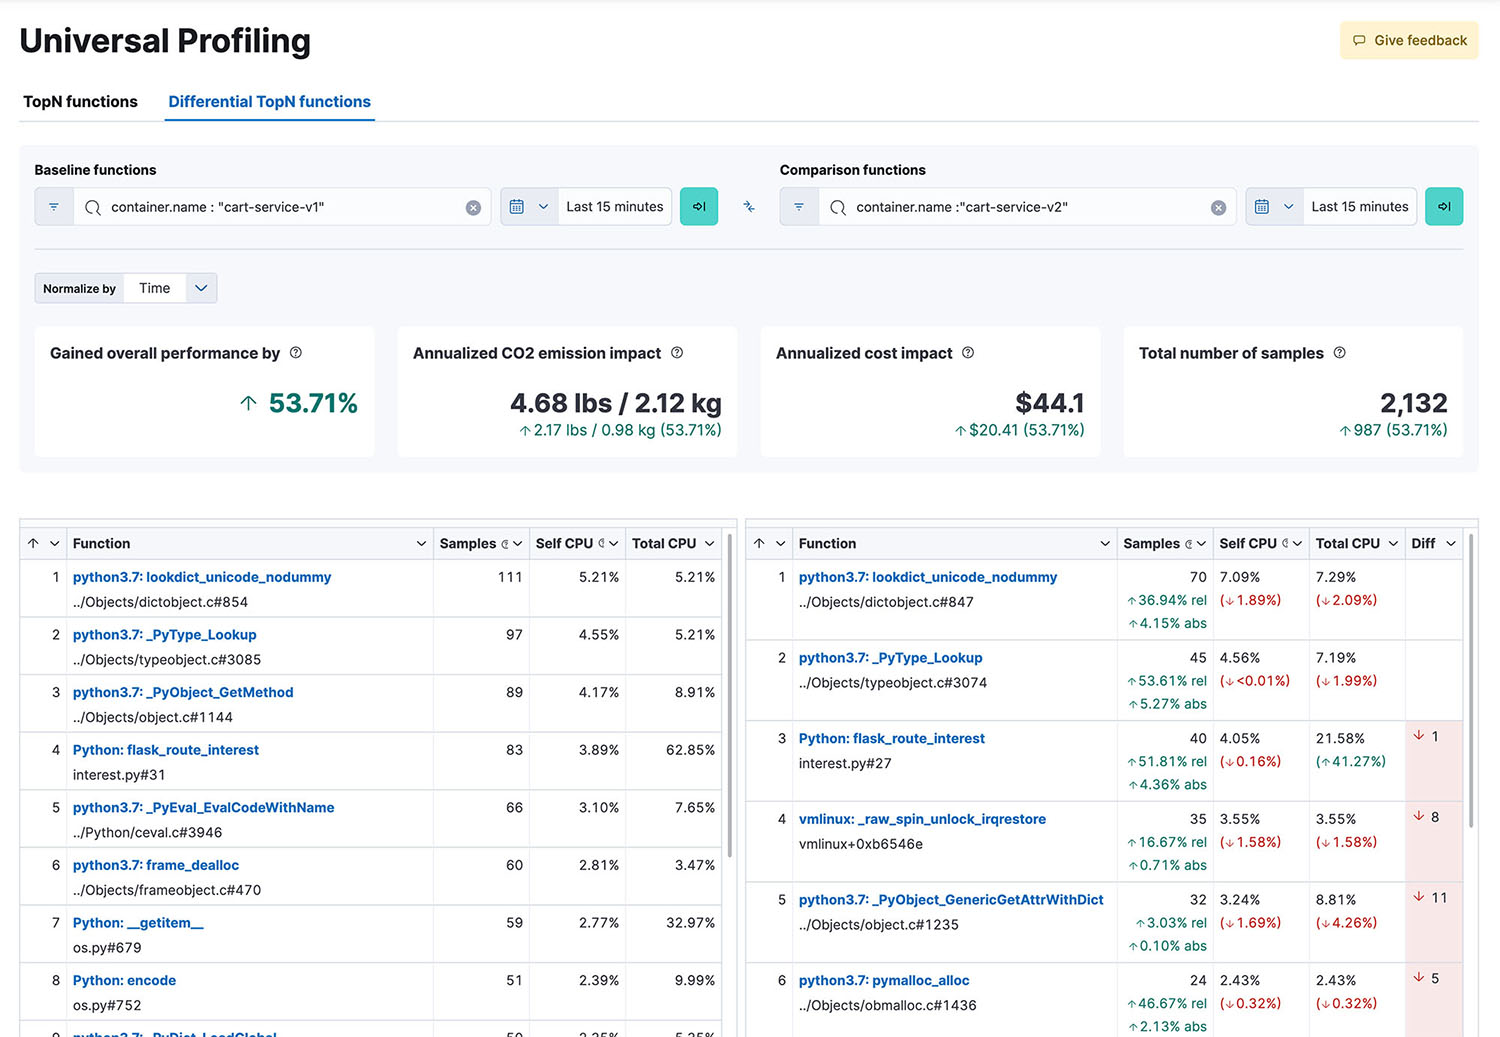
- Data visualization: Profiling data can be inspected through stack traces, flamegraphs, and function views in Kibana, making it simple to filter and compare data over time to identify performance improvements or detect regressions.